HAL Id: hal-00296956
https://hal.archives-ouvertes.fr/hal-00296956
Submitted on 26 Sep 2006
HAL is a multi-disciplinary open access
archive for the deposit and dissemination of
sci-entific research documents, whether they are
pub-lished or not. The documents may come from
teaching and research institutions in France or
abroad, or from public or private research centers.
L’archive ouverte pluridisciplinaire HAL, est
destinée au dépôt et à la diffusion de documents
scientifiques de niveau recherche, publiés ou non,
émanant des établissements d’enseignement et de
recherche français ou étrangers, des laboratoires
publics ou privés.
Multiscale investigations in a mesoscale catchment ?
hydrological modelling in the Gera catchment
P. Krause, F. Bäse, U. Bende-Michl, M. Fink, W. Flügel, B. Pfennig
To cite this version:
P. Krause, F. Bäse, U. Bende-Michl, M. Fink, W. Flügel, et al.. Multiscale investigations in a mesoscale
catchment ? hydrological modelling in the Gera catchment. Advances in Geosciences, European
Geosciences Union, 2006, 9, pp.53-61. �hal-00296956�
www.adv-geosci.net/9/53/2006/
© Author(s) 2006. This work is licensed under a Creative Commons License.
Advances in
Geosciences
Multiscale investigations in a mesoscale catchment – hydrological
modelling in the Gera catchment
P. Krause, F. B¨ase, U. Bende-Michl, M. Fink, W. Fl ¨ugel, and B. Pfennig
Department for Geoinformatics, Hydrology and Modelling, Friedrich-Schiller-University, Jena, Germany Received: 23 January 2006 – Revised: 22 May 2006 – Accepted: 3 July 2006 – Published: 26 September 2006
Abstract. The application of the hydrological process-oriented model J2000 (J2K) is part of a cooperation project between the Thuringian Environmental Agency (Th¨uringer Landesanstalt f¨ur Umwelt und Geologie – TLUG) and the Department of Geoinformatics of the Friedrich-Schiller-University Jena focussing on the implementation of the EU water framework directive (WFD). In the first project phase J2K was parametrised and calibrated for a mesoscale catch-ment to quantify if it can be used as hydrological part of a multi-objective tool-box needed for the implementation of the WFD. The main objectives for that pilot study were:
1. The development and application of a suitable distri-bution concept which provide the spatial data basis for various tasks and which reflects the specific physiogeo-graphical variability and heterogeneity of river basins adequately. This distribution concept should consider the following constraints: The absolute number of spa-tial entities, which forms the basis for any distributive modelling should be as small as possible, but the spa-tial distributed factors, which controls quantitative and qualitative hydrological processes should not be gener-alised to much. The distribution concept of hydrolog-ical response units HRUs (Fl¨ugel, 1995) was selected and enhanced by a topological routing scheme (Stau-denrausch, 2001) for the simulation of lateral flow pro-cesses.
2. J2K should be calibrated for one subbasin of the pilot watershed only. Then the parameter set should be used on the other subbasins (referred as transfer basins) to in-vestigate and quantify the transferability of a calibrated model and potential spatial dependencies of its parame-ter set. In addition, potential structural problems in the process description should be identified by the transfer
Correspondence to: P. Krause
(p.krause@uni-jena.de)
to basins which show a different process dominance as the one which was used for calibration does.
3. Model calibration and selection of efficiency criteria for the quantification of the model quality should be based on a comprehensive sensitivity and uncertainty analysis (B¨ase, 2005) and multi-response validations with inde-pendent data sets (Krause and Fl¨ugel, 2005) carried out in advance in the headwater part of the calibration basin. 4. To obtain good results in the transfer basins the cali-brated parameter set could be adjusted slightly. This step was considered as necessary because of specific constraints which were not of significant importance in the calibration basin. This readjustment should be car-ried out on parameters which show a sensitive reaction on the identified differences in the environmental setup. 5. Potential scaling problems of the process description, distribution concept or model structure should be identi-fied by the comparison of the modelling results obtained in a small headwater region of the calibration basin with observed streamflow to find out if the selected efficiency measures show a significant change.
1 Introduction
The European Water Framework Directive (WFD), adopted in 2000, requires a general ecological protection and a min-imum chemical standard to be achieved in all European sur-face waters based on the watershed scale. All member states of the EU have to develop river basin management action plans to achieve these goals up to 2015. In Germany this pro-cedure has to be coordinated and decided by the federal water agencies in cooperation with their respective ministries. In the state of Thuringia the Thuringian Environmental Agency (TLUG) is in charge of the work tasks for the implementa-tion the WFD. To quantify the applicability of hydrological
54 P. Krause et al.: Multiscale investigations in a mesoscale catchment
2 P. Krause et al.: Multiscale Investigations in a Mesoscale Catchment
an integrated tool-box which provides custom-tailored soft-ware solutions for the challenges exposed by the WFD.
The first stage of the project did comprise the parametrisa-tion and applicaparametrisa-tion of a distributed hydrological modelling system in a selected pilot watershed to define an appropriate basis for ongoing development in terms of distributed hydro-logical quantitative process descriptions. For this the object and process-oriented hydrological model J2000 (e.g. Krause 2001, 2002) was selected. The results of this work stage are described in this paper.
2 Catchment description
For the study presented in this paper the catchment of the Gera river in Thuringia was selected. The selection was based on specific criteria determined by the overall project objectives:
1. The catchment should be representative for central Ger-many in terms of its natural conditions: It should comprise different topographical conditions like mid-mountain regions, low-land areas and intermediate re-gions with rolling terrain. The most important land-use/land-cover forms such as larger forest, mixtures of pasture and agriculture, intensive agriculture and urban areas should be located inside the basin and it should comprise the typical soil types and hydro-geological formations. In addition, the catchment should show var-ious climatological and hydrological regimes ranging from cold and wet regions, which features high precip-itation rates, low evapotranspiration and a considerable snow influence, down to warm and dry regions with low precipitation and higher evapotranspiration.
2. The catchment should be of upper meso to lower macro scale size to analyse different scales ranging from small headwater catchments (area < 50 km2) up to upper
meso-scale basins (area ≈ 800 - 1500 km2).
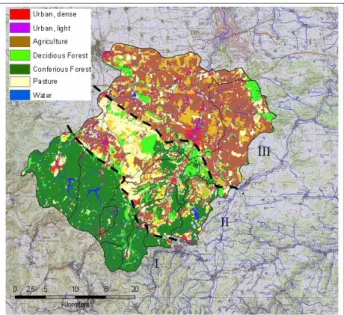
3. The basin’s water and land-use management should cover the typical problem set which allows to investi-gate most of the regional problems in terms of the EU-WFD: I.e. water quality of the different rivers in the catchment should cover the full range from good eco-logical status to major pollution by diffuse sources as well as point sources like waste water inflows. Quanti-tative water management should comprise water storage in reservoirs for flood prevention, power generation and drinking water supply as well as groundwater subtrac-tion for drinking water supply or irrigasubtrac-tion purposes. Based on these criteria, the catchment of the river Gera was selected for this project. The catchment has an area of 850 km2 and is situated south of the city Erfurt. The ele-vation ranges between 983 m in the South-West and 200 m a.s.l. at the basin outlet in the North. The main flow direction is from SW to NE. Figure 1 shows the land-use/land-cover of
the catchment and its segmentation into three major regions (marked with roman numbers I-III).
Fig. 1. Land-use/land-cover in the Gera basin. The roman num-bers indicate the different typical regions discussed in the following paragraphs
Region I, the Thuringian Forest (Th¨uringer Wald),
fea-tures higher elevation (600 - 983 m a.s.l) and a typical mid-mountain relief, where deep incised valleys with narrow val-ley floors and steep slopes (25 - 45◦) can be found. The geol-ogy of this region is mostly crystalline schist with only minor groundwater capacity in clefts. Soils are predominantly cam-bisols and in some parts leptosols and podsols with low to moderate useable field capacity of ca. 90 mm. Land-cover is dominated by managed coniferous forest and smaller pasture areas used for stock farming. The mean annual precipitation (MAP) amounts to 1300 mm/a and is relativly high for that German region. The estimated mean annual evapotranspira-tion (MAE) is approximately 400 mm/a. These values result in a mean annual runoff generation (MAR) of ca. 900 mm/a, which equals a runoff-precipitation-ratio of 0.69. The low mean annual temperature (MAT) of only 5-6◦C results in a considerable snow cover in winter and snow melt driven high runoff in spring (TLUG 2004). Because of the high runoff generation and the thread of floods originating from this re-gion, a number of water reservoirs has been constructed in the last 80 years, which can be seen in figure 1 marked as water in the legend.
Region II, the Ilm-Saale limestone plateau (Saale-Ilm
Muschelkalkplatte), follows in N-E direction. This area is classified by lower elevation (300 - 600 m a.s.l) and, in com-parison to region I, a smoother relief. Slopes barely exceeds 10◦; however there are a few locations featuring steeper slopes with values up to 30◦. Triassic limestones dominate this region, which is characterised by karst phenomena. Soils are predominantly cambisols, and in some parts rankers with low to moderate usable field capacity of 80 mm. Land-use
Fig. 1. Land-use/land-cover in the Gera basin. The roman num-bers indicate the different typical regions discussed in the following paragraphs
and solute transport process models for the derivation of sce-narios and management alternatives a cooperation project be-tween the TLUG and the Departure of Geoinformatics at the Friedrich-Schiller-University in Jena was started. The long term outcome of this cooperation will be the development of an integrated tool-box which provides custom-tailored soft-ware solutions for the challenges exposed by the WFD.
The first stage of the project did comprise the parametrisa-tion and applicaparametrisa-tion of a distributed hydrological modelling system in a selected pilot watershed to define an appropriate basis for ongoing development in terms of distributed hydro-logical quantitative process descriptions. For this the object and process-oriented hydrological model J2000 (e.g. Krause 2001, 2002) was selected. The results of this work stage are described in this paper.
2 Catchment description
For the study presented in this paper the catchment of the Gera river in Thuringia was selected. The selection was based on specific criteria determined by the overall project objectives:
1. The catchment should be representative for central Ger-many in terms of its natural conditions: It should comprise different topographical conditions like mid-mountain regions, low-land areas and intermediate re-gions with rolling terrain. The most important land-use/land-cover forms such as larger forest, mixtures of pasture and agriculture, intensive agriculture and urban areas should be located inside the basin and it should
comprise the typical soil types and hydro-geological formations. In addition, the catchment should show var-ious climatological and hydrological regimes ranging from cold and wet regions, which features high precip-itation rates, low evapotranspiration and a considerable snow influence, down to warm and dry regions with low precipitation and higher evapotranspiration.
2. The catchment should be of upper meso to lower macro scale size to analyse different scales ranging from small headwater catchments (area <50 km2) up to up-per meso-scale basins (area ≈800–1500 km2).
3. The basin’s water and land-use management should cover the typical problem set which allows to investi-gate most of the regional problems in terms of the EU-WFD: i.e. water quality of the different rivers in the catchment should cover the full range from good eco-logical status to major pollution by diffuse sources as well as point sources like waste water inflows. Quanti-tative water management should comprise water storage in reservoirs for flood prevention, power generation and drinking water supply as well as groundwater subtrac-tion for drinking water supply or irrigasubtrac-tion purposes. Based on these criteria, the catchment of the river Gera was selected for this project. The catchment has an area of 850 km2and is situated south of the city Erfurt. The elevation ranges between 983 m in the South-West and 200 m a.s.l. at the basin outlet in the North. The main flow direction is from SW to NE. Figure 1 shows the land-use/land-cover of the catchment and its segmentation into three major regions (marked with roman numbers I–III).
Region I, the Thuringian Forest (Th¨uringer Wald), fea-tures higher elevation (600–983 m a.s.l) and a typical mid-mountain relief, where deep incised valleys with narrow val-ley floors and steep slopes (25–45◦) can be found. The geol-ogy of this region is mostly crystalline schist with only minor groundwater capacity in clefts. Soils are predominantly cam-bisols and in some parts leptosols and podsols with low to moderate useable field capacity of ca. 90 mm. Land-cover is dominated by managed coniferous forest and smaller pasture areas used for stock farming. The mean annual precipitation (MAP) amounts to 1300 mm/a and is relativly high for that German region. The estimated mean annual evapotranspira-tion (MAE) is approximately 400 mm/a. These values result in a mean annual runoff generation (MAR) of ca. 900 mm/a, which equals a runoff-precipitation-ratio of 0.69. The low mean annual temperature (MAT) of only 5–6◦C results in a considerable snow cover in winter and snow melt driven high runoff in spring (TLUG 2004). Because of the high runoff generation and the thread of floods originating from this re-gion, a number of water reservoirs has been constructed in the last 80 years, which can be seen in Fig. 1 marked as wa-ter in the legend.
Region II, the Ilm-Saale limestone plateau (Saale-Ilm Muschelkalkplatte), follows in N-E direction. This area is classified by lower elevation (300–600 m a.s.l) and, in com-parison to region I, a smoother relief. Slopes barely exceeds 10◦; however there are a few locations featuring steeper slopes with values up to 30◦. Triassic limestones domi-nate this region, which is characterised by karst phenom-ena. Soils are predominantly cambisols, and in some parts rankers with low to moderate usable field capacity of 80 mm. Land-use is a mixture of forested areas, pastures and mead-ows used partly for stock farming as well as agricultural ar-eas. The MAR is with 800 mm/a ca. 40% lower than in re-gion I, whereas the MAT is higher (7–8◦C), which results also in a higher MAE of ca. 460 mm/a. Because of the lower rainfalls and the higher evapotranspiration, the runoff gener-ation is 65% lower than in region I. The MAR is estimated to be 340 mm/a, which results in a runoff-precipitation-ratio of 0.34. Near the eastern border of the catchment the flood retention reservoir Heyda is located.
Region III, the central Thuringian farmland (In-nerth¨uringer Ackerh¨ugelland), is situated in the N-E of the basin. This region is classified by low elevation between only 200–300 m a.s.l. and a mostly very flat terrain with slopes predominantly lower than 3◦. The geology is formed of sand and silt stones from the Keuper featuring a reasonable loess cover in some areas. The low relief gradient combined with the geological situation results in thick and very fer-tile chernozems and luvisols, which have very high usable field capacity of 220 mm. Because of the good soils, al-most the entire region is used for intensive agriculture. The low elevations leads to a reduction of the MAP which is only 635 mm/a in this region and a slight increase in the MAT of 1◦C. The temperature increase results in a MAE of 540 mm/a. Both, the decrease in rainfall and the increase in temperature, result in the reduction of runoff generation, which is only 90 mm/a in the long term mean and, therefore, to a low runoff-precipitation-ratio of only 0.15.
3 Model description and setup
One of the goals of the project’s first phase was a hydrologi-cal assessment and modelling of the hydrologihydrologi-cal conditions to provide a basis for the coupling of nutrient transport mo-dules. Since the main objective of the project is the devel-opment of a tool-set to assist the scientific sound derivation of management plans for the EU-WFD, the representation of the internal process dynamics and a good reproduction of the runoff generation and lateral runoff transport processes was the main priority.
3.1 The J2000 modelling system
The J2K modelling system (Krause, 2001, 2002) was used for the simulation of the hydrological dynamics of the Gera
catchment. J2K is a modular process oriented hydrological system, which implements single hydrological processes as encapsulated process modules. Beside the process modules for the simulation of the runoff generation and runoff con-centration dynamics J2K offers routines for the regionalisa-tion and correcregionalisa-tion of climate data, the calcularegionalisa-tion of addi-tional input data e.g. solar radiation, potential evapotranspi-ration according to Penman-Monteith or absolute humidity, which are often not available as measured values. In addi-tion, tools for sensitivity and uncertainty analysis as well as plotting capabilities to produce diagrams of the model results are available.
The temporal resolution of J2K is in either daily or hourly time steps. Spatial resolution or catchment distribution is car-ried out by hydrological response units (HRUs) which are connected by a lateral routing scheme to simulate lateral wa-ter transport processes. This allows a fully distributed hy-drological modelling of river basins. The delineation of the response units is described in more detail in Sect. 3.2.
The process implementation for the simulation of the runoff generation is realised in a conceptual way using dif-ferent storages for the single components. The interception module uses a simple storage approach according to Dickin-son (1984), which calculates a maximum interception stor-age capacity based on the leaf area index of the respec-tive land-use. As long as this maximum capacity is not ex-ceeded, precipitation is stored in the actual interception stor-age, which is depleted by evaporation. When the maximum storage capacity is exceeded any surplus of rainfall is treated as throughfall and passed to the next module.
The snow module combines empirical or conceptual ap-proaches with more physically based routines. Mostly, it fol-lows the approach of Knauf (1976), which was enhanced in some parts. The module calculates different state variables of the snow cover such as snow depth, snow density and snow water equivalent, which can be used for process ori-ented multi response validation.
The most complex part of J2K is the soil water balance module, which reflects the central role of the soil zone as a regulation and distribution system, and interacts with nearly all other J2K process modules. The soil zone of each re-sponse unit is subdivided into two storages according to the specific pore volumes of the soil. The middle pore storage (MPS) represents the pores with a diameter of 0.2–50 µm in which water is held against gravity but can be subtracted by an active tension e.g. plant transpiration. Whereas the large pore storage (LPS) represents the large and macro pores (>50 µm), which cannot hold water against gravity. There-fore, LPS is considered as the source of all subsurface flow processes in J2K. Infiltration is estimated by an empirical ap-proach that takes the actual soil moisture into account. Water, which is not able to infiltrate, is up to a certain amount stored at the surface as depression storage, any surplus is treated as surface runoff and routed to the next unit. Infiltration wa-ter is distributed to MPS and LPS dewa-termined by the actual
56 P. Krause et al.: Multiscale investigations in a mesoscale catchment
4 P. Krause et al.: Multiscale Investigations in a Mesoscale Catchment
withered layer on top of the bedrock, which shows a quick hydrological reaction and short residential times. The second storage RG2 represents the saturated groundwater aquifer with longer residential times and a more damped hydrologi-cal reaction. Input as percolation is distributed between the two storages depending on the slope of the response unit.
Runoff concentration and flood routing in the channel net-work, which is simulated as a network of river reaches is considered explicitly by J2K. Lateral flows originating from the runoff generation calculated for each response unit are passed to adjacent units until the receiving unit is connected to a river reach. In this case, the runoff produced by this unit is transferred to the reach segment. Flood routing in the channel network is calculated by a simplified kinematic wave approach, which uses Manning’s formula to calculate flow velocity.
For the calibration of the model all modules contain a number of calibration parameters that have to be adapted based on the comparison with measured stream flow. Over-all, 28 parameters can be calibrated. It has to be noted that all calibration parameters are effective parameters, which have the same value for the entire basin. To limit the degree of freedom, calibration for single response units is not possible. For validation purposes, each module state variable can be read out either as a mean value for the whole catchment or as distributed values in space and time. Different temporal aggregation steps (e.g. daily, monthly, yearly or long term) can be selected for the distributed output.
3.2 Catchment distribution
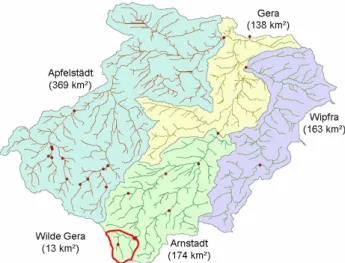
For the hydrological modelling of the runoff dynamics of the Gera basin the catchment was divided into four subbasins shown in figure 2, which are different in size and in terms of environmental, climatological and hydrological conditions. In the upper part of subbasin Arnstadt the small headwater catchment Wilde Gera is located, which is a well investigated and modelled test catchment (e.g. Michl 1999, Krause & Fl¨ugel 2005). Physiographical hydrological response units (HRUs) were delineated in a GIS for each subbasin. The delineation was based on classified topographical parame-ters (elevation, slope, aspect), land-use classes (derived from LANDSAT), soil-types and hydro-geological units (Fl¨ugel 1995, Bongartz 2002, Staudenrausch 2001). For the delin-eation, the single GIS layers are partly reclassified and com-bined by overlay analysis. The resulting polygons are further generalised based on their attribute set and neighbourhood to reduce the overall numbers of spatial model entities.
The delineation of HRUs for the entire Gera catchment resulted in 13 769 entities featuring areas between 0.02 to 2.5 km2. A topological routing scheme was derived in the
GIS for the simulation of lateral runoff generation processes, which determines the HRU polygon connections. Figure 3 shows the HRU polygons of the Wilde Gera catchment to-gether with topological connections as red arrows draped on the underlying elevation.
Fig. 2. The subbasins of the Gera used for the nested catchment modelling approach.
Fig. 3. HRU polygons in the Wilde Gera subbasin with the topolog-ical connections marked as red arrows.
From figure 3 the process oriented character of the HRU distribution concept becomes obvious. The more hydrologi-cal dynamic regions of the catchment (e.g. steep slopes near river reaches) show a high spatial resolution with many small polygons whereas regions with lower dynamics (e.g. higher plateaus in the south) are resolved by a fewer number of larger polygons. This allows an efficient simulation of the catchment’s hydrological dynamics with a minimum amount of redundancy.
3.3 Model parametrisation
The parameters of J2K describing a catchment and its hy-drological response can be divided into two groups: (1) The spatially distributed but temporal static descriptors (= spatial attributes), which describe the spatial heterogeneity and
vari-Fig. 2. The subbasins of the Gera used for the nested catchment modelling approach.
water saturation of MPS. Water stored in MPS is reduced by the plant transpiration determined by the potential ETP and the actual water saturation of MPS. Water in the LPS is dis-tributed into a lateral component (interflow) and a vertical component (percolation) depending on slope. The percola-tion is passed to the groundwater module whereas interflow is routed to the next unit or a connected river reach. When water is left in LPS at the end of the time step, it can be partly used to replenish the MPS.
The groundwater module follows a simple storage con-cept, which implements two groundwater storages for each response unit. The first storage RG1 can be considered as the withered layer on top of the bedrock, which shows a quick hydrological reaction and short residential times. The second storage RG2 represents the saturated groundwater aquifer with longer residential times and a more damped hydrologi-cal reaction. Input as percolation is distributed between the two storages depending on the slope of the response unit.
Runoff concentration and flood routing in the channel net-work, which is simulated as a network of river reaches is considered explicitly by J2K. Lateral flows originating from the runoff generation calculated for each response unit are passed to adjacent units until the receiving unit is connected to a river reach. In this case, the runoff produced by this unit is transferred to the reach segment. Flood routing in the channel network is calculated by a simplified kinematic wave approach, which uses Manning’s formula to calculate flow velocity.
For the calibration of the model all modules contain a number of calibration parameters that have to be adapted based on the comparison with measured stream flow. Over-all, 28 parameters can be calibrated. It has to be noted that all calibration parameters are effective parameters, which have the same value for the entire basin. To limit the degree of
4 P. Krause et al.: Multiscale Investigations in a Mesoscale Catchment
withered layer on top of the bedrock, which shows a quick hydrological reaction and short residential times. The second storage RG2 represents the saturated groundwater aquifer with longer residential times and a more damped hydrologi-cal reaction. Input as percolation is distributed between the two storages depending on the slope of the response unit.
Runoff concentration and flood routing in the channel net-work, which is simulated as a network of river reaches is considered explicitly by J2K. Lateral flows originating from the runoff generation calculated for each response unit are passed to adjacent units until the receiving unit is connected to a river reach. In this case, the runoff produced by this unit is transferred to the reach segment. Flood routing in the channel network is calculated by a simplified kinematic wave approach, which uses Manning’s formula to calculate flow velocity.
For the calibration of the model all modules contain a number of calibration parameters that have to be adapted based on the comparison with measured stream flow. Over-all, 28 parameters can be calibrated. It has to be noted that all calibration parameters are effective parameters, which have the same value for the entire basin. To limit the degree of freedom, calibration for single response units is not possible. For validation purposes, each module state variable can be read out either as a mean value for the whole catchment or as distributed values in space and time. Different temporal aggregation steps (e.g. daily, monthly, yearly or long term) can be selected for the distributed output.
3.2 Catchment distribution
For the hydrological modelling of the runoff dynamics of the Gera basin the catchment was divided into four subbasins shown in figure 2, which are different in size and in terms of environmental, climatological and hydrological conditions. In the upper part of subbasin Arnstadt the small headwater catchment Wilde Gera is located, which is a well investigated and modelled test catchment (e.g. Michl 1999, Krause & Fl¨ugel 2005). Physiographical hydrological response units (HRUs) were delineated in a GIS for each subbasin. The delineation was based on classified topographical parame-ters (elevation, slope, aspect), land-use classes (derived from LANDSAT), soil-types and hydro-geological units (Fl¨ugel 1995, Bongartz 2002, Staudenrausch 2001). For the delin-eation, the single GIS layers are partly reclassified and com-bined by overlay analysis. The resulting polygons are further generalised based on their attribute set and neighbourhood to reduce the overall numbers of spatial model entities.
The delineation of HRUs for the entire Gera catchment resulted in 13 769 entities featuring areas between 0.02 to 2.5 km2. A topological routing scheme was derived in the
GIS for the simulation of lateral runoff generation processes, which determines the HRU polygon connections. Figure 3 shows the HRU polygons of the Wilde Gera catchment to-gether with topological connections as red arrows draped on the underlying elevation.
Fig. 2. The subbasins of the Gera used for the nested catchment
modelling approach.
Fig. 3. HRU polygons in the Wilde Gera subbasin with the
topolog-ical connections marked as red arrows.
From figure 3 the process oriented character of the HRU distribution concept becomes obvious. The more hydrologi-cal dynamic regions of the catchment (e.g. steep slopes near river reaches) show a high spatial resolution with many small polygons whereas regions with lower dynamics (e.g. higher plateaus in the south) are resolved by a fewer number of larger polygons. This allows an efficient simulation of the catchment’s hydrological dynamics with a minimum amount of redundancy.
3.3 Model parametrisation
The parameters of J2K describing a catchment and its hy-drological response can be divided into two groups: (1) The spatially distributed but temporal static descriptors (= spatial attributes), which describe the spatial heterogeneity and
vari-Fig. 3. HRU polygons in the Wilde Gera subbasin with the topolog-ical connections marked as red arrows.
freedom, calibration for single response units is not possible. For validation purposes, each module state variable can be read out either as a mean value for the whole catchment or as distributed values in space and time. Different temporal aggregation steps (e.g. daily, monthly, yearly or long term) can be selected for the distributed output.
3.2 Catchment distribution
For the hydrological modelling of the runoff dynamics of the Gera basin the catchment was divided into four subbasins shown in Fig. 2, which are different in size and in terms of environmental, climatological and hydrological conditions. In the upper part of subbasin Arnstadt the small headwater catchment Wilde Gera is located, which is a well investigated and modelled test catchment (e.g. Michl 1999, Krause and Fl¨ugel 2005).
Physiographical hydrological response units (HRUs) were delineated in a GIS for each subbasin. The delineation was based on classified topographical parameters (elevation, slope, aspect), land-use classes (derived from LANDSAT), soil-types and hydro-geological units (Fl¨ugel, 1995; Bon-gartz, 2002; Staudenrausch, 2001). For the delineation, the single GIS layers are partly reclassified and combined by overlay analysis. The resulting polygons are further gener-alised based on their attribute set and neighbourhood to re-duce the overall numbers of spatial model entities.
The delineation of HRUs for the entire Gera catchment resulted in 13 769 entities featuring areas between 0.02 to 2.5 km2. A topological routing scheme was derived in the GIS for the simulation of lateral runoff generation processes, which determines the HRU polygon connections. Figure 3 shows the HRU polygons of the Wilde Gera catchment
gether with topological connections as red arrows draped on the underlying elevation.
From Fig. 3 the process oriented character of the HRU distribution concept becomes obvious. The more hydrologi-cal dynamic regions of the catchment (e.g. steep slopes near river reaches) show a high spatial resolution with many small polygons whereas regions with lower dynamics (e.g. higher plateaus in the south) are resolved by a fewer number of larger polygons. This allows an efficient simulation of the catchment’s hydrological dynamics with a minimum amount of redundancy.
3.3 Model parametrisation
The parameters of J2K describing a catchment and its hy-drological response can be divided into two groups: (1) The spatially distributed but temporal static descriptors (= spatial attributes), which describe the spatial heterogeneity and vari-ability and (2) the spatial and temporal static calibration pa-rameters used for the adaptation of the model’s response. To limit the degrees of freedom during model calibration, only the second group should be changed to obtain a good mod-elling result, whereas the first group is quantified inside the GIS based on the input data layers.
The spatial attributes of the Gera catchment (coordinates, elevation, slope, aspect, soil type, landuse type, hydroge-ological type) for each HRU were derived and stored in J2K-compliant parameter files. In a second parameter file physical soil parameters (aircapacity, field capacity) are de-fined according to the horizon description of the soil map for each soil type. In a third parameter file, physical vege-tation parameters (LAI, albedo, stomata resistance, effective height, effective rooting depth) were stored for eleven lan-duse classes. Effective parameters describing the groundwa-ter domain (storage capacity and recession coefficients for different aquifers) are contained in a fourth parameter file. The interaction between the parameter files were solved by relation between the soil, landuse and hydrogeological de-scriptors in the HRU parameter file and respective dede-scriptors in the other files. During model initialisation the information is read out of the files and transferred as spatial attributes to the HRU objects of the model.
Climatological time series used as drivers for the model application were available in daily time steps from three synoptical climate stations and 14 precipitation gauges from 1979 to 2000. The climate stations provided measurements of minimum, mean and maximum temperature, wind speed, sunshine hours and relative humidity. This driving data had been checked for data gaps, homogeneity and plausibil-ity and finally transferred to J2K-compliant data files. Ob-served runoff values for model validation were available for 15 runoff gauges (shown in Fig. 1 as red dots).
3.4 Model application
Five models were set up for the simulation, one for each of the subcatchments. Only the time series of the hydrological years 1990 to 2000 was used to avoid data quality problems and possible inhomogeneities related to the reunification of Germany. The entire time series was split up into a cali-bration period (1990–1993) and a validation period (1994– 2000). In scope of the project the following calibration strat-egy was defined:
1. Calibration of the most sensitive parameters for the sub-basin Arnstadt in order to obtain a reasonable fit be-tween observed and predicted runoff (Nash-Sutcliffe ef-ficiency E2≈0.7, logarithmic Nash-Sutcliffe efef-ficiency logE2≈0.6 and a relative volume error rel.VE≈±10% (Krause et al., 2005)).
2. Quantification of model quality during validation pe-riod.
3. Transfer of the whole parameter set to the subbasins Wipfra, Apfelst¨adt and lower Gera together with an identification of the calibration parameters most likely to change due to the change of the hydrological system’s dynamics of the respective subbasins.
4. Recalibration of only those parameters and quantifica-tion of model quality during validaquantifica-tion period.
5. Comparison of modelling results in the Wilde Gera sub-basin obtained from the parameter set of step 1 with ob-served runoff values and modelling results from a de-tailed calibration of the Wilde Gera (Krause and Fl¨ugel, 2005).
The identification of the most sensitive parameters was based on a detailed sensitivity and uncertainty analysis car-ried out for the Wilde Gera basin (B¨ase, 2005). This work demonstrated that 10 of the 28 calibration parameters showed a very sensitive reaction to the Nash-Sutcliffe efficiency and 8 partly different parameters to the log-Nash-Sutcliffe effi-ciency. Only 4 of the parameters were sensitive to the volume error. The threshold for the criteria for a reasonable good fit for step 1 was defined subjectively but care was taken that all three criteria were considered. Hereby, variable hydrologi-cal behaviour (peak flow, mean and low flow, water balance) could be quantified together.
Model quality was quantified by the data from the vali-dation period, which was not used during model calibration. By this split-sample-test (Klemes, 1986) evidence is given that the model’s parameter set is representing the hydrologi-cal process dynamics correct not only during the hydrologi-calibration period but also using independent driving data.
The transfer of the calibrated parameter set should prove that the model’s parameters are valid also for other environ-mental conditions and spatial scales. Since not all of the fea-tures that influence the hydrological dynamics of the three
58 P. Krause et al.: Multiscale investigations in a mesoscale catchment P. Krause et al.: Multiscale Investigations in a Mesoscale Catchment 7
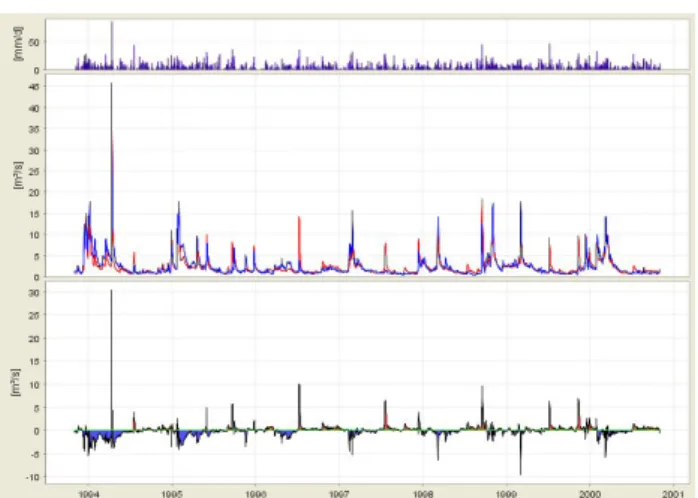
Fig. 4. Simulated (red line) and observed (blue line) runoff in the subbasin Arnstadt in the validation period. The upper panel shows the precipitation input as catchment mean, the lower panel the absolute difference between observation and prediction.
sponse units were delineated to provide a process oriented representation of the catchment’s variability in terms of nat-ural environmental conditions. The single HRU polygons were connected by a topological routing scheme which al-lows the simulation of lateral processes important for the modelling of runoff concentration. The largest advantage of the HRU approach is the process oriented view on a catch-ment’s spatial characteristics which drives the hydrological behaviour. With this distribution concept high resoluted spa-tial information can be obtained and used in heterogeneous regions and less resoluted information in more homogeneous areas which results in a process driven minimal number of spatial entities and smaller models. With a raster based ap-proach the same spatial information density would result in a much larger number of cells. For the Gera model described here a spatial resolution of 25×25 m was used for the delin-eation of the 13 715 HRUs, the same information density in a raster model would have resulted in ca. 1 350 000 grid cells. The largest disadvantage of the HRU approach are the scien-tifically more challenging work steps which needs profound GIS and process knowledge to obtain a good distribution of the catchment. In addition, the determination of the topolog-ical interconnections between the single spatial entities and the river reaches is a time consuming task.
The calibration and application of J2K for the subbasin Arnstadt showed that the model was able to reproduce the hy-drological dynamics with a sufficient degree of quality. The validation using the split sample test (Klemes 1986) proved that the model was able to represent the process interaction and hydrological dynamics also for an independent time se-ries. An interesting fact was that during the validation pe-riod better efficiencies could be acquired than in the calibra-tion period. This fact can be explained by multiple reasons: (1) During the first year of the calibration period the model need to initialise itself to obtain reasonable values for all state variables and is therefore constraint by the uncertain starting conditions. As the validation period follows directly after the calibration period the model’s starting conditions are defined better by the four year model run in advance, which results in better simulation values in particular in the first year of the period. (2) The validation period features higher rain-falls than the calibration period and higher runoffs as a fol-low up. In addition, significantly higher overall variability, which can be expressed by the standard statistical descrip-tors of the runoff values: mean = 1.6 m3/s, s = 1.6, relV
= 97% in the calibration period and mean = 2.4 m3/s, s =
2.6, relV = 110% could be found for the validation period. As shown in Krause et al. (2005) such higher variabilities
Fig. 4. Simulated (red line) and observed (blue line) runoff in the subbasin Arnstadt in the validation period. The upper panel shows the precipitation input as catchment mean, the lower panel the ab-solute difference between observation and prediction.
transfer subbasins are existent in the Arnstadt catchment, a recalibration of selected parameters was necessary. The first parameter included in this selection is responsible for capil-lary rise (capRise from 0.01 to 1.0) from groundwater into the unsaturated soil zone which is most likely to occur in broad riparian areas that can not be found in the Arnstadt basin. Particularly, low flows during the summer period can be reduced by this parameter. The second parameter (LPSout from 4.0 to 5.0) is the drainage factor for LPS and is there-fore responsible for the outflow of mobile water from the soil zone. The adaptation was necessary to account for the lower topographical dynamics of the transfer basins, which is not fully covered by the process equations. For the same reason the third parameter, which controls the flow velocity in the stream channel (TA from 1.0 to 1.5), had to be readjusted to reflect the lower stream flow dynamics in the transfer basins. In general, the adaptation of LPSout and TA resulted in a less dynamic hydrograph behaviour.
4 Results
The calibration of J2K in the subbasin Arnstadt was under-taken for the period of 1989 to 1993 until the visual in-spection of the hydrograph showed a sufficient reproduction of the hydrological dynamics and the three efficiency cri-teria were close to the values described above. The values achieved for the criteria during calibration are shown in the upper part of Table 1. The value of E2 was a little bit lower than the targeted threshold of 0.7 and the volume error was a little bit higher. This was accepted for three reasons: (1) The model needs about one year to initialise its storages which re-sults in a systematic underprediction during that time, (2) the calibration period was known as a relative dry period
com-pared to the validation period and (3) the main goal of the calibration was to achieve a relative good value for all three criteria together.
In the next step the calibrated parameter set was used to simulate the validation period without any changes. The sim-ulated and observed runoff is shown in Fig. 4, the efficiency criteria in the lower part of Table 1. During the validation pe-riod much better values for all three efficiency criteria could be achieved. The visual comparison of the predictions be-tween calibration and validation period shows that J2K per-forms better in the latter one. Beside the good representa-tion of the overall dynamics the plot of Fig. 4 shows some interesting discrepancies between measured and simulated streamflow. In the middle of the hydrological years 1996– 1999 single overpredicted peak flows occur, which are re-lated to high precipitation input in summer.
In summary the reproduction of the hydrological dynamics by the calibrated parameter set was considered good enough to be transferred to the other subbasins.
The calibrated parameter set was then used to model the hydrological dynamics of the other subbasins Apfelst¨adt, Wipfra and Lower Gera. The models were recalibrated slightly as described in Sect. 3.4 to reflect special conditions which are not existent or not of dominant influence in the Arnstadt basin. The resulting efficiency values are shown in Table 1 for the three basins. It is obvious from the table that nearly all values in the transfer basins are lower than those of Arnstadt. In particular the subbasin Wipfra shows not sat-isfactorily efficiencies and high volume error values. Never-theless the hydrological dynamics were captured to a certain degree as the plots of the validation period (Fig. 5) show.
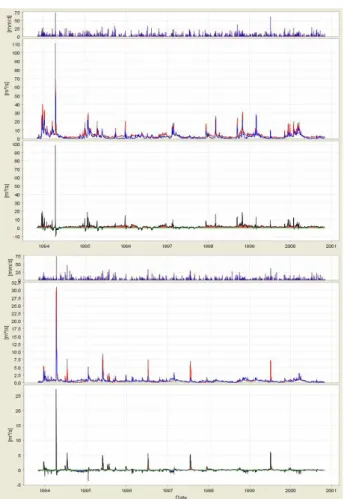
The visual inspection of the simulated and observed hy-drograph of the subbasin Wipfra helps in explaining these values. (1) The overall runoff variability is lower compared to the other basins, which leads in general to lower efficiency measures (Krause et al., 2005). (2) The prediction shows six distinct and sharp peaks which are not existent in the served records. The reason for the missing peaks in the ob-servation is the reservoir Heyda, located in the upper part of the basin, which was constructed in the 80th of last century for flood retention. The runoff despite the peaks was quite well reproduced by J2K.
The hydrograph (Fig. 5) of subbasin Apfelst¨adt which cov-ers all three different regions described in Sect. 2 shows a systematic overprediction during nearly the whole validation period most obvious during low flow conditions and a similar overprediction of peak flows as in the subbasin Wipfra.
The lower Gera subbasin was modelled with the parameter set calibrated for Apfelst¨adt and Wipfra without any further adaptation. Then the observed runoff at the catchment outlet was compared with the superimposed simulated runoff of the subbasins Apfelst¨adt, Wipfra, Arnstadt and lower Gera. The efficiency values for the total catchment are shown in column 4 of Table 1. Here better values could be achieved than in the two subbasins discussed above but slightly worse values than
Table 1. Efficiency measures for calibration and validation period in the different subbasins (E2 = Nash-Sutcliffe, logE2 = Nash-Sutcliffe with logartithmic values, RVE = relative volume error;1Arnstadt parameter set,2specific calibration).
Arnstadt Apfelst¨adt Wipfra Gera Wilde Wilde Gera1 Gera2 Calibration period E2 0.68 0.50 -1.04 0.67 0.69 0.82 logE2 0.62 0.47 -0.37 0.73 0.65 0.82 RVE −12.7% 18.6% 40.5% 10.8% −21.0% 0.43% Validation period E2 0.81 0.61 0.56 0.74 0.81 0.82 logE2 0.78 0.29 −0.03 0.75 0.76 0.72 RVE 4.0% 29.0% −3.8% 9.9% 2.1% 6.95%
those calculated for subbasin Arnstadt. The reason for this can be seen in the facts that the efficiency at the outlet shows some kind of mean value of the values from the respective subbasins. In addition, some of the errors are averaged out by the nesting of the simulations, e.g. the negative volume error of Arnstadt is compensated by the positive volume errors of Wipfra/Apfelst¨adt and vice versa.
Finally the runoff from the subbasin Wilde Gera was ex-tracted from the Arnstadt simulation and compared with the observed runoff at gauge Gehlberg, without any modelling or recalibration. The idea was (1) to find out if the upper part which is very homogeneous in terms of land-use, soils, and geology show significant other efficiency values than at the gauge of the whole subbasin and (2) compare the results with a specifically calibrated J2K model of the Wilde Gera (Krause and Fl¨ugel 2005). The efficiency criteria for the cal-ibration and validation were very similar to those of the Arn-stadt basin, which shows that J2K is able to reproduce the hy-drological dynamics inside the catchment with a comparable quality as for the whole modelled subbasin. The efficiency values of the specific calibrated model were better than those achieved with the Arnstadt calibration (see Table 1).
5 Discussion and Conclusions
The distributed process-oriented hydrological model J2K was applied to a mesoscale catchment in Germany. The whole catchment was split into four subbasins, which were modelled separately. For each subbasin hydrological re-sponse units were delineated to provide a process oriented representation of the catchment’s variability in terms of nat-ural environmental conditions. The single HRU polygons were connected by a topological routing scheme which al-lows the simulation of lateral processes important for the modelling of runoff concentration. The largest advantage of the HRU approach is the process oriented view on a catch-ment’s spatial characteristics which drives the hydrological
8 P. Krause et al.: Multiscale Investigations in a Mesoscale Catchment
Fig. 5. Simulated (red line) and observed (blue line) runoff in the
subbasins Apfelst¨adt (upper part) and Wipfra (lower part) in the val-idation period together with precipitation and differences.
of the observations can produce higher Nash-Sutcliffe effi-ciency values, because the variance of the observation forms the denominator of the equation.
The application of the calibrated parameter set to the re-maining subbasins with only slight adjustments showed that the transfer of a calibrated model to other catchments pro-duces results of similar quality. Even though the efficien-cies went down in the transfer basins the visual inspections of the simulated hydrographs showed a good representation of the hydrological dynamics. The responsible deviations of the simulation from the observation can be explained at least partly by specific natural and management conditions which have influence on the subbasin’s runoff. Here first of all the influence of a couple of reservoirs used for flood retention, power production and drinking water supply in the headwa-ter regions of the basins has to be mentioned. Because J2K does not consider such reservoirs it overpredicts the runoff at certain times. This is most obvious for a couple of runoff peaks in the summer months (figure 4, 5), but probably might also have influence during low flow periods. As a second source for errors karst features in the middle part of the Gera basin can be considered. For this region stream flow losses
are known and mapped but not quantified in terms of volume yet. Nevertheless it can be expected that they have influence on the streamflow in particular during low flow periods. An indication that these reasons are responsible for the simula-tion errors is the good match of comparable flood peaks in the winter periods. Here, because of the higher water avail-ability, the need to hold back water in the reservoirs for power production or drinking water supply is not as urgent as it is in summer and the influence of the streamflow losses in relation to the overall runoff is lower in winter than it is in summer.
Another potential source of error can be seen in the daily time steps of the model. This temporal resolution does not al-low the precise consideration of rainfall events with high in-tensities and short durations, because the model knows only about the entire precipitation volume per day. Therefore runoff peaks resulting from infiltration excess (Hortonian runoff) can not be simulated precisely.
The karst features, the influence of reservoirs as well as the problems with high intensive rainfalls have the most sig-nificant impact during summer. As such features are not con-sidered adequately by the current version of J2K deviations of the simulation from the observation should occur. In addi-tion, the simulation plots (figure 4 and 5) show some system-atic underprediction in the winter and spring months. The underprediction in winter and spring can be directly related to snow melt events. A closer inspection of the difference plots shows that it is more a problem of timing than of vol-ume. This implies the indication, that the modelling of the temporal behaviour of the snow course and in particular the snow melt is responsible for such model errors.
The comparison of the efficiencies obtained with the same parameter set for the much smaller Wilde Gera subbasin showed nearly the same values than those of the whole basin. This is an indication that the process description and distrib-ution concept of J2K is valid for a range of scales. A specif-ically calibrated model for this small headwater catchment did produce slightly better results for E2 both during calibra-tion and validacalibra-tion. The more low flow sensitive efficiency criteria logE2 was better during calibration but higher in the validation period (Krause & Fl¨ugel 2005). Again this is an indication that deviations of the model simulation from the observed time series is more related to the process descrip-tion and rather a problem of scale.
The results of the study presented here can be concluded as follows: The hydrological modelling system J2K was able to reproduce the hydrological dynamics of the Gera basin and its subcatchments with a sufficient quality. Specific de-viations of the simulation results from the observation could be explained and will lead the further development of J2K in the future. The nested calibration approach used for this study showed that it is possible to calibrate J2K for a smaller subbasin and to obtain good simulation results in other sub-basins by the transfer of the entire parameter set combined with a slight adjustment of selected model parameters. This approach has some specific advantages over an parametri-sation and calibration at the catchment outlet only: (1) The runoff at the outlet of larger basins provides an integrative
Fig. 5. Simulated (red line) and observed (blue line) runoff in the subbasins Apfelst¨adt (upper part) and Wipfra (lower part) in the val-idation period together with precipitation and differences.
behaviour. With this distribution concept high resoluted spa-tial information can be obtained and used in heterogeneous regions and less resoluted information in more homogeneous areas which results in a process driven minimal number of
60 P. Krause et al.: Multiscale investigations in a mesoscale catchment spatial entities and smaller models. With a raster based
ap-proach the same spatial information density would result in a much larger number of cells. For the Gera model described here a spatial resolution of 25×25 m was used for the delin-eation of the 13 715 HRUs, the same information density in a raster model would have resulted in ca. 1 350 000 grid cells. The largest disadvantage of the HRU approach are the scien-tifically more challenging work steps which needs profound GIS and process knowledge to obtain a good distribution of the catchment. In addition, the determination of the topolog-ical interconnections between the single spatial entities and the river reaches is a time consuming task.
The calibration and application of J2K for the subbasin Arnstadt showed that the model was able to reproduce the hy-drological dynamics with a sufficient degree of quality. The validation using the split sample test (Klemes, 1986) proved that the model was able to represent the process interaction and hydrological dynamics also for an independent time se-ries. An interesting fact was that during the validation pe-riod better efficiencies could be acquired than in the calibra-tion period. This fact can be explained by multiple reasons: (1) During the first year of the calibration period the model need to initialise itself to obtain reasonable values for all state variables and is therefore constraint by the uncertain starting conditions. As the validation period follows directly after the calibration period the model’s starting conditions are defined better by the four year model run in advance, which results in better simulation values in particular in the first year of the period. (2) The validation period features higher rain-falls than the calibration period and higher runoffs as a follow up. In addition, significantly higher overall variability, which can be expressed by the standard statistical descriptors of the runoff values: mean=1.6 m3/s, s=1.6, relV=97% in the cali-bration period and mean=2.4 m3/s, s=2.6, relV=110% could be found for the validation period. As shown in Krause et al. (2005) such higher variabilities of the observations can produce higher Nash-Sutcliffe efficiency values, because the variance of the observation forms the denominator of the equation.
The application of the calibrated parameter set to the re-maining subbasins with only slight adjustments showed that the transfer of a calibrated model to other catchments pro-duces results of similar quality. Even though the efficien-cies went down in the transfer basins the visual inspections of the simulated hydrographs showed a good representation of the hydrological dynamics. The responsible deviations of the simulation from the observation can be explained at least partly by specific natural and management conditions which have influence on the subbasin’s runoff. Here first of all the influence of a couple of reservoirs used for flood retention, power production and drinking water supply in the headwa-ter regions of the basins has to be mentioned. Because J2K does not consider such reservoirs it overpredicts the runoff at certain times. This is most obvious for a couple of runoff peaks in the summer months (Figs. 4 and 5), but probably
might also have influence during low flow periods. As a sec-ond source for errors karst features in the middle part of the Gera basin can be considered. For this region stream flow losses are known and mapped but not quantified in terms of volume yet. Nevertheless it can be expected that they have influence on the streamflow in particular during low flow pe-riods. An indication that these reasons are responsible for the simulation errors is the good match of comparable flood peaks in the winter periods. Here, because of the higher wa-ter availability, the need to hold back wawa-ter in the reservoirs for power production or drinking water supply is not as ur-gent as it is in summer and the influence of the streamflow losses in relation to the overall runoff is lower in winter than it is in summer.
Another potential source of error can be seen in the daily time steps of the model. This temporal resolution does not allow the precise consideration of rainfall events with high intensities and short durations, because the model knows only about the entire precipitation volume per day. There-fore runoff peaks resulting from infiltration excess (Horto-nian runoff) can not be simulated precisely.
The karst features, the influence of reservoirs as well as the problems with high intensive rainfalls have the most sig-nificant impact during summer. As such features are not con-sidered adequately by the current version of J2K deviations of the simulation from the observation should occur. In addi-tion, the simulation plots (Fig. 4 and 5) show some system-atic underprediction in the winter and spring months. The underprediction in winter and spring can be directly related to snow melt events. A closer inspection of the difference plots shows that it is more a problem of timing than of vol-ume. This implies the indication, that the modelling of the temporal behaviour of the snow course and in particular the snow melt is responsible for such model errors.
The comparison of the efficiencies obtained with the same parameter set for the much smaller Wilde Gera subbasin showed nearly the same values than those of the whole basin. This is an indication that the process description and distribu-tion concept of J2K is valid for a range of scales. A specif-ically calibrated model for this small headwater catchment did produce slightly better results for E2 both during calibra-tion and validacalibra-tion. The more low flow sensitive efficiency criteria logE2 was better during calibration but higher in the validation period (Krause and Fl¨ugel 2005). Again this is an indication that deviations of the model simulation from the observed time series is more related to the process descrip-tion and rather a problem of scale.
The results of the study presented here can be concluded as follows: The hydrological modelling system J2K was able to reproduce the hydrological dynamics of the Gera basin and its subcatchments with a sufficient quality. Specific de-viations of the simulation results from the observation could be explained and will lead the further development of J2K in the future. The nested calibration approach used for this study showed that it is possible to calibrate J2K for a smaller
subbasin and to obtain good simulation results in other sub-basins by the transfer of the entire parameter set combined with a slight adjustment of selected model parameters. This approach has some specific advantages over an parametri-sation and calibration at the catchment outlet only: (1) The runoff at the outlet of larger basins provides an integrative signal which represents the average hydrological dynamics. Hereby specific processes taking place only in some regions of the basin can no longer be identified, because they have no dominant influence on the total runoff. The implication in terms of model calibration are that the values of single pa-rameters which control such processes cannot be identified precisely by the comparison between simulation and obser-vation because they do not show a sensitive reaction. (2) The application of the same model in different subbasins can help in the identification of structural model problems and in tracing the responsible process implementations. In addition dependencies of single parameter values or process imple-mentations from scale or specific conditions in term of envi-ronmental configuration as well as human management can be identified better.
In general, it is more likely that parameter sets obtained with the nested catchment approach for larger basins are re-sulting in a better spatial representation of the runoff gener-ation and concentrgener-ation processes than a calibrgener-ation on the catchment outlet only.
Acknowledgements. The authors thank the Th¨uringer Landesanstalt
f¨ur Umwelt und Geologie for funding, Cornelia Barth (DRI, Reno, Nevada) for manuscript revision, R. R¨odel and J. Wolf for their kind reviews, and the conveners of the workshop for the excellent organisation.
Edited by: R. Barthel, J. G¨otzinger, G. Hartmann, J. Jagelke, V. Rojanschi, and J. Wolf
Reviewed by: anonymous referees
References
Arnold, J. R. and Fohrer, N.: SWAT2000: current capabilities and research opportunities in applied watershed modelling, Hydrol. Processes, 19, 563–572, 2005.
B¨ase, F.: Beurteilung der Parametersensitvit¨at und der Vorher-sagesicherheit am Beispiel des hydrologischen Modells J2000; Master-Thesis at the Department of Geoinformatics, Friedrich-Schiller-University Jena, http://www.geogr.uni-jena.de, 2005. Bongartz, K.: Untersuchung unterschiedlicher
Fl¨achendiskretisie-rungs- und Modellierungskonzepte f¨ur die hydrologische Model-lierung am Beispiel Th¨uringer Vorfluter, Dissertation, Friedrich-Schiller Universit¨at Jena, 2002.
Dickinson, R. E.: Modelling evapotranspiration for three-dimensional global climate models; in: Climate Processes and Climate Sensitivity, edited by: Hansen, J. E. and Takahashi, T., Geophys. Monograph. Ser., 29, Washington, 1984.
Fl¨ugel, W.-A.: Delineating Hydrological Response Units by Geo-graphical Information System Analyses for Regional Hydrolog-ical Modelling using PRMS/MMS in the Drainage Basin of the River Br¨ol, Germany, Hydrol. Processes, 9(3/4), 423–436, 1995. Klemes, V.: Operational testing of hydrological simulation models,
Hydrol. Sci. J., 31, 1, 13–24, 1986/
Knauf, D.: Die Abflubildung in schneebedeckten Einzugsgebieten des Mittelgebirges, Technischer Bericht Nr. 17, Institut f¨ur Hy-draulik und Hydrologie, TH Darmstadt, 1976.
Krause, P.: Das hydrologische Modellsystem J2000 – Beschrei-bung und Anwendung in groen Flugebieten, Schriften des Forschungszentrums J¨ulich, Reihe Umwelt/Environment, Band 29, 2001.
Krause, P.: Quantifying the impact of land use changes on the water balance of large catchments using the J2000 model, Phys. Chem. Earth, 27, 663–667, 2002.
Krause, P., Boyle, D., and B¨ase, F.: Comparison of different effi-ciency criteria for hydrological model assessment, Adv. Geosci., 5, 89–97, 2005,
http://www.adv-geosci.net/5/89/2005/.
Krause, P. and Fl¨ugel, W.-A.: Integrated research on the hydrolog-ical process dynamics from the Wilde Gera catchment in Ger-many, Headwater Control VI: Hydrology, Ecology and Water Resources in Headwaters, IAHS Conference, Bergen 2005. Michl, Ch.: Prozessorientierte Modellierung des Wasserhaushaltes
zweier Quelleinzugsgebiete im Th¨uringer Wald, Dissertation, Friedrich-Schiller Universit¨at, Jena, 1999.
Staudenrausch, H.: Untersuchungen zur hydrologischen Topolo-gie von Landschaftsobjekten f¨ur die distributive Flussgebi-etsmodellierung, Digitale Bibliothek Th¨uringen, http://www. db-thueringen.de, 2001.
![[PDF] Cours de Haskell en pdf | Formation informatique](data:image/gif;base64,R0lGODlhAQABAIAAAP///wAAACH5BAEAAAAALAAAAAABAAEAAAICRAEAOw==)