DESIGN OF A TENSION ROOF STRUCTURE FOR THE
ROCKWELL CAGE
BY
DANIEL W. EGGERS
BACHELOR OF SCIENCE IN STRUCTURAL ENGINEERING/ARCHITECTURE
JUNE 1997
Princeton University
SUBMITTED TO THE DEPARTMENT OF CIVIL AND ENVIRONMENTAL ENGINEERING IN PARTIAL FULFILLMENT OF THE REQUIREMENTS FOR THE DEGREE OF
MASTER OF ENGINEERING IN CIVIL AND ENVIRONMENTAL ENGINEERING AT THE
MASSACHUSETTS INSTITUTE OF TECHNOLOGY
JUNE 2000
Copyright @ 2000 Massachusetts Institute of Technology
All Rights Reserved
SIGNATURE OF AUTHOR
DANIELENEGGERS
MAY 15, 2000
CERTIFIED BY
JEROME J. CONNOR
PROFESSOR, DEPARTMENT OF CIVIL AND ENVIRONMENTAL ENGINEERING
"-7 THESIS SUPERVISOR
APPROVED BY
DANIELE VENEZIANO CHAIRMAN, DEPARTMENTAL COMMITTEE ON GRADUATE STUDIES
A USETS INSTITUTE
DESIGN OF A TENSION ROOF STRUCTURE FOR THE
ROCKWELL CAGE
BY
DANIEL W. EGGERS
Submitted to the Department of Civil and Environmental Engineering on
May 5, 2000
in Partial Fulfillment of the Requirements For the Degree of Master of Engineering in Civil and Environmental Engineering
ABSTRACT
The Rockwell Cage presents an ideal opportunity for application of a cable net
structure. This study examines tensile structures and means of designing and determining
their behavior. Hand calculations are derived and used to determine a first run
approximation of structural response. In search of more accurate results, commercially available non-linear software was used unsuccessfully. Therefore, an exact non-linear matrix analysis was used to solve the system and examine the parameters which affect the structure.
The analysis revealed that the hand calculations provide an adequate first-approximation, but are unreliable in terms of stiffness. The non-linear matrix model
provides greater accuracy over a wide range of parameters. Furthermore, the non-linear
matrix model provides significantly more flexibility in terms of various loading patterns,
structural forms, and the ability to easily examine parameters. The working program is
explained and included in this thesis.
THESIS SUPERVISOR: JEROME J. CONNOR
PROFESSOR OF CIVIL AND ENVIRONMENTAL ENGINEERING TITLE:
ACKNOWLEDGEMENTS
I would like to thank Professor Connor for all of his help and guidance throughout
the year, and especially on this thesis. His patience and suggestions allowed this thesis to exist. I would also like to thank the entire MIT High Performance Structures Program of
2000. Their humor and wisdom made this past year enjoyable and enlightening.
To my family and friends: Thank you for your support this year and always. Thank you Erin for all the love, support, help, and patience you have shown during the
TABLE OF CONTENTS
1 INTRODUCTION ...-- 6
1.1 THE ROCKWELL CAGE ... 7
2 INTRODUCTION TO CABLE STRUCTURES ... 9
2.1 CABLE BEHAVIOR ... 14
3 CONSTRUCTION OF A CABLE NET ... 19
3.1 CABLE PROPERTIES... 19
3.2 CONNECTION DETAILS ... 20
3.3 ERECTION SEQUENCE... 23
4 APPROXIMATE CALCULATION OF A CABLE NET ... 24
4.1 GENERAL ... 24
4.2 ASSUMPTIONS ... 25
4.3 DERIVATION OF APPROXIMATE CALCULATION... 26
4.4 RESULTS FROM INFINITELY RIGID COMPRESSION RING CALCULATIONS ... 30
4.5 APPLICATION TO THE ROCKWELL CAGE ... 30
4.6 INTRODUCTION OF THE FLEXIBLE COMPRESSION RING...35
5 COM PUTER ANALYSIS ... 40
5.1 SAP 2000 ... 40
5.2 ANALYSIS USING EASY ... 40
6 NON-LINEAR M ATRIX ANALYSIS... 43
6.1 CREATION OF THE COMPUTER PROGRAM ... 45
6.2 SOLUTION OF THE FLAT CABLE... 46
6.3 Tw o OPPOSING CURVATURE CABLES... 50
6.4 CABLE NET ... 51
7 CONCLUSION...56
BIBLIOGRAPHY ... 57
APPENDIX A : SYM BOLS USED ... 58
APPENDIX B : DESIGN LOADS ... 60
APPENDIX C: COM PUTER PROGRAM ... 61
APPENDIX E: DATA FILES ... 65
APPENDIX F: APPROXIMATE CALCULATIONS, RIGID EDGE RING ... 67
TABLE OF FIGURES
FIGURE 1: THE ROCKWELL CAGE, PLAN VIEW (M IT)... 7
FIGURE 2: SUSPENDED ROOF STRUCTURE (BUCHHOLDT PG. 3)... 9
FIGURE 3: CABLE BEAM S (BUCHHOLDT, PG. 5). ... 10
FIGURE 4: A HYPERBOLIC PARABOLOID. ... 11
FIGURE 5: THREE CABLE NET STRUCTRES (BUCHHOLDT PG. 10). ... 12
FIGURE 6: T HE H ONG K ONG A VIARY ... 13
FIGURE 7: DEFLECTION OF A CABLE DUE TO A POINT LOAD... 15
FIGURE 8: DEFLECTION OF A CABLE DUE TO A UNIFORM LOAD... 16
FIGURE 9: DISPLACEMENT OF A SUPPORT OF A SIMPLE CABLE... 17
FIGURE 10: SINGLE CABLE CONNECTION USING U-BOLT (BUCHHOLDT PG. 271)... 20
FIGURE 11: SINGLE CABLE CONNECTION UING DOUBLE U-BOLT (BUCHHOLDT PG. 271)... 20
FIGURE 12: CONNECTION FOR DOUBLE CABLE CONFIGURATION (BUCHHOLDT PG. 271). ... 21
FIGURE 13: END CONNECTION DETAIL (BUCHHOLDT PG. 157). ... 21
FIGURE 14: CONNECTIONS AT THE HONG KONG AVIARY... 22
FIGURE 15: PLAN VIEW OF STRUCTURE TO BE CALCULATED... 25
FIGURE 16: RESULTS FROM APPROXIMATE CALCULATIONS OF CABLE NET ON RIGID RING WITH VARYING L O A D . ... 3 1 FIGURE 17: EFFECT OF AY ON DEFLECTION FOR THE APPROXIMATE CALCULATION OF THE CABLE NET WITH A R IG ID E D G E . ... 3 2 FIGURE 18: EFFECT OF AX ON DEFLECTION FOR THE APPROXIMATE CALCULATION OF THE CABLE NET WITH A R E G ID E D G E . ... 3 3 FIGURE 19: EFFECT OF FX ON THE APPROXIMATE CALCULATION OF A CABLE NET WITH A RIGID EDGE. ... 34
FIGURE 20: FORCES CAUSING PURE COMPRESSION (LEFT) AND PURE BENDING (RIGHT) IN A RING. ... 35
FIGURE 21: RESULTS FOR SZABO'S CACLULATION ON ROCKWELL CAGE ... 37
FIGURE 22 RESULTS USING MODIFIED ANALYSIS FOR MASSACHUSSETS STATE CODE ... 38
FIGURE 23: CHANGE IN DEFLECTION WITH RESPECT TO JR ... 39
FIGURE 24: RANDOM BEAM NET FORMATION USING EASY... 41
FIGURE 25: EASY MESH GENERAION FOR SIMPLE MODEL OF ROCKWELL CAGE ... 42
FIGURE 26: FLOW OF THE COMPUTER PROGRAM . ... 46
FIGURE 27: FLAT CABLE SUBJECTED TO A VARYING POINT LOAD. ... 48
FIGURE 28: CABLE SUBJECTED TO A POINT LOAD WITH VARYING PRETENSION FORCE. ... 48
FIGURE 29: DEFLECTION OF A CABLE SUBJECT TO POINT LOAD WITH VARYING CABLE AREA... 49
FIGURE 30: CABLE SUBJECTED TO POINT LOAD WITH A VARYING INITIAL SAG... 50
FIGURE 31: DISPLACEMENT OF A TWO CABLE SYSTEM. ... 51
FIGURE 32: DEFLECTION DUE TO PRETENSION FORCE ALONE. ... 53
FIGURE 33: DEFLECTION OF CABLE NET WITH VARYING HORIZONTAL PRETENSION. ... 54
1 INTRODUCTION
"Experience has shown that, although in most cases the basic concept is simple, lack of acquaintance with cable structures and their behavior can lead to an unnecessary waste of time and consequently high design costs (Buchholdt)."
Cable net structures use the most efficient form of load transmission, tension,
which avoids concerns of buckling. Furthermore these structures can be architecturally
and structurally pleasing. Despite their advantages, tension structures are not frequently
seen in the built environment. Their under-utilization is generally attributed to a lack of
guidance in building codes, lack of information, and a shortage of trained designers and
contractors familiar with this type of structure.
Cable net structures are difficult to design because they behave non-linearly.
Furthermore, the stiffness and strength of these structures depends on numerous
parameters including: cable type, cable size, pretension levels, and support stiffness. The
purpose of this thesis is to examine cable net structures with an emphasis on design. The
intent of this thesis is to increase the designer's awareness, acquaintance and knowledge
of tensile structures. The Rockwell Cage at MIT serves as the design basis for examining
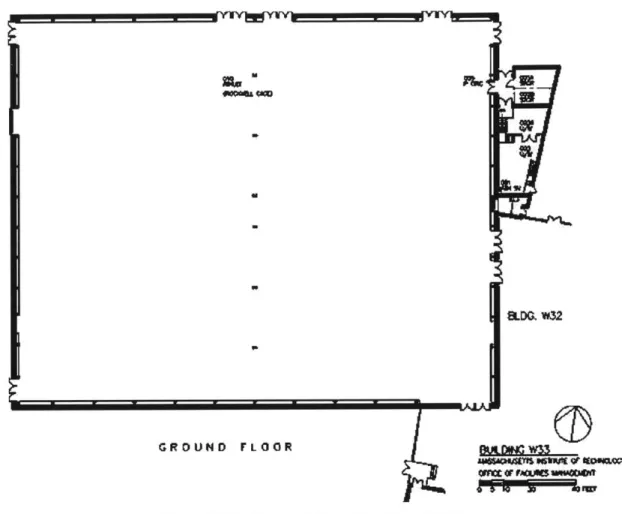
1.1 THE ROCKWELL CAGE
GRouIID FLOOR 8_______
Figure 1: The Rockwell Cage, Plan View (MIT)
The Rockwell Cage at the Massachusetts Institute of Technology was formerly a
hanger for lightweight aircraft. It was constructed in 1948 using post World War II
military surplus timber for a double barrel vaulted roof supported by wood roof trusses.
The structure was later modified to meet MIT's athletic needs. The building measures
196 feet by 156 feet (approximately 48 meters by 30 meters) with W18 steel columns 36'
high spaced at 16'-4" on center. The walls are CMU from the ground level to 12' and the
remainder is a clear glass window. The lateral load of the structure is resisted by steel
single angle cross-bracing. The roof vaults span 98 feet dividing the longer dimension in
steel trusses supported by steel columns at the center and each end of the building. The
space is used for basketball, volleyball and other court activities.
The Rockwell Cage is far from an ideal athletic facility. The half of the wall that
is constructed of window panels is subsequently covered by thick curtains. This has been
done to block the sun glare as well as to insulate the building. The floor of the Rockwell
Cage is undergoing differential settlement at the walls which is damaging the floor
surface. Finally, the row of the columns in the center of the building limits the flexibility
of the space.
Alterations to the Rockwell Cage have been suggested in the past. MIT's
Materials and Construction 4.405 studied possible steel and concrete architectural
alternatives for the Rockwell Cage in the Fall of 1999. In fact, MIT plans to construct
two new athletic facilities, the second of these involves the demolition and replacement
of the Rockwell Cage. The new building will be placed on the site of the old and will
contain basketball courts, racquetball courts and a multipurpose room (Blau 1996).
This thesis uses Rockwell Cage as a framework for studying the design of a
tension net structure. The building function lends itself well to a long-span structure.
MIT's campus is an ideal location for an unusual structural type, especially in the
location of the Rockwell Cage, surrounded, as it is, by a concrete shell and a pneumatic
2 INTRODUCTION TO CABLE STRUCTURES
Cable structures carry load in the most efficient form possible, tension. Tension
members carry the load axially and do not require bracing for buckling. However, they
can be costly to construct due to complicated erection and connection procedures. As a
result, they are not cost effective structures for spans of less than 30 meters but are highly
economical for spans over 100 meters (Buchholdt).
The simplest method of supporting a roof by means of a cable is to attach the
roofing material to a series of cables (Figure 2). These cables are draped in a fashion
capable of carrying the load. This system has no inherent stiffness and will move
significantly under live loads. The greatest threat to the suspended roof is uplift forces.
If the uplift force becomes large enough to equal the dead load of the roof, the roof will
have no stiffness. Any increase in uplift forces would then cause a drastic deflection.
This situation may be avoided by using a heavy cladding material such as concrete slabs
to increase the dead load. Stiffness may also be added to the structure by using the
concrete as a rigid shell-like membrane.
An alternate method of ensuring that the suspension cables remain in tension is to
install a pretension cable having an opposite curvature to that of the suspension cable.
This second cable pulls downwards on the suspension cable with a force sufficient to
force the suspension cable into tension under all loading conditions. Loads placed on the
structure cause an increased tension in the suspension cable and a decreased tension in
the pretension cable. The opposite is true under uplift conditions. This arrangement is
called a cable beam (Figure 3).
(a) Convex cable beam
(b) Concave cable beam
(c) Convex-concave cable beam
Figure 3: Cable beams (Buchholdt, pg. 5).
This system is stable as long as the load does not cause a cable to lose all tension.
relatively flat, resulting in a low stiffness. A structure with the suspension and pretension
cables having opposite, constant curvatures will avoid this phenomenon.
Slightly more complex than the cable beam is the cable net. A cable net is a
system of cables which forms a single surface. The suspension and pretension cables are
arranged perpendicularly in plan, forming a single three-dimensional surface. Cable nets
can be made in various forms. To achieve the criteria of opposite, constant curvature as
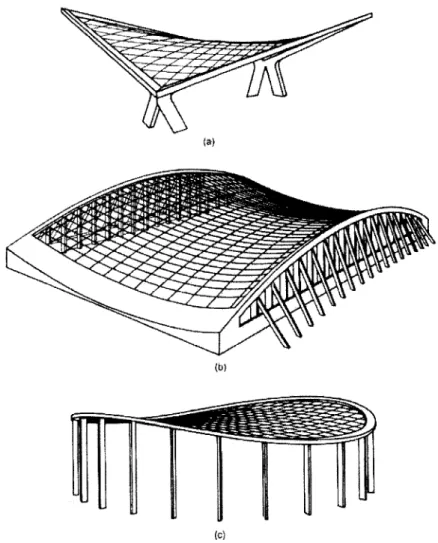
well as reasonable drainage, a hyperbolic paraboloid form is required (Figure 4). This
same form can be used with various boundaries and cuts to create a number of different
forms (Figure 5).
(a)
(b)
(c)
Figure 5: Three cable net structres (Buchholdt pg. 10).
An even greater variety of structural forms are available than are explained by the
hyperbolic paraboloid. These can be achieved by the use of compression elements such
as masts and arches. A circus tent is an example of such a form. Another example is the
Hong Kong Aviary, which uses three compression arches to support a cable net (Figure
Figure 6: The Hong Kong Aviary
For the calculations in section 4, the elliptical edge ring, similar to that shown in
Figure 5c, was chosen. The primary advantage of the edge ring is the ability to resist the
tension in the cables in the ring without ground anchors. The disadvantage may be that it
would not fit a rectangular building plan. However such a ring could still be supported
2.1 CABLE BEHAVIOR
Cables have the unique property of being able to carry load in tension only. They
do not allow for compression or shear loading. Therefore, a cable under a particular
loading must assume a shape such that all of the load is carried in tension. The load
which defines this initial shape of the cable is called the funicular load, and the shape is
called the funicular curve. Changes in the magnitude of the funicular load do not alter
the deformed shape, just the magnitude of the sag.
Application of a non-funicular load requires the cable to alter its deformed shape
to satisfy the zero moment and shear requirement. This change in shape requires a large
deformation relative to that required by other types of load carrying members. The
change in geometry of the cable allows it to carry the load. Such deflections constitute a
second order effect. The system is nonlinear, and superposition of loads is not accurate as
RESPONSE TO A POINT LOAD
A point load is perhaps the simplest load case for a cable.
HeP 1
fI
L
P1I P2
Ho + AH'' - - ...- - -~f
L
Figure 7: Deflection of a cable due to a point load.
Assuming cable under point load Pi in the center of the span as shown in Figure
7, the horizontal force required is:
PFL 0 4f
'
With the addition of a second point load, P2, the cable will elongate, resulting in a
slightly different geometry and set of equations.
H0 +AH = (P1+P2) L
0 4(f +Af)
or
(Hof + AHAf)+ (Hof + AHAf) - (P P+ P2) L4
(2.)
(3.)
I
I
As the above equations show, the response to a second load involves two
unknown quantities: the change in sag, and the change in horizontal force in the cable.
These quantities are multiplied together in the solution, resulting in a highly non-linear
solution.
UNIFORM LOAD
1-1Q + AQ
L
Figure 8: Deflection of a cable due to a uniform load.
Another simple loading paradigm is that of a uniform load applied to a cable. In
this instance, the uniform load
Q,
is applied to the horizontal projection of the cable and not to the cable itself, as is the case for hung loads and live loads. The resultanthorizontal force is:
H -QL (4.)
8f
The addition of another load, AQ, results in:
H +AH = (Q + AQ)L2 (5.)
8(f +Af)
and therefore support motion must be examined. To examine the effect on a simple
cable, a cable with a uniform load q is examined by moving one support a distance AL.
Figure 9: Displacement of a support of a simple cable.
The arc-length of a flat cable is approximately: (Szabo)
8 P s =L(1+- )
3 L2 (6.)
The change in support position, AL, causes a corresponding vertical displacement
Af. Using an inextensible cable the arch length will remain constant:
as Af +as AL = 0 (7.)
af aL
By substituting equation 7 into equation 8,
16fAf +(1 8 f2)AL =0 (8.)
3 L 3 L 2
Assuming that f2/L 2«,
Af 3 L (9.)
16 f
Therefore, for cables with a low sag ratio (f/L), the increase in sag will be very
the vertical displacement at the center of the span is approximately two times that of the
3 CONSTRUCTION OF A CABLE NET
Construction of a cable net is inherently different from construction of most
structural systems. A cable net is pretensioned and alters its shape significantly under
loading. Furthermore, cables cannot be welded or bolted as other materials often are.
These properties create two major obstacles, construction sequence and connection
details, which are often unfamiliar to the standard-building designer.
3.1 CABLE PROPERTIES
Structural cables are manufactured in several forms including spiral strand and
locked coil. Each form is a result of a different method of grouping wire strands which
endows the final cable with different properties. Wire strands are made from very high
strength steel with a Young's modulus of approximately 190 kN/mm2(Buchholdt). The
alternative methods for wrapping wires allow for some modification of density, breaking
strength, flexibility and resistance to deterioration.
For this project, spiral strand cables were assumed. These cables have a resulting
modulus of approximately 170 kN/mm2 for cables under 50 mm diameter and a tensile
2
strength of 1.5 kN/mm . The values for breaking strength are not directly related to the
cross sectional area of the cable by a fixed tensile strength as the strand arrangement
varies slightly for every cable. For simplicity, the rough tensile strength will be used for
3.2 CONNECTION DETAILS
Cable nets are constructed with either a single or double cable system. In the
former, the cables are connected by a U-bolt and a spacer, as shown in Figure 10.
Alternatively, a double U-bolt system may be used as shown in Figure 11.
Figure 10: Single cable connection using U-bolt (Buchholdt pg. 271).
Figure 11: Single cable connection uing double U-bolt (Buchholdt pg. 271).
As cables become larger due to increased spans and loads, it may be desirable to
use a double cable as opposed to a single cable. This results in the cable connections
Figure 12: Connection for double cable configuration (Buchholdt pg. 271).
End sockets are usually designed such that they develop the full breaking load of
the cable (Buchholdt). The end connections require the ability to be adjusted. This
ability will be important primarily during the erection of the cables. Furthermore, during
the life of the structure, the cables will have the tendency to creep and may require
readjustment. A popular end detail is the bridge socket pictured in Figure 13. This detail
is adjustable and allows for end rotation to avoid localized bending and fatigue effects.
(0)
Details similar to those described above were used on the Hong Kong Aviary.
This aviary is constructed as an arch supported cable net. The net uses a dual-strand
system to support a wire mesh cage roofing material.
3.3 ERECTION SEQUENCE
The cables will elongate under any load, including the pretension load. Therefore
it is important to carefully plan an erection sequence for a cable net. There are two basic
methods for assembling a cable net. The net may be assembled on the ground and then
lifted into place, or may be assembled in the air. For either method, a great deal of
planning is required to insure that the process will proceed smoothly (Buchholdt).
Prior to erection, the cables must be linearized. Structural cables exhibit a
non-linearity in their response to axial loading. Initially, the cables deflect significantly and
do not return to the initial state upon unloading. This response is primarily due to the
compacting of the strands within the cables as the strands shift. The resulting elongation
is between 0.25 and 1% of the cable length and cannot be theoretically determined
(Buchholdt). Therefore, it is necessary to prestress the cables prior to erection.
In the factory, the cables are subjected to the required load, which elongates them.
The cables are then marked for length and shipped to the site. As the cables are placed
and prestressed, they elongate back to the prestressed length measured at the factory. By
4 APPROXIMATE CALCULATION OF A CABLE NET
The following describes a set of simplified calculations for a cable net roof. For this section, a procedure established by Szabo and Kollar was used. The calculations are approximate, and require numerous assumptions. The calculations by Szabo and Kollar were difficult to follow and contained a number of errors. Relevant formulas have been derived and several errors corrected for this chapter. A numerical example of this calculation is found in Appendix F.
4.1 GENERAL
The Szabo and Kollar equations are intended to be approximate calculations for a
cable net on a compression ring. The compression ring is assumed to be elliptical. The compression ring is not a flat ring, but curves vertically as well to conform to the hyperbolic paraboloid shape of the cable net structure (Figure 5c).
The plan view of the system is shown in Figure 15. The important dimensions are
the length and sag in the x and y directions. The cables which run in the y direction are
Figure 15: Plan view of structure to be calculated.
4.2 ASSUMPTIONS
To approximate the cable net, several assumptions were required:
" Only the central band of cables was examined in each direction. It is assumed that
all cables parallel to each cable band exhibit similar forces and displacements.
- The net is considered to be flat. This assumption ensures that deflections in the x and y directions are zero. Furthermore, it simplifies calculations since z'2
~ 0.
- Loads are considered to be uniform and vertical only.
- Response of the cable net is considered to be linear. The principle of superposition
will therefore be used. This assumption has been found to be approximately true for uniform loading in other literature (Buchholdt 1999).
4.3 DERIVATION OF APPROXIMATE CALCULATION
The first step in this derivation is to separate the cable forces. The load is
separated to establish the proportion of the vertical load to be carried by the pretension or
suspension cable given each cable's stiffness characteristics.
qx + qy = Qtotal (10.)
Where qx and qy represent portions of the load in the pretension and suspension
cables. From equation 5:
Hof+AHf+HoAf+AHAf= (q0 +Aq)L
2
8
A change in tensile force on the cable:
As =AH, as
ax
Results in an elongation of the cable:
Aas, AH as' as
EA ax
With:
(as) 2 = (ax)2 +( )2(ax)2 ax
And therefore, combining equations 13 and 14:
AH (ax2 +z,2 aX2 ) AH (ax + z,2 a X Aas - EA ax EA (12.) (13.) (14.) (15.)
(17.)
(as,) 2 + as, Aas, + (Aas.,)2 = (z'ax)2 + 2z'w'(ax) 2 + (w'ax)2
+ (ax) 2
Subtracting equation 14 from this result:
2asAas, +(Aas,) 2
= 2z'w'(ax)2 +(w'ax) 2 Since, Aas, <<
asx:
2asAasx = 2z'w'(ax)2 +(w'ax) 2
Aasx = z'W'( ax )ax+ -ax
as, 2 as,
Therefore, integrating and combining equations 15 and 20:
AH EA Lx I ' 2 , f Aas, - f (1 + Z'2 )ax =
--
3-x +f
-J 3 x EA o 0 V1+ Z'2 2 o _,1I+ Z'2 (18.) (19.) (20.) (21.)And using the standard parabolic shape of a cable:
Z = --f(lx-x 2 ) (22
1 2
And deflection of this cable:
w= 2k (lx-x
2
) (23
Where Wk is the increase in the cable sag. The flat cable approximation leads to:
1+z 2
~1 (24
The substitution of equations 22, 23 and 24 in equation 21 results in:
(2 AMi 16 fWk + 8wk (25 EA 3 1 31 .) .) .) .)
AH Aq
8f
The change in sag of the cable is:
Wk~All3 12 Wk =AH32f fEA 3 14 (26.) (27.) Aq12 8f W k = Aq -128 f2 EA
Setting the deflections of cables in x and y directions equal to each other and
substituting a cable length for a distance between the supports by using the flat cable
assumption: 3 3 3 1 s, 3 ly s' 128 f 2 EC A, 128 f 2 EA, therefore: (28.) (29.) Qd. Lx sx fx2-( Ec-Ax) Lx3 -sx fx-(Ec-Ax) + - " L 'J3 Ly3-sy fy2.(Ec-Ay
).
(30.) Q=Qx+Qywhere Qd is the dead load, although any load may be used in this formula.
Since
Aq 2
22
nxq Qx-Lx nyq := Qy-Ly
8-fx 8-fy (33.)
These results give the cable force in each direction due to the dead load
Q.
To obtain the required loading one can repeat the analysis using the snow, wind, and live loads, or simply scale the results to fit the proper loading. This is possible in theapproximate calculation because of the assumptions of linear behavior and superposition.
The results of this calculation will show that the suspension cables are in tension and the
pretension cables are in compression. To overcome this inaccuracy, a pretensioning force
equal or greater than the maximum compression force must be applied. The pretension
forces in the x direction cables will result in a pretension force in the y direction cables
calculated by:
nyp =n (34.)
and the vertical deflection at the center point is calculated by:
3 12
P= nxp-3 (35.)
16 f, EA, 3.
The end deflection is therefore the sum of the deflection due to the maximum load
and the deflection due to the pretension load. Since the system is assumed to be linear,
loads and deflections may be scaled. The design example calculations are shown in Appendix F.
4.4 RESULTS FROM INFINITELY RIGID COMPRESSION RING CALCULATIONS
The analysis using an infinitely rigid compression ring produces a first estimate of
the size of cables and expected deflections. In this analysis, the variables which may
affect the stiffness are limited to the cable properties and the cable sag.
The analysis uses a system of variables which does not easily lend itself to
optimization. However, an increase in sag of the cables results in a greater length, but a
decreased force in each cable. Therefore, this property may be optimized to reduce the
total material in the cables. There are other parameters which may affect the design such
as limiting the deflection of the structure under loading. The structure could be limited in
a standard fashion, to an L/240 requirement, increasing the complexity of the problem.
4.5 APPLICATION TO THE ROCKWELL CAGE
Design loads are detailed in Appendix B and include dead load (Qd) snow load
(Qs) and wind load (Qw). For the Rockwell Cage, the results show that for the given
load cases, an incredibly small amount of steel is required. The resulting cables are 15.6
2 2
mm and 217 mm , with a total deflection, due to dead, snow and pretensioning loads, of
0.562 meters upwards. Deflection due to the live load only (snow) is 0.343 meters
downwards or L/140 on the long span. The design value of L/240 results in a 0.197 meter
allowable deflection under snow load which is equivalent to a 0.097 meter allowable
deflection under dead load (wx). The stiffness of this structure must be increased to meet
The following graphs show the effect of changing various parameters on the
deflection, and thus stiffness, of the system. The charts were created using the
approximate calculation described above and the following values:
Length of Structure Ly 60 Meter
Width of Structure Lx 48 Meter
Area of Suspension Cables Ay 2.604 e-3 Meter2
Area of Pretension Cable Ax 2.34 e~4 Meter2
Sag in Suspension Cable fy 6.026 Meter
Sag in Pretension Cable fx -2.4384 Meter
Dead Load Qd 704 Pascal
Snow Load Qs 1436 Pascal
Wind Load Qw -603 Pascal
The response of the cable net to an increasing load is linear according to these
equations (Figure 16). This is the result of the initial assumptions and is therefore
The graphs below show that there is an ability to alter the stiffness by various
means. One solution which achieves the desired stiffness characteristics is simply to
increase the suspension cable area. This solution requires no change in the other
variables, and results in the desired performance characteristics.
0.4 0.2 0-C8 1.3 1.8 2.3 28 L) -0.2 r- -0.4- -0 -0.6 -0.8 -1 -1.2 Ay*/Ay
Figure 17: Effect of Ay on deflection for the approximate calculation of the cable net with a rigid edge.
When the area of the pretension cable is increased as some load, the pretension
force is determined by the unloading of the suspension cable instead of the unloading of
the pretension cable.' This accounts for the discontinuity of the curve. In general, the
increasing of the pretension cable area also decreases deflections.
0.6 0.4- 0.2-Z 0 *0 10 C.8 1.3 .8 2.3 2.8 3 3 V E -0.2-CNA 0 -0.8--1. -1.2 Ax*/Ax
Figure 18: Effect of Ax on deflection for the approximate calculation of the cable net with a regid edge.
A similar result is found with the increase in pretension cable sag, fx (Figure 19).
The structure increases in stiffness with the increase in cable sag. The relationship is
non-linear. 1
0
--0.2 0. 0.4 -G -. 8- --- 1 2 oo, a.) 4)/ 2-2 / wt 52 -'0 4)I 04) -5/ -6 -fx/fy4.6 INTRODUCTION OF THE FLEXIBLE COMPRESSION RING
The previous analysis assumed that the edge ring is infinitely rigid, which will
never be the case. Since small support movements can result in large mid-span
deflections, the flexibility of the edge ring should be considered. For this analysis, it is
assumed that the compression ring deforms in bending only and that the deflection due to
the compression forces are negligible. Furthermore, the compression ring is assumed, for
the sake of analysis, to exist in a flat plane. This is acceptable since the ring is fully
supported in the direction perpendicular to this plane.
The primary technique used to analyze this problem is to separate forces which
cause pure bending from those which produce pure compression. The forces which
produce pure compression are those which act inwardly from all sides. The forces which
act inward on one set of cables, and outward on the other are those which cause pure
bending (Figure 20). In the calculations to follow, the forces which cause pure bending
will be labeled with a 2 and those causing compression labeled with a 1.
The equations used in these calculations are from Szabo, and may be seen in the
example solution in Appendix G. These calculations are added for completeness and not
derived in this paper.
As expected, the introduction of the compression ring alters the results of the
calculation significantly. It was shown in section 2.1 that a deflection of a support
substantially affected the deflection of a cable. As the structure is loaded, the suspension
cables cause the compression ring to deflect, shortening the distance between ends of the
suspension cables and outwardly deflecting the ends of the pretension cables. Therefore,
as the ring deflects, a greater force in the pretension cables is induced.
Another aspect of these calculations becomes interesting following the
introduction of the compression ring. The initial sag in the cables greatly affects the
bending moment in the compression ring. As is shown in the calculations, the pretension
force may be calculated such that it minimizes the total design moment for the
compression ring. As long as this pretension force is also greater than the minimum force
required to keep all of the cables in tension under all design loads, it is an acceptable
solution. Szabo and Kollar's calculations show that the two values match at
approximately fx/fy = 0.53. Therefore, at this point the structure would be optimized for
bending stresses in the compression ring. Following their calculations exactly, it is found
that the 0.53 ratio forfx/fy holds true for the Rockwell Cage structure as expected (Figure
70000 -60000 50000 40000-30000 20000- 10000-0 0.3 0.4 0.5 0.6 0.7 fxly
Minirnm pEnsioning - - - - Prenmsioningfor rinirrnringrmTmt
Figure 21: Results for Szabo's caclulation on Rockwell Cage
This ratio does not hold true when the calculations are applied to the
Massachusetts State Building Code load factors. The Szabo and Kollar calculations use
the maximum uplift condition of wind in the absence of dead load while the local code
uses a portion of the dead load in conjunction with the wind load. This reduces the
maximum uplift condition significantly. Therefore, the required curvature on the
pretension cables is not as great in the optimized condition. The optimum value for fx/fy,
to reduce the bending moment of the compression ring, occurs at approximately 0.14
(Figure 22). If the suspension cable is set at a sag-span ratio of 0.1, as has been done for
these calculations, the resulting sag ratio in the pretension cable is therefore only 0.02 for
the Rockwell Cage. This value is extremely small and raises concerns of flutter and other
local instabilities. Buchholdt, for example, recommends a minimum cable sag/span ratio
of 0.04 to avoid local effects (Buchholdt). Furthermore, a minimum curvature is required
reason for setting a minimum curvature of the pretension cable. Although these criteria
need further research and analysis to be set correctly, a minimum of 5% sag in the tension
cable will be used resulting in afx/fy ratio of approximately 0.4.
120000 100000 80000-60000 -E 40000 20000 ... 0 -20000 ) 0.2 0.4 0.6 0 8 -40000 -60000 -fx/fy
- - - Pretension required for cable forces Pretension for minimum ring moment
Figure 22 Results using modified analysis for Massachussets State Code
With the value of sag in the two cables set, the pretension required for the two
optimal situations may be found in Figure 22. It is therefore clear that the pretension required to avoid a loss of tension in the cables is far less than that required to obtain the
minimum design ring moment. Due to the large difference between the two values, it
will be assumed that the compression ring will be designed to resist the required moment
even though it is not the absolute minimum. This analysis is clearly simplified, and a
cost analysis of this question would be beneficial to determine the validity of choosing
stiffness which must therefore be compensated for in other aspects of the structure (Figure 23). 1.5 1 E 0 - - - - -wx 1 2 3 ---- wp 0 -0.5 wtot a) 1 1.5 --2 Ir (meters4 )
Figure 23: Change in deflection with respect to Ir
The equations presented by Szabo and Kollar represent a useful guide for a
preliminary design of a cable net structure. In using these equations and the subsequent
conclusions, however, it is important to note the effects of various parameters. The
system of equations required to estimate the behavior of a cable net roof is extremely
complex and indeterminate, resisting efforts to draw simplistic conclusions. In
determining the guide ratio for minimum bending in the compression ring it is crucial to
determine ring stiffness and load criteria.
The above calculations are able to offer some direction, but they do not fully
explain the cable net system. Cable structures behave in a non-linear fashion. The above
analysis is unable to calculate system response to non-uniform loading and is sure to have
5 COMPUTER ANALYSIS
5.1 SAP 2000
SAP 2000 Non-Linear seemed to be the perfect tool to analyze a non-linear
structure. The program is well suited for a p-delta analysis of a regular structure.
However, the program is be unable to correctly analyze cable members. If the members
are released at the ends, the structure quickly becomes unstable. The program also fails
to analyze tension only members, thus allowing them to carry compression loads.
5.2 ANALYSIS USING EASY
SAP 2000 exhibited significant shortcomings in the analysis of cable net
structures. To achieve a more accurate analysis, the program EASY, by Technet, was
employed. Technet is a German company which specializes in lightweight structural
design and consulting. Their program is self described as "a fully comprehensive suite of
software modules for the complete design of geometrically non-linear lightweight
structures (EASY 2000)."
The program is efficient at finding the appropriate form for a given set of
constraints such that cables are in tension and forces are in equilibrium. This process of
form-finding is otherwise difficult and has involved various techniques including soap
bubbles and hanging sheets (Otto). The process is greatly facilitated by EASY.
what each of the sub-programs does, and took much research of the help menus to
determine which to run and in what order.
The primary function of the program may be its form-finding ability. The
following example form was found in less than five minutes. This example shows a
composition of a net hung from a series of random fixed beams. While this particular
case is not applicable to the Rockwell Cage design, it displays the power of such a
program in determining net shapes for almost any set of parameters.
GEDDREI -C:EASYNTxest2\Fofin ein
a
( as, a) :35.21 v: 2.0
Figure 24: Random beam net formation using EASY.
Applying the program to a set shape and defined parameters is a more difficult
matter. The program does not allow parameters such as cable areas and Young's modulus
dimensionless, and therefore the default value was unknown. However, a simplified
model for the Rockwell Cage was constructed as shown in Figure 25.
-GEDEIN -C:\%EASYN T test 2\-ofin. in
<~
41 A
S45, 7) 3: -23.94V 1 7
Figure 25: EASY mesh generaion for simple model of Rockwell Cage.
EASY was written with the intent of form-finding, calculating stresses and
quickly determining a cut-out pattern to efficiently construct the membrane. Because it
does not allow the input of Young's modulus or cable areas, EASY is not an effective
6 NON-LINEAR MATRIX ANALYSIS
The failure of alternative structural analysis programs to offer desired results led
to the creation of a non-linear matrix solution. Such a solution may not be as complete,
or user-friendly, but allows for a much better understanding of the parameters and
problems involved in solving cable nets while offering and exact solution. The analysis
of these structures is simplified by the nature of cables and the loading pattern. Since the
loads are applied at the cable joints, and the cable only carry axial loads, a simple rod
equation system may be used. The stiffness equation has two parts, a linear stiffness (KI)
and a geometrical non-linear stiffness (Kg). The terms from each are described below.
K, = K, + K, AE, K, = a'a (36.) L F Kg = I L Where: a X2 X1 ~ , 2 -Z1 (37.) Li L L And finally: U = K-1 *P (38.)
The solution of these equations involves an iterative method. First, the equations
are solved as written above and deflections are found. Next the stiffness matrix is
adjusted to account for the change in position of the members. This adjustment includes
the deflection. An internal load vector is subsequently created to account for the forces in
the members. This new vector is added to the external load vector and the equations are
solved.
Ax=(x 2 +u2)-(XI +uI)
Ay =(y 2 +v2)-(y 1 +v1) Ax = (z2 + w2) - (zI + wI) L2 -Z2 + 2 Z + 2 22 2 ___ Ay 2 Z2) L2 L2 L2
The new length can be used to determine the force in each member:
e = L2 -LI
BA
F2 = e an
LI
Internal forces and the stiffness matrix can then be found:
(39.) (40.) (41.) (42.) (43.) (44.) P= F2
Q8
K=AET
F K, = /3Q+-I L2 L And finally: AU = K-1 * (P, + 1P) (45.)The solution for the deflections can then be entered into equation 39 and the
process repeated until a solution is found. A solution is found when external forces
balance internal forces or the change in the displacements is zero.
6.1 CREATION OF THE COMPUTER PROGRAM
The program was written using Matlab. The general flow of the program can be
seen in Figure 26. The program begins by reading the data. At this point, the two data
files are read, supplying joint locations, boundary conditions, connectivity and cable
areas. Then initial values are calculated including member lengths, alpha, and member
pretension forces. The first incremental value for displacement is then calculated. Using
this value the program enters the main loop. New lengths, forces and alpha are calculated
which results in a new value for the displacements. The solution is then checked for
convergence. If the solution has not converged, the program stays within the main loop
until the solution converges. Once the program has converged, the initial values can be
changed in the larger loop, allowing for examination of the main parameters. The code
Figure 26: Flow of the computer program.
6.2 SOLUTION OF THE FLAT CABLE
The flat cable is an interesting problem which cannot be solved by most simple
structural design programs. However, the analysis described above effectively finds a
solution. Using the computer program formulated for Matlab, the analysis is
straightforward. The analysis quickly converges, requiring less than twelve iterations for
The program was run on a flat cable with two rod elements each with a length of
2
30 m, an area of 1 m , and an initial pretension of 10 N. Young's modulus was set at 1.6 e " Pa. Under a point load of 1 Newton, the solution found was that the center point
moved only in the vertical direction of the amount -5.519 e -3 m. Therefore, the
elongation of the cables is e = 302 +(-5.519e- 3)2 = 5.0766e- m, and the force in the cable is
AE
F =-e = 2717.5 N. The vertical component of this force is 0.5 N. Since there are two
L
cables, the total vertical force is therefore 1.0 N, and the system is in equilibrium. A
similar test was run using four cables.
To understand the parameters that affect the response of a cable, each was altered
and the response was observed. The Matlab solution was ideal for this study as a simple
loop could be inserted to change parameters and record the response. Running such a
study on most commercially available software would have been far more tedious.
The first analysis examined the response of the cable to a changing point load.
The load was increased from -I to 8.8 N. The response shown in Figure 27 demonstrates
the non-linear response of the cable. As load is increased, the incremental deflection
decreases. Therefore, the cable increases in stiffness under increasing load. At low
loading the stiffness of the cable is much less, resulting in the significant deflections near
a 0 0.016 0.012 0.008 0.004 0 -0.004 -0.008 -1 0 1 2 3 4 5 6 7 8 9 Load
Figure 27: Flat cable subjected to a varying point load.
The final geometry of the flat cable is dependent upon the pretension force. This
can be seen from the equations of the cable, as the initial linear stiffness matrix is zero
with respect to vertical deflections. Deflections vary linearly with the pretension force as
can be seen in Figure 28.
0 0 0.005530 0.005525 0.005520 0.005515 0.005510 0.005505 0 5 10 15 20
Horizontal Pretension Force
25 30
The cable exhibits a linear response to a change in cable area. This
non-linear response is due to the increase in restoring forces as the area increases. The
response of various size cables to a point load is shown in Figure 29.
a 0 0.012 0.01 0.008 0.006 0.004 0.002 0 0 1 2 3 Cable Area 4 5 6
Figure 29: Deflection of a cable subject to point load with varying cable area.
The final study performed on the flat cable was an increase in initial sag. The effect of the initial sag is an increase in both the linear and non-linear stiffness terms. Furthermore, the non-linear term has a vertical internal force as a result of the geometry and the pretension force.
6.00E-03 5.00E-03 c 4.OOE-03 0 1 3.00E-03 O 2.00E-03 1.00E-03 0.00E+00 0 0.1 0.2 0.3 0.4 0.5 0.6 Initial Sag 7.00E-06 6.00E-06 5.00E-06 - 4.00E-06 3.OOE-06 2.OOE-06 1.OOE-06 0.OOE+00 0 0.1 0.2 0.3 0.4 0.5 0.6 Initial Sag
Figure 30: Cable subjected to point load with a varying initial sag.
6.3 Two OPPOSING CURVATURE CABLES
This analysis can be expanded to include two cables with opposite curvatures. In
this case, the structure is made up of four rods to create an X formation. The top two
cables are the suspension cables as they are correctly positioned to carry the load. The
bottom two cables are the pretension cables. They allow the structure to be pretensioned
Pa was used, and the load varied between 10 and 100 N. The results are shown in Figure 31. 4.OE-08 3.5E-08 3.OE-08 o 2.5E-08 2.OE-08 '> 1.5E-08 1.OE-08 5.OE-09 O.OE+00 0 1 2 3 4 5 6 7
Vertical Force Applied
Figure 31: Displacement of a two cable system.
The results for this system demonstrate the system's initial rigidity. Deflections on the system are relatively small compared to a comparable cable. Of primary interest is that as the load is increased, it becomes sufficient to remove tension in the pretension cables. Under this load, the system stiffness decreases. More importantly, if the system were loaded to such a level, the decreased stiffness, particularly in the opposite direction, may allow for instability in regards to wind loads which may cause flutter.
6.4 CABLE NET
Having proven the efficacy of the program, and examining parameters of simple systems, a cable net with proportions roughly that of the Rockwell Cage was examined. The model used was a rectangular grid with a total area of 48 meters by 60 meters. Three cables span in each direction, following the geometry of a hyperbolic paraboloid of
4
f ~±4f~
Z = -fxX2 +--y 2. Initial values were obtained from the equations from Szabo and
L LY
Kollar described previously. Pretension forces, cable
reflect the much greater cable spacing for this model.
areas and loads were scaled to
Spacing of Suspension Cables Dy 12 Meter
Spacing of Pretension Cables Dx 15 Meter
Area of Suspension Cables Ay 2.604 e-3 Meter2
Area of Pretension Cable Ax 2.34 e~4 Meter2
Horizontal Pretension Applied to Hy 214,672 Newton
Suspension Cable
Horizontal Pretension Applied to Hx 325,165 Newton
Pretension Cable
Sag in Suspension Cable fy 6.026 Meter
Sag in Pretension Cable fx -2.4384 Meter
Uniformly Applied Point Load P 385,267 Newton
The results from this example were surprisingly different from the results
predicted by Szabo and Kollar. The deflection of the center point of the net was found by
matrix analysis to be 3.2 meters. The expected deflection by approximate methods was
1.507 meters upwards due to the pretension force and 0.504 meters downward due to the
combined loading, resulting in a 0.569 meter deflection upwards. The Matlab model had
a negligible deflection as a result of the pretension forces alone.
The difference in pretension deflection is a result of the method of solution.
cables are elongated but under stress. If the initial geometry is exact for the given load,
the initial deflection should be zero. For this case, the pretension force caused an
insignificant deflection, but it did cause some deflection. Increasing pretension forces
increased the deflection, but the total pretension deflection remained negligible with
respect to the total deflection, demonstrating that the form was correct.
0.OE+00 2.OE+06 4.OE+06 6.OE+06 8.OE+06 1.OE+07 1.2E+07 0 -0.001 , 0.002 -_ -0.003 0.004 0.005 -0 -0.006 0.007 o 0.008 --0.009 -0.01
Pretension Force Hx (Newtons)
Figure 32: Deflection due to pretension force alone.
(Note negative deflection implies upward motion.)
Another difference between these two calculations is that the Matlab solution
shows an unloading of the side pretension cables under load. This may be due to the
rectangular geometry as opposed to the elliptical edge ring. Such a ring would add
stiffness to the cables that are off center, as they become shorter. Although the center
pretension cable is still active, the loss of tension in the side cables significantly affects
deflection. In order to examine this, the horizontal pretension was varied to observe the
effect of the unloading of these cables (Figure 33). The stiffness is nearly linear to the point where all cables remain in tension. At this point, the structure increases in stiffness
Szabo and Kollar calculated deflections and forces for the central cables only.
Using the Matlab program, this approach is found to be invalid for a rectangular plan.
While the central cables exhibited roughly the same forces as calculated approximately,
the unloading of the side cables significantly impacted the response of the structure. Had
the cables remained in tension for the matrix analysis, it is assumed that the model would
have responded with a deflection of approximately 1.8 meters (Figure 33). Such an
approximation is based on a tangent stiffness value, which assumes a linear response.
This assumption of linearity appears to be nearly correct. However taking a different
tangent value, it can be seen how a deflection value of 0.5 m can be found. Szabo and
Kollar assume that the stiffness is linear for their calculations, which results in significant
inaccuracies for this particular case.
3.5
.. Indicate projected linear response
3 - based on tangent stiffness values.
02.5 2 .1.5
0.5 0
0.OE+00 2.OE+06 4.OE+06 6.OE+06 8.OE+06 1.OE+07 1.2E+07 Pretension Force Hx (Newtons)
Figure 33: Deflection of cable net with varying horizontal pretension.
complex and non-linear. An appropriate solution would require optimization of the various parameters, which is beyond the scope of this study.
3.5 3 $ 2.5 2 .2 1.5 1 0.5 0
0.0 2.OE+06 4.OE+06 6.OE+06 8.OE+06 1.OE+07 1.2E+07
Pretension Force Hx (Newtons)
Trial 1 --- Cable areas doubled
Figure 34: Deflection of cable net for two trials. E+00
7 CONCLUSION
Cable net structures offer a pleasing form with unique structural properties.
However, many designers and most standard design tools are not equipped to design
these structures. Approximate solutions, are inadequate for examining the behavior of
cable structures.
A non-linear matrix analysis is a proper tool for analyzing a cable structure. It
provides the ability to analyze any form, under any loading. It correctly handles tension
only members, and can be modified to include compression and bending members.
It is apparent that even with such a tool, designing cable net structures remains a
difficult task. The behavior of a cable net depends on a large number of parameters and
behaves non-linearly. A proper engineering solution to such a problem would involve
BIBLIOGRAPHY
Architectural Fabric Structures: The Use of Tensioned Fabric Structures by Federal
Agencies. National Academy Press, Washington, D.C. 1985.
Blau, Stacey E. "MIT Maps-out Plan for Athletic Center," The Tech. Volume 116, Number 63, December 3, 1996.
Bucchholdt, H. A. An Introduction to Cable Roof Structures. Thomas Telford Ltd. London. 1999.
"EASY: A System for Lightweight Structure Design from Technet GmbH." from
Technet GmbH Homepage
http://www.technet-gmbh.com/english-old/easy-e.html accessed 3/29/2000.
Irvine, H. Max. Cable Structures. The MIT Press. 1981.
Long Span Roof Structures: Proceedings of a Symposium Held at the 1981 Annual Convention and Exhibit St. Lous, Missouri, October 26-30, 1981. American
Society of Civil Engineers, New York, 1981.
The Massachusetts State Building Code: 780 CMR Sixth Edition. State Board of Building
Regulations and Standards, 1997.
Minimum Design Loads for Buildings and Other Structures ASCE 7-88, American
Society of Civil Engineers 1988.
Otto, Frei. Tensile Structures: Volume 1. The MIT Press. 1967.
Szabo, J. and Kollar, L. Structural Design of Cable-Suspended Roofs. John Wiley & Sons, New York, 1984.
Ax Ay Ec Er f F fx fy Ho Kg K, L Lx Ly nxp nxq nyp nyq P Pe P1
Q
Qx
QyAPPENDIX A: SYMBOLS USED
Area of pretension cables. Area of suspension cables. Young's Modulus of cables.
Young's Modulus of compression ring. Sag in cable.
Axial force in cable. Sag in pretension cable. Sag in suspension cable.
Horizontal component of cable tension. Geometric non-linear stiffness matrix. Linear stiffness matrix.
Length.
Length of pretension cables. Length of suspension cables.
Horizontal force in the pretension cable due to the pretension load.
Horizontal force in the pretension cable due to load Q. Horizontal force in the suspension cable due to the pretension load.
Horizontal force in the suspension cable due to load
Q.
Point load.External load. Internal load. Uniform load
Portion of Q distributed to pretension cables. Portion of Q distributed to suspension cables.
A Change.
a Direction of cosines.
APPENDIX B: DESIGN LOADS
The design loads for this project were chosen to conform with the Massachusetts
State Building Code 780 CMR - Sixth Edition. They are as follows:
DEAD LOAD
STRUCTURAL LOAD
ASSUMED
20 Gage metal deck Fiberboard insulation Waterproof Membrane 1/2 in stone ballast TOTAL DECK ASSUMED 15.0 psf 2.5 psf 1.5 psf 0.7 psf 4.0 psf 8.7 psf 5.0 psf 28.7 psf LIVE LOADS ROOF
Tributary load area > 600sq ft
Zone 2 Basic 12.0 psf 30.0 psf Unbalanced 100%/50% DECK HUNG TOTAL SNOW
APPENDIX C: COMPUTER PROGRAM
The following program was written for Matlab.
% Dan's Thesis - Tangent Stiffness Truss Method
% filename thesis.m
% datafiles points.dat thesisP.dat
% element.dat thesisE.dat
% area.dat
clear
% units are N-m
%%%%%%%%%%%%%% define variables %%%%%%%%%%%%%%%%%%%%%%%%
Hx = 100 %11030 * 15; % Horizontal pretension force in x
direction
Hy = 100 %9437 *12; % Horizontal pretension force in y
direction
E = 160*10^9 % Young's Modulus
AppliedForceZ 0 % -385267.0 % Uniform Point Load
TensionOnly = 1 % 0=NO, 1=YES
%%%%%%%%%%%%%%%%%% read data files %%%%%%%%%%%%%%%%%%%%%%
%[numn x y z boundx boundy boundz] = textread('ThesisP2.dat', '%d %f %f %f %d
%d %d');
%[numm i j Area] = textread('ThesisE2.dat', '%d %d %d %f');
[numn x y z boundx boundy boundz] = textread('cableP.dat', '%d %f %f %f %d %d
%d');
[numm i j Area] = textread('cableE.dat', '%d %d %d %f');
%%%%%%%%%%%%%%%% Calculate Number of Nodes and Elements %%%%%%%%%
NumNodes = max(numn);
NumEle = max(numm);
%%%%%%%%%%%%%%% Create force and boundary arrays %%%%%%%%%%%%
P(NumNodes*3,1)=0; B(NumNodes*3,1)=0;
%%%%%%%%%%%%%%%%%%%%%%%%%%%%%%%%%%%%%%%%%%%%%%%%%%%%%%%%%%%%%%%%%%%%%% %%%%%%%%%%% Total loop to iterate forces %%%%%%%%%%%%%%%%%%%%%%%%%%%% %z (2)=1.1
for iter = 1:50
AppliedForceZ = AppliedForceZ -200 % incremental force
%Hx = Hx + .1 % incremental force
%Hy = Hy + .1 % incremental force
%Area = Area+.l % incremental area
%z(2) = z(2) + .1 % incremental geometry
t=0;