HAL Id: hal-03215371
https://hal.archives-ouvertes.fr/hal-03215371
Submitted on 3 May 2021
HAL is a multi-disciplinary open access
archive for the deposit and dissemination of
sci-entific research documents, whether they are
pub-lished or not. The documents may come from
teaching and research institutions in France or
abroad, or from public or private research centers.
L’archive ouverte pluridisciplinaire HAL, est
destinée au dépôt et à la diffusion de documents
scientifiques de niveau recherche, publiés ou non,
émanant des établissements d’enseignement et de
recherche français ou étrangers, des laboratoires
publics ou privés.
Tropospheric corrections of SAR interferograms with
strong topography. Application to Etna
C. Delacourt, Pierre Briole, J. Achache
To cite this version:
C. Delacourt, Pierre Briole, J. Achache. Tropospheric corrections of SAR interferograms with strong
topography. Application to Etna. Geophysical Research Letters, American Geophysical Union, 1998,
25 (15), pp.2849-2852. �10.1029/98GL02112�. �hal-03215371�
GEOPHYSICAL RESEARCH LETTERS, VOL. 25, NO.15, PAGES 2849-2852, AUGUST 1, 1998
Tropospheric corrections of SAR interferograms with
strong topography. Application to Etna
C. Delacourt,
• P. Briole
•'3 and J.Achache
•
Abstract. The accuracy of spaceborne geodetic tech-
niques, including SAR interferometry, is limited by the time and spatial variation and altitude dependance of
the propagation delay of electomagnetic waves in the
lower troposphere, particularly in mountainous areas. In this paper, we use a 1D model developed for tropo- spheric corrections of G PS and DORIS measurelnents to correct SAR data. The differential tropospheric
delay is computed at each pixel of the interferogram
from ground temperature, humidity and pressure using
two empirical parameters calibrated from several radio- soundings acquired in various latitude and climate con- ditions. It is shown that with such a model, given the 3300 meters topography of Etna, tropospheric varia- tions can generate up to 47r phase rotations between the top and the bottom of the volcano. In 16 out of the 20 interferograms processed with images acquired be- tween August 1992 and October 1993, correction of the tropospheric effect reduces the number of fringes associ- ated with the 1991-93 eruption from previous estimates. The remaining deformation is consistant with a deform-
ing source located at a depth of 14+1 km. During the
second half of the eruption, the subsidence rate at the
top of the volcano is roughly stable at 13+3 ram/month.
These values are in good agreement with tiltmeter data collected on Etna during the same period and with the
estimated volume of erupted material. No significant
deformation can be observed during the last month of
eruption. Inflation of the volcano seems to resume im- mediately after the end of the eruption at a rate of 3 mm/month.
Introduction
Differences in meteorological conditions between ac- quisitions must be taken into account when processing
Synthetic Aperture Radar differential interferograms
(InSAR) [Taragrc and Massonnet, 1996;Zebker et al.,
1997], as the troposphere affects propagation of the
electro-magnetic waves. This is particularly critical in mountainous areas due to the existence of complex and variable vertical gradients in the lower troposphere.
11nstitut de Physique du Globe de Paris, France
2BRGM, France 3 CNRS - UMR 7580
Copyright 1998 by the American Geophysical Union. Paper number 98GL02112.
0094-8534/98/98GL-02112505.00
2849
This effect can be evidenced on previously published in-
terferograms (see North-West part of figure 4a in Mas-
sonnet et al, 1995 or figure 3 from Tarayre and Mas- sonnet, 1996) where fringes correlated with the topog- raphy can be observed in areas supposed to be free of any ground deformation during the time period covered by the SAR images. Contamination of InSAR data, by tropospheric artifacts thus limits the accuracy of mea- surements of small surface motions especially over large areas. To take this effect into account, it is necessary to correct the interferograms for the tropospheric delay. In this paper, we apply a semi-empirical approach devel- oped for tropospheric corrections of G PS and DORIS
measurements [Baby et al., 1988] to the case of SAR
interferometry.
Tropospheric excess path
The delay Av that affect the propagation of an elec- tromagnetic wave through the troposphere is defined as Av -- r•--R/c where R is the geometric distance be- tween the satellite and the ground and •-½ the propaga-
tion time. Azoulay (1976) showed that the curvature
of the ray can be neglected for incidence angles greater
than 10 ø as in the case of ERS-1 (21ø). Replacing •-• by
its expression as a function of refractivity N along the ray path s, we obtain ß
1/'
R 10
-6
Ar--
(1 + 10-6N(s))ds
=
c c c
The excess path AL may be defined as:
AL cA•-
- -10
-6
/
3;(•)• (•)COS0
where h is the vertical elevation and 0 the satellite
angle of sight which will be considered uniform for all pixels of a SAR image. Using the assumption of an hor-
izontally stratified troposphere, Bean (1966) proposed
the following expression for the reftactivity N(h):
?(•)
0
5 •(•)
N(h)
- 77.6T(h)
+ 3.73,
i T•,(h) (3)
where P is the total pressure (in mb), e the water vapor partial pressure, and T the temperature (in K). The excess path can thus be written:
AL
= 77.6,10-•J
'P(h) 0.373/
+ coO
e(h)dh
12850 DELACOURT ET AL.: TROPOSPHERIC CORRECTIONS OF SAR INTERFEROGRAMS
The first term of AL, which depends on P and T, is known as the hydrostatic component ALh. The sec- ond term which depends on T and e, is known as the wet component AL,:. Assuming that the troposphere is an ideal gas in hydrostatic equilibrium, Saastamoinen
(1972) showed that ALh could be simply expressed as
a function of ground pressure Pg:
ALh = 2.27,10-3pg
Wet component of the excess path
Several expressions for AL•: as a function of ground- based meteorological parameters have been proposed in the literature. Assuming that e exponentially decreases and T linearly decreases with elevation, Saastamoinen
(1972) proposed the following expression for AL•: :
1255)
AL•
-- 2.277,
10-3(0.005
q- Tg * es (6)
where Tg and eg are the values of T and e at ground
level. Models for the decrease of water vapor partial pressure as a function of height have been proposed
by Smith and Weintraub (1953) and Hopfield (1971).
However, field measurements have shown that humid-
ity profiles are in general much more complex [Baby
et al., 1988] and impossible to fit with an exponential
expression as used by Saastamoinen (1972). Baby et
al (1988) made the assumption of a constant humidity
rate U=Ug up to a given elevation hm where it reduces
to zero. To better comply with local observations of the troposphere, they introduced in their model two regional parameters adjusted for different climatic con-
ditions (continental, tropical...) and different latitudes
to fit the large number of available radio-sounding pro- files. Their expression AL• then reduces to the simple semi-empirical formula:
AL.: - yUglO
'•(Tg-273)
(7)
where • (in mm) ranges from 0.4 for a continental
climate near the pole to 0.9 for an oceanic climate at the
equator,
and 7(inc -•) ranges
from 0.022
for an oceanic
climate at tropical latitude to 0.029 for a continental climate at the pole.
ALdi!
1
cosO
(2.27,10-3(Pgx
- Pg2)+ (9)
ua• 10
•(r•-2*a) - Ug210
•(r•-2*a))
Ground values Psi, Tsi and Usi depend on the altitude
of the corresponding pixel in the image i. They can be expressed as functions of To, Po and U0 measured at a reference point of elevation h0. T is assumed to decrease linearly with h with a gradient k ranging from 0.0055
to 0.0072.
For the pressure, we use the expression defined by
Triplet and Roche (1983):
P(Ah) = P0(1- 22.6,10-6Ah)
5'26
(10)
Where Ah = h- h0. U is assumed to be constant
as discussed in the previous section. Finally, substitut-
ing eq(10) into eq(9) and taking U s = U0 leads to the
following expression for ALdi! :
2.27,10-a(P0x
- Po2)(1
- 22.6,10-6Ah)
5'26
ALdi!
=
cosO
b' (Uo110
"f(Tøx-273-kAh)
- U0210
"f(Tøa-273-kAh))
(11)
+c•
Tropospheric correction of
interferograms of Etna
To compute the differential tropospheric delay on Mt Etna, we used daily ground-based data measured at
the meteorological station of Serra La Nave (SLN) in
the western part of the volcano at 1750 m and the ra- dio sounding profiles carried out, almost at the time of the SAR image acquisition, at the Trapani meteo-
rological station located 200 km West of Etna (Figure
1). The profiles show a systematic thermal inversion
between ground level and 500 m height as expected for night-time profiles. Above 500 m, the temperature decreases roughly linearly with a vertical gradient of
-0.0068 (value averaged over all available soundings).
To compute the excess path from those data, we used
eq(11) and values of 7 and •, extracted from Baby et al
(1988) to fit with the Etna area. Tropospheric correc-
tions were computed on 20 interferograms created by
Differential tropospheric delay
Expressions (5) and (7) allow us to compute the tro-
pospheric excess path Aœ of SAR wave from ground-
based meteorological data Pg, T s and Ug :
2.27,10-3pg
q- uUglO
'y(Tg-273)
AL -
cosO
(8)
In an interferogram the differential tropospheric de- lay, at a given pixel is thus:
Figure 1. Radio-sounding profiles associated with the
interferograms shown on figure 2. (A) Humidity pro-
files. Complexity of the profiles is clearly visible in these
DELACOURT ET AL.- TROPOSPHERIC CORRECTIONS OF SAR INTERFEROGRAMS 2851
CNES with the images acquired between August 1992 and October 1993 and previously analyzed by Masson-
net et al. (1995). The tropospheric correction reaches
2 fringes for some interferograms. Figure 2 shows an
example of two interferograms before and after tropo-
spheric correction (corresponding radiosounding data
are plotted on Figure 1). Both interferograms start
on 23/08/92 and span respectively 280 and 350 days.
The difference between both is located after the end of
the eruption period in which no significant deformation is observed on Etna by classical means (Bonnaccorso,
1996). Similar amount of deformation is thus expected
on both interferograms. Figure 2a and 2b show a differ-
ence of 2 fringes (5.6 cm) prior to tropospheric correc-
tion, and this discrepancy dissapears when tropospheric
correction is applied (Figure 2c and 2d). This example
illustrates how much our correction can improve the accuracy of interferograms of Etna. In average on all
interferograms that we examinated, we estimate a fi-
nal accuracy after tropospheric correction is about. + 1
fringe (2.8 cm). The residuals should be due lnainly to
the 3D heterogeneities of the real troposphere and the
inospheric noise.
C 4•o•o -- 4emoo • • D 400000 •ooo •0oo rno•o
Figure 2. Example of tropospheric effect. on differen-
tial SAR interferograms of ETNA. (A) 5785-9793 dif-
ferential interferogram (B) 5785-10795 differentiel inter- ferogram. (C) Tropospheric correction for couple 5785- 9793 deduced from meterological conditions plotted on figure 1. (D) Tropospheric correction for couple 5785- 1079.5 deduced from meterological conditions plotted on figure 1. (E) 5785-9793 differential interf•rogram alter tropospheric correction. (F) .5785-10795 differential in- terferogram after tropospheric correction.
I
Eruption I end DI ate j 23/08 27/09 01/11 06/12 10/01 14/02 21/03 25/04 30/05 04/07 08/08 12./09 17/10 8791 9292 97•3 10294 10795 11296 11797 5785 (1286 6%87 7288 7%89 8:190 :• : o• -' ' 'l ' ' ß . ß . :4 - 13/Ji ß I ß : . : .. ß • ' 8 / t• ' I ' : =: . . :a/1 ' ß : ' I ß . . ' ' ß - - ' 'l : ' : : ' '.4 ' 13/8 •' ' I .... 2 i "• : ', : ß : : : : .-_ ß ß 12 7 I ß . . . . ß . . ß , . ß •-: : : : '4 : : . 11 161 . ' ' ' ß 121'7 I , ß . . . :- : -. i : . . . ' .• . 13/R I . : ' : :4 11/'i I ! ß _. ß . ß ß '• ' !1•'6 I ' . ' •-' '_ 2/L: ' ß ß ß :•_ " ß 3 / ;/ I ;: ß ' . : '.( . j -I / :• ß . •: . ß • :111 ' : : ß i -• / -1 : ß I • • ' ' I :• -6 I-1 • I '• ..41-2 ß ß I 11o'
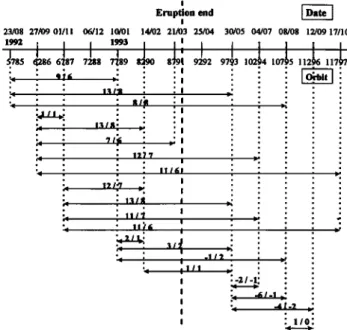
Figure 3. Subsidence of the summit of Etna (in cm)
observed between 23/08/92 and 17/10/93. First bold
number corresponds to maximum displacment observed without tropospheric correction, second one after tropo- spheric correction. Uncertainty on the results is 3 cm.
Discussion
In a previous study, Massonnet et al. (1995) inter- preted the fringes observed on 1992-93 interferograms of Etna (without tropospheric correction) as the sum of a regional volcano-wide ground subsidence due to the 1991-93 eruption and local deformation associated with recent emplacements of the 1986-87 and 1989 lava flow
further modeled by Briole et al. (1996). Here, we use
the 6 ascending pairs published in their work plus 14 additional ascending pairs which presented enough co-
herence (Fig 3). Low value of coherence of some inter-
ferograms in relatively large areas prevents us to esti- mate the deformation by comparing the observed inter- ferogram with a synthetic interferogram of deformation calculated using a Mogi model (1958). The fringes can be satisfactorly accounted for by the deformation re- sulting from a deflating source at 14+1 km depth. This depth could be further reduced by 1 km taking into ac-
count the effect of the volcano topography [Cayol, 1996].
The maximum deformation recorded on each interfero-
gram after tropospheric correction is plotted on figure 3. Assuming a steady state rate of subsidence of the vol- cano until one month prior to the end of the eruption,
we obtain a value of 13+3 ram/month for the subsi-
dence rate (Fig 3, against 20 row/month without any tropospheric correm. ion, Massonnet et al, 1995). The steady state assumption is consistant with the lava flow
volume and 't' ,,,e rela,ively steady state tilting rate mea- ß
sured a 4 locations during the 16 months of eruption
[Bonaccorso, 1996]. No significant deformation is ob-
2852 DELACOURT ET AL.: TROPOSPHERIC CORRECTIONS OF SAR INTERFEROGRAMS
the data indicate a slow inflation of the volcano after the eruption's end at a rate of 3 ram/month. These rates
are in good agreements with the observations of Bonac-
corso (1996). At 3 stations, MDZ, DAM and SPC, the
average measured tilt over the last 7 months of eruption is 7/•radians, and the corresponding tilt deduced from our model is 5.5 /•radians. Only tilt data collected at
MSC station (21/•.radians) is larger than predicted by
interferometry. This difference could be explained by
a local deformation which is not taken into account in
the Mogi model. MSC tilt data may also be affected by an uncorrected long term drift. Estimation of the effusive rate deduced from interferometric data using
the Mogi model
is 12.5,106m3/month
which
is in good
agreement
with the value
of 14,106m3/month
deduced
from Stevens et al (1997). However, given the uncer-
tainty of the interferograms (4-1 fringe), data of figure
3 are not unconsistant with a more complex scenario in which a slow steady-state deflation phase, say around 5
ram/month, is followed by the rapid collapse of the vol-
cano nearly one month prior to the end of the eruption.
Such a discontinuous and non elastic behaviour would
better fit with the tiltmeter data reccorded at station
MSC (Bonaccorso, 1996). Conclusion
This study shows that tropospheric corrections on ERS interferograms of Etna can account for 64-3 cm, including the error due to lateral and temporal hetero- geneities as well as ionospheric artefact not introduced in this study. Monitoring volcanic deformation with SAR interferometry is thus limited at the regional scale and meteorological data are required at one or several location of the investigated area to reach a cm accu- racy. Simultaneous GPS measurements would be a very efficient method to improve the meteorological correc-
tions [Bock and Williams, 1997]. Static tropospheric
correction is essential on sites where the topography may be less strong than on Etna but where the surface deformation accuracy required is close to the limits of interferometry. The new analysis of the 1992-1993 in- terferograms presented in this paper which accounts ibr this tropospheric correction leads to a more accurately knowledge of the deformation of Etna, during the 1991- 93 eruption. Assuming a steady state rate of subsidence of the volcano, the subsidence rate is 134-3 mm/month till one month prior eruption stops. No deformation oc- curs during the last month of eruption. Slow inflation of the volcano starts 3 nun/month after eruption stops. These results are in good agreement with both tiltmeter data collected at several stations during the eruption and with the volume of the material erupted. Further
joint modeling of data (tilt, GPS, SAR) would proba-
bly lead to an improved determination of the depth and geometry of the deflating source.
Acknowledgments. We thank Prof. Rodono from the
Osservatorio Astrofisico di Serra la Nave for providing the ground meteorological data. We are grateful to A. Bon- nacorso, B. Fruneau, F. Sigmundsson and an anonymous
reviewer for their constructive comments. This work was
supported by the EC program ENV4-CT96-0294. IPGP
contribution 1544.
References
Azoulay, A., Etude de l'infiuence de la troposph•.re sur la mesure de distance terre-satellite , Note technique
C.N.E. T, NT/EST/APH/3d, 1976.
Baby, H., Gole, P., and Lavergnat, J., A., Model for tro- pospheric excess path length of radio waves from surface
meteorological measurements, Radio Sci., 22, 1023-1038,
1988.
Bean, B. R., Dutton E. J., Radio meteorology, Monography,
Natl. Bur. of Stand., Gaithersburg, 1966.
Bock, Y., and Williams, S., Integrated satellite interferom-
etry in southern california , EOS, 78. 293-:300, 1997.
Bonaccorso, A., Dynamic inversion of ground deformation data for modelling volcanic sources (Etna 1991-93), Geo-
phys. Res. Lett., 23, 451-454, 1996.
Briole, P., Massonnet, D., and Delacourt, C., Post-eruptive
deformation associated with the 1986-87 and 1989 lava flows of Etna, Geophys. Res. Lett., 2d. 37-40, 1996. Cayol, V., Analyse dastostatique tridimensionnelle du
champ de ddformations des •difices volcaniques par •l•- ments frontii•res mixres, Thesis Paris VII, 1996.
Hopfield, H. S., Tropospheric effect on electromagnetically
measured range: prediction from sin'face weather data, Radio Sci., 6, 230-241, 1971.
Massonnet., D., Briole, P., and Arnaud, A., Deflation of Mount Etna monitored by spaceborne radar interferome-
try, , 375, 567-570, 1995.
Mogi, K., Relations between the eruptions of various volca-
noes and the deformation of the ground surface around
them, Bull. Earthquake Res. Inst., 36, 99-134, 1958.
Saastamoinen, J., Contribution to the theory of atmospheric
refraction, Bull. G4od4s., 105, 279-298, 1972.
Smith, E. K., and Weintraub, S., The constants in the equa-
tion of atmospheric refractive index at. radio frequencies, Proceedings of the IRE, 1035-1037, 1953.
Stevens, N. F., Murray, J,. B., and Wadge, G., The volume
and shape of the 1991-1993 lava flow field at Mount Etna, Sicily, Bull. Volcanol., in press, 1997.
Tarayre, H., and Massonnet, D., Atmospheric propagation
heterogeneities revealed by ERS-1 interferometry, Geo- phys. Res. Lett., 23, 989-992, 1996.
Triplet, J.P., and Roche, C., Mdte'orologie grindtale, 300 pp.,
M•t•ofrance, 1983.
Zebker, H. A., Rosen, P. A., and Hensley, S., Atmospheric
effects in interferometric synthetic aperture radar surface
deformation and topographic maps, J. Geophys. Res.,/02,
7547-7563, 1997.
C. Delacourt, P. Briole, Institut de Physique du Globe de Paris, 4 Place Jussieu, 75252 Paris Cedex 05, France
J.Achache, BRGM, Research Division, Ave. de Concyr, B.P.6009, 45060 Orleans C•dex 2, France
(received January 30, 1998; revised March 17, 1998; accepted June 2, 1998.)