HAL Id: hal-01654067
https://hal.archives-ouvertes.fr/hal-01654067
Submitted on 13 Dec 2017
HAL is a multi-disciplinary open access
archive for the deposit and dissemination of sci-entific research documents, whether they are pub-lished or not. The documents may come from teaching and research institutions in France or abroad, or from public or private research centers.
L’archive ouverte pluridisciplinaire HAL, est destinée au dépôt et à la diffusion de documents scientifiques de niveau recherche, publiés ou non, émanant des établissements d’enseignement et de recherche français ou étrangers, des laboratoires publics ou privés.
Is Rock-Eval 6 thermal analysis a good indicator of soil
organic carbon lability? – A method-comparison study
in forest soils
Laure Soucémarianadin, Lauric Cécillon, Claire Chenu, François Baudin,
Manuel Nicolas, Cyril Girardin, Pierre Barré
To cite this version:
Laure Soucémarianadin, Lauric Cécillon, Claire Chenu, François Baudin, Manuel Nicolas, et al.. Is Rock-Eval 6 thermal analysis a good indicator of soil organic carbon lability? – A method-comparison study in forest soils. Soil Biology and Biochemistry, Elsevier, 2018, 117, pp.108-116. �10.1016/j.soilbio.2017.10.025�. �hal-01654067�
Elsevier Editorial System(tm) for Soil Biology and Biochemistry
Manuscript Draft
Manuscript Number: SBB12198R2
Title: Is Rock-Eval 6 thermal analysis a good indicator of soil organic carbon lability? - A method-comparison study in forest soils
Article Type: Research Paper
Keywords: soil organic carbon kinetic pools; Rock-Eval 6; particulate organic matter; soil basal respiration; deep soil organic carbon; French forest soils
Corresponding Author: Dr. Laure Nalini Soucemarianadin, Ph.D. Corresponding Author's Institution: Ecole Nationale Supérieure First Author: Laure Nalini Soucemarianadin, Ph.D.
Order of Authors: Laure Nalini Soucemarianadin, Ph.D.; Lauric Cécillon, PhD; Claire Chenu, PhD; François Baudin, PhD; Manuel Nicolas, PhD; Cyril Girardin, PhD; Pierre Barré, PhD
Is Rock-Eval 6 thermal analysis a good indicator of soil organic carbon lability? – A method-1
comparison study in forest soils 2
3
Laure Soucémarianadina,*, Lauric Cécillonb, Claire Chenuc, François Baudind, Manuel 4
Nicolase, Cyril Girardinc and Pierre Barréa 5
6
a Laboratoire de Géologie, PSL Research University, CNRS-ENS UMR 8538, Ecole Normale
7
Supérieure, 24 rue Lhomond 75231 Paris CEDEX 5, France 8
b Université Grenoble Alpes, IRSTEA, 2 rue de la Papeterie, 38402 St-Martin-d'Hères, France
9
c AgroParisTech-INRA, UMR ECOSYS, Route de la ferme, 78850 Thiverval-Grignon,
10
France 11
d Sorbonne-Université/UPMC, ISTeP, 4 place Jussieu 75005 Paris, France
12
e Office National des Forêts, R&D, 77300 Fontainebleau, France
13
14
* corresponding author: Laure Soucémarianadin, [email protected]
15
16
Abstract
18
Soil respiration tests and abundance of particulate organic matter (POM) are considered as 19
classical indicators of the labile soil organic carbon (SOC) pool. However, there is still no 20
widely accepted standard method to assess SOC lability and the pertinence of these two time-21
consuming methods to characterize SOC turnover can be questioned. Alternate ways of 22
determining the labile SOC fraction are thus much needed. Thermal analyses, in particular 23
Rock-Eval 6 (RE6) analysis has shown promising results in the determination of SOC 24
biogeochemical stability. 25
Using a large set of samples (n = 99) of French forest soils representing contrasted 26
pedoclimatic conditions, including deep samples (up to 0.8 m depth), we compared three 27
different methods used for SOC lability assessment. We explored whether respired-C isolated 28
by a 10-week laboratory soil respiration test, POM-C isolated by a physical SOC fractionation 29
scheme (particle-size > 50 µm and d < 1.6 g·cm−3) and several RE6 parameters were 30
comparable and how they correlated. 31
As expected, respired-C (mg CO2-C·g−1 SOC) and POM-C (% of total SOC) fractions
32
strongly decreased with depth. RE6 parameters showed that SOC from deeper soil layers was 33
also thermally less labile, more oxidized and H-depleted. Indeed, SOC from deeper soil layers 34
had lower proportion of thermally labile SOC, higher T50_HC_PYR (temperature at which 50%
35
of the pyrolysable hydrocarbons were effectively pyrolyzed) and T50_CO2_OX (temperature at
36
which 50% of the CO2 gas had evolved during the oxidation phase), larger oxygen index, and
37
smaller hydrogen index. Surprisingly, the two classical indicators of the labile SOC pool 38
(respired-C and POM-C) were only marginally correlated (p = 0.051) and showed layer-39
specific correlations. Similarly, respired-C was poorly correlated to RE6 parameters. 40
Conversely, the POM-C fraction showed a strong negative correlation with T50_HC_PYR (ρ =
41
−0.73) and good correlations with other RE6 parameters. 42
Our study showed that RE6 parameters were good estimates of the POM-C fraction, which 43
represents a labile SOC pool with a residence time of ca. a couple decades that is meaningful 44
regarding SOC stock changes upon modifications in land management. RE6 thermal analysis 45
could therefore be a fast and cost-effective alternative to more time-consuming methods used 46
in SOC pool determination, and may be integrated into soil monitoring networks to provide 47
high-throughput information on SOC dynamics. 48
49
Keywords
: soil organic carbon kinetic pools; Rock-Eval 6; particulate organic matter; soil 50basal respiration; deep soil organic carbon; French forest soils; 51
52
1. Introduction
54
Soil organic matter (SOM) degradation has multiple consequences on major soil functions 55
like nutrients cycling, soil emissions of greenhouse gases and affects soil carbon sequestration 56
potential. In particular, the labile part of SOM (turnover < 20 years) is associated with 57
biological (microbial) activity and nutrient cycling (Haynes, 2005) and is very relevant to 58
these issues. 59
In that context, information on the temporal trajectories of SOC storage at a fine spatial 60
resolution, in the form of detailed mapping of SOC stock evolutions with time for different 61
land management scenarios, are required. SOC dynamics models are the logical candidates to 62
provide such information, but their predictive performance is not yet satisfying, and they 63
would benefit from an improved initialization using fine-scale information on SOC kinetic 64
pools (Luo et al., 2016). Soil monitoring networks have become more prominent in the last 65
twenty years. However, currently they can only provide information relative to the recent 66
temporal (decadal) evolution of total SOC stocks. To use the full potential of these networks 67
and measure the effects of climate and land-use changes on SOC stocks will require indicators 68
of the size of the different SOC pools. 69
Respiration measurements and particulate organic matter (POM) quantification obtained by 70
various methods of fractionation (particle size only / density only / density + particle-size) 71
(von Lützow et al., 2007) have been used for decades and are now classical estimates of the 72
labile SOC pool. 73
Laboratory incubations are run under optimum temperature and moisture conditions and use 74
the indigenous microflora. They thus represent a maximum potential rate of C mineralization 75
and an index of C availability in the system, integrating the physical, chemical, and 76
microbiological properties of the soil (Haynes, 2005). Incubations are fairly simple to set-up 77
but they require space and are time-consuming. Sieving and rewetting also tend to artificially 78
increase the mineralizable pool (Haynes, 1986). 79
Physical fractionation schemes are easy to implement and do not require expensive equipment 80
although they can become costly when density fractionation is involved. Moreover they are 81
very time-consuming, often requiring multiple and relatively long periods of agitation/settling 82
and drying. The most important limitation is the ability of the fractionation scheme to isolate 83
physical fractions that have homogeneous turnover and thus represent functional non-84
composite SOC pools (von Lützow et al., 2007). 85
While respired-C and POM-C fractions both represent a labile SOC pool, the former 86
corresponds to a smaller SOC pool with a shorter mean residence time (usually < 1 year for 87
temperate in-situ conditions) (Feng et al., 2016) while the latter corresponds to a larger SOC 88
pool with a longer mean residence time (usually < 20 year for temperate in-situ conditions) 89
(e.g., Trumbore et al., 1996; Balesdent, 1996). Because these two methods are both very time-90
consuming, they cannot address the needs of soil monitoring, i.e., a methodology that is 91
informative, high-yield and relatively cheap to implement, to allow for the analysis of 92
numerous samples. 93
Among thermal analyses used to characterize SOM, Rock-Eval 6 (RE6) analysis has shown 94
promising results in the determination of SOM biogeochemical stability (e.g., Barré et al., 95
2016) and thus appears like a good candidate to fill this methodological gap. Originally 96
developed for oil and gas exploration in sedimentary basins, the method was first applied to 97
study soils with hydrocarbons contamination (Lafargue et al., 1998). RE was also shown to 98
provide useful information on SOM originating from soil profiles worldwide (Disnar et al., 99
2003) and many studies on SOM characterization have been conducted, sometimes using RE 100
analysis in conjunction with other methods like nuclear magnetic resonance (Albrecht et al., 101
2015), hydrocarbon analysis by gas chromatography (Di-Giovanni et al., 1998), infrared 102
spectroscopy (Hetényi et al., 2006) or biochemical oxygen demand (Copard et al., 2006) to 103
determine the origin and/or decomposition stage of the organic matter (Hetényi et al., 2005; 104
Sebag et al., 2006). 105
More recently, RE6 results have been compared with respiration test or SOM fractions at the 106
plot (Gregorich et al., 2015) and the small landscape scale (Saenger et al., 2015) but in both 107
cases the analyses were restricted to superficial soil layers. Gillespie et al. (2014) have also 108
related thermal stability assessed by RE6 to respiration test and X-ray absorption near-edge 109
structure spectroscopy for cryosolic soil profiles (up to 75 cm) in Northern Canada but only in 110
four hummocks. Finally, RE6 thermal analysis has been used to look at SOM dynamics in a 111
sample set with a large soil type variability and some deeper horizons (Sebag et al., 2016), but 112
without comparison to other methodologies. 113
The objective of this study was to properly “benchmark” RE6 thermal analysis with two 114
classical yet time-consuming methods for labile SOC pool estimation: a soil respiration test 115
isolating a respired-C fraction under controlled laboratory conditions and a physical SOC 116
fractionation scheme isolating a POM-C fraction. We selected soil samples from the French 117
forests monitoring network RENECOFOR at various depths. To our knowledge, this is the 118
first study considering such a large set of samples (covering a wide pedoclimatic variability), 119
including deep soil layers up to 0.8 m. Our sample set thus included soil samples that 120
presumably contained very different proportions of the labile SOC pool. Because the 121
difference in size of the C pool estimated by the respiration test and the POM fractionation 122
(e.g., Haynes, 2005) and the previously observed correlations between stock of labile SOC 123
estimated by RE6 parameters and the POM fraction (Saenger et al., 2015) on one hand and 124
between cumulative C mineralized and a RE6 parameter (Gregorich et al., 2015) on the other 125
hand, we were expecting that: 1/ the results provided by the two classical methods would 126
differ quantitatively while the results from the three methods would be qualitatively 127
comparable and correlated; 2/ we would be able to derive a significant quantitative 128
relationship between RE6 parameters and the two classical indicators of the labile SOC pool. 129
130
2. Material and methods
131
2.1. Sampling 132
We considered forest soils samples from 53 permanent forest sites of the French national 133
network for the long term monitoring of forest ecosystems (‘‘RENECOFOR’’), established in 134
1992 (Ulrich, 1995) by the National Forest Service (ONF; http://www.onf.fr/renecofor) as a 135
part of the European ICP-FORESTS (http://icp-forests.net/) level 2 network (Fig. 1a). They 136
were representative of a good portion the national variability in terms of climate (with MAP 137
and MAT ranging between 703–1894 mm and 4.8–12.3 °C respectively for the 1971–2000 138
period), soil type (entic Podzol; eutric Cambisol/Calcisol; dystric Cambisol) (IUSS Working 139
Group, 2015) and forest vegetation (coniferous—silver fir; Norway spruce; European larch; 140
Scots pine—and deciduous—beech; oaks spp—stands). At each site, samples representing 141
two soil layers were obtained (0–10 cm and 40–80 cm; Fig. 1b). Samples of the top soil layer 142
were composite, at each depth, of 5 × 5 sampling points located over a 5000 m2 plot, collected 143
between 2007 and 2012 by digging a 50 cm wide soil profile (Ponette et al., 1997; Jonard et 144
al., 2017). Samples of the deeper soil layer were composite from two soil pits located just 145
outside the central plot and collected in 1994–1995 (Brêthes et al., 1997). The surface and 146
deep samples thus originate from two different sampling campaigns. The deep samples were 147
only collected once, during the first campaign, to limit perturbation on the monitoring plots. 148
Basic soil parameters (pH and texture) were determined by Ponette et al. (1997) and are 149
reported as supplementary information (Table SI-A1). 150
Bulk soils were air-dried and stored in plastic buckets right after sampling. One liter of soil of 151
153
2.2. Elemental analysis 154
Bulk < 2 mm-sieved soil samples were ground (< 250 µm; ultra-centrifugal mill ZM 200, 155
Retsch Gmbh) and organic carbon and total nitrogen concentrations were determined by dry 156
combustion with an elemental analyzer (CHN NA 1500, Carlo Elba). Samples with 157
carbonates (total CaCO3 = 3.5–835 g·kg−1) were first decarbonated following the same
158
protocol as Harris et al. (2001). Briefly, 30 mg of ground samples were weighed in 5 mm × 9 159
mm silver boats followed by the addition of 50 μL of distilled water. The boats were put in a 160
glass bell jar, next to a beaker containing 100 mL of concentrated HCl (12 mol·L−1). The air 161
in the jar was evacuated and samples let to sit in this HCl-saturated atmosphere to allow the 162
acid to dissolve water and hydrolyze the carbonates for 8 h. Then, the decarbonated samples 163
were dried at 60 °C in the silver boats for at least 48 h. Silver boats were further placed in 10 164
mm × 10 mm tin boats and analyzed for C and N. 165
POM fractions (see section 2.4.) were ground with a ball mill (mixer mill MM 200, Retsch 166
Gmbh) or a mortar and pestle when the sample mass was less than 0.05 g. Carbon 167
concentration was determined as for the bulk soil. 168
169
2.3. Respiration test 170
For each sample, 20 g of 2 mm-sieved soil were transferred in a 120 mL glass-flask and re-171
wetted at pF 2.5 (−0.033 MPa), which had been previously determined using a 5 Bar pressure 172
plate extractor (#1600, Soilmoisture Equipment Corp.). The flasks were fitted with aluminum 173
seals with PTFE-faced silicone septa to allow for headspace gas sampling and placed inside 174
an incubator (AE240 BIO EXPERT, Froilabo SAS) kept at 20 °C for 10 weeks following a 175
two-week period pre-incubation to allow the samples microbial activity to stabilize (data not 176
included). 177
Headspace gases were sampled at 1 to 2-week intervals during the 10-week incubation period 178
and CO2 concentrations were determined using an Agilent 490 micro-gas chromatograph
179
equipped with the OpenLAB Chromatography Data System EZChrom software. 180
When CO2 concentrations had reached 2.5–3% or was expecting to do so before the next
181
measurement, and/or when the cap had been pierced with the needle four times, flasks were 182
opened and flushed with fresh and moist air to return CO2 concentrations to ambient levels to
183
avoid anoxia (while maintaining the moisture content), before returning them to the incubator. 184
The CO2 concentrations measured by the GC were converted in µ CO2-C·using equation 1:
185
µg C-CO2 = mmol air × ppm CO2 (µmol C/ mol air) × 10−3 (mol/mmol) × 12 (µg C / µmol C)
186
(equation 1) 187
where “mmol air” corresponds to the millimoles of air present in the flask and was calculated 188
with the ideal gas law (equation 2): 189
n = PV / RT = (1 × 100) / (82.05 × 293) (equation 2) 190
As a result, we multiplied our concentrations of CO2 expressed in percent by 499.16 to
191
convert them in µg C-CO2.
192
Finally, the 10-week mineralizable SOC (respired-C) was expressed in mg CO2-C·g−1 SOC to
193
account for differences in the C content of the various layers and sites. 194
195
2.4. Particle size and density SOC fractionation 196
To isolate the particulate organic matter (POM) fraction, samples were first dried at 50 °C for 197
24 h before weighing 25 g and transferred them in polyethylene (PE) 250 mL flasks. We then 198
added 180 mL of 0.5% sodium hexametaphosphate solution and ten 5 mm-diameter glass 199
beads before shaking the samples overnight (50 rpm; 16 h) on an overhead shaker (Reax 2, 200
Heidolph), in order to breakdown soil aggregates. Samples were thoroughly rinsed over a 50-201
µm mesh with deionized water. The > 50 µm fraction was then transferred back to a dry PE 202
flask with a sodium polytungstate (SPT) solution of density = 1.6 0.03 g·cm−3 (Golchin et
203
al., 1994; Crow et al., 2007) and the solution was added up to circa 180 mL. The flasks were 204
shaken overhead by hand 10 times and samples were left overnight to settle down after the 205
cap of the flask was rinsed with the SPT solution. The floating material was collected with a 206
spatula and placed over a 50-µm mesh sieve. If necessary some SPT solution was added back 207
to the flask and the previous step was repeated. This time, samples were placed in a centrifuge 208
for 30 minutes to accelerate the separation (2750 rpm or 1250 g, Six et al., 1998). The floating 209
material was again collected with the spatula or pipetted depending on the amount left. This 210
step was repeated if the light fraction was abundant. If not, samples were left to settle down 211
overnight before one last collection. The POM fraction on the sieve was thoroughly rinsed 212
with deionized water throughout the whole process. The sieves and fractions were then placed 213
in the oven at 50 °C for 24 h before being weighed. To account for differences in the C 214
content of the different samples, we calculated the proportion of OC in the POM fraction 215
(POM-C), expressed in g POM-C·g−1 total SOC. 216
217
2.5. Thermal analysis: Rock-Eval 6 218
The thermal analysis of the samples was performed with a Rock-Eval 6 turbo device (Vinci 219
Technologies, France). Details about the equipment have been previously published (Behar et 220
al., 2001). We adapted the procedure developed for the analysis of soil organic matter by 221
Disnar et al. (2003). Briefly, about 60 (20.7–62.1 depending on the sample’s C content) mg of 222
ground sample were exposed to two consecutive thermal treatments, first in a pyrolysis oven 223
(200–650 °C; thermal ramping rate of 30 °C·min−1; under N2 atmosphere) then in a
224
combustion oven (300–850 °C; thermal ramping rate of 20 °C·min−1; under laboratory air
225
atmosphere). At the beginning of the pyrolysis, there was an isothermal step (at 200 °C) 226
during 180 seconds during which the free hydrocarbons (HC) were thermovaporized (S1 227
peak). The pyrolysis effluents (mostly HC) were detected and quantified with flame ionization 228
detection, while CO and CO2 were quantified by infrared detection during both the pyrolysis
229
and oxidation stages (Fig. SI-A1). 230
Two standard RE6 parameters describing SOC bulk chemistry were determined: the hydrogen 231
and oxygen index values (HI and OIRE6). The HI index corresponds to the amount of
232
hydrocarbons formed during thermal pyrolysis of the sample (HC evolved between 200 and 233
650 °C minus the S1 peak) divided by the total SOC content of the sample and is expressed in 234
mg HC·g−1 SOC. It describes the relative enrichment/depletion of SOC in hydrogen-rich 235
moieties. The OIRE6 index describes the relative oxidation status of SOC. It was calculated
236
using the equation proposed by Lafargue et al. (1998): 237
OIRE6 = 16 / 28 × OICO + 32 / 44 × OICO2 (equation 3)
238
Where OICO2 corresponds to the CO2 yielded during thermal pyrolysis of the sample between
239
200 and 400°C divided by the total SOC of the sample and OICO corresponds to the CO
240
yielded during thermal pyrolysis between 200 and 400–650°C (wherever a minimum of CO 241
production is observed; in the absence of a minimum, the default upper-limit temperature is 242
set at 550 °C) divided by the total SOC of the sample. Thus OIRE6 is expressed in mg O2·g−1
243
SOC. 244
We derived four additional RE6 parameters describing the thermal stability of SOC: (i) 245
T50_HC_PYR, the temperature at which 50% of the HC resulting from the SOM pyrolysis had
246
evolved (ii) the T50_CO2_OX, the temperature at which 50% of the residual SOM was oxidized
247
to CO2 during the oxidation phase. Because the signal was noisy at the beginning of the
248
pyrolysis, we started the integration for T50_HC_PYR right after the S1 peak. For T50_CO2_OX, the
249
upper limit temperature for signal integration was set at 611 °C to obtain a total CO2 signal
250
evolved from pure OM without interference of carbonates. Both these T50 temperature
251
parameters and the HI index have been previously shown as good thermal indicators of SOM 252
biogeochemical stability (Gregorich et al., 2015; Barré et al., 2016). We also included two 253
thermal indices previously used in the literature: the (iii) R-index or (1 − R400), which 254
correspond to the integrated area of the HC thermogram above 400 °C over the total area of 255
the HC signal (Disnar et al., 2003; Sebag et al., 2016). The R-index estimates the proportion 256
of thermally stable SOC pool and varies between 0 and 1. We hypothesized that the 257
proportion (1 – R-index) would approximate a thermally labile/intermediate (turnover < 20 258
years) SOC pool. Finally, using equation 4, we calculated the (iv) I-index, which is an 259
indicator of the preservation of thermally labile immature SOM (Sebag et al., 2016): 260
log10((A1 + A2) / A3) (equation 4)
261
where A1 + A2 corresponds to the integrated area of the HC thermogram below 400 °C and 262
A3 the integrated area of the HC thermogram between 400 °C and 460 °C. 263
Signal processing of the RE6 thermograms (signal integration and calculation of the 264
T50_HC_PYR, T50_CO2_OX, R and I indices) was performed with the R environment software v.3.3
265
(R Core Team, 2016) using the hyperSpec (Beleites and Sergo, 2015) and pracma (Borchers, 266
2015) R packages. 267
268
2.6. Calculations and statistical analyses 269
For RE6 analysis and the respiration test, samples with very low C content (< 0.2%) were not 270
considered as the carbon flux they produced during the incubation or the thermal analysis was 271
too low/too close to the limit of detection for reliable determination. This resulted in the 272
selection of n = 46 for the soil layer 40–80 cm (total n = 99). 273
The mean values of the variables derived from the SOC respiration test, fractionation and RE6 274
analysis for all layer depths were compared using standard non-parametric statistical methods 275
such as Kruskal Wallis test one-way ANOVA by ranks and Wilcoxon signed-rank test. 276
Relationships between the variables derived from the three methods were estimated using 277
Spearman rank correlation as the data did not meet the assumption of normality. Correlation 278
tests were first performed on the whole dataset (n = 99) then within the 0–10 cm and the 40– 279
80 cm layers, the three soil types and the two vegetation types individually. All comparisons 280
were considered significant at an alpha value () of 0.05. A principal component of analysis 281
(PCA) was performed to detect linear relations between parameters derived from the 3 282
methods. For that purpose, data were log-transformed, centered and scaled. Because the I-283
index was negative in some instances, we added the equivalent of the smallest I-index value + 284
0.2 to all the I-index values to run the PCA. To determine the number of principal 285
components to select, we looked at the percentage of the total variance explained and used a 286
scree plot and Kaiser’s criterion. To analyze the relationship between RE-based and the two 287
classical indicators of the labile SOC pool, we used a simple linear regression model and 288
relied on the Cook’s distance to identify potential outliers. All statistical analyses were 289
performed using R 3.3 (R Core Team, 2016) using the factoextra (Kassambara and Mundt, 290
2016) and Hmisc (Harrell et al., 2016) packages. 291 292
3. Results
293 3.1. Respiration test 294The 10-week mineralizable SOC (respired-C) was expressed in mg CO2-C·g−1 SOC to
295
account for differences in the C content of the various layers and sites. Over the course of the 296
10-week incubation, the surface layer (0–10 cm) samples cumulatively respired on average 17 297
7.2 mg CO2-C·g−1 SOC, while the deeper layer (40–80 cm) samples respired 13.4 6.9 mg
298
CO2-C·g−1 SOC (Table 1). There was a significant decrease in respired-C with depth (p =
299
0.003), indicating a smaller size of the labile C pool in the deeper layers of our forest soils. 300
Within each soil layer, the large standard deviation (around 7.0 mg CO2-C·g−1 SOC)
303
3.2. POM fractionation 304
The POM-C fraction (% of total C) decreased by half between layers 0–10 cm and 40–80 cm 305
with 22.6 7.3% and 11.0 6.1% respectively. This indicates a significantly (p < 0.001) 306
smaller labile C pool in the deeper (40–80 cm) soil layer. POM-C ranged between 12.1– 307
43.0% and 2.5–33.6% in the 0–10 cm and 40–80 cm layers, respectively, illustrating again an 308
important inter-site variability. 309
310
3.3. RE6 thermal analysis 311
There was a significant effect of depth on all RE6 parameters. Particularly, the two T50
312
parameters increased significantly (p < 0.001) with depth: 421 9 °C to 448 10 °C and 399 313
9 °C to 431 18 °C (Table 1), for T50_HC_PYR and T50_CO2_OX respectively, corresponding to
314
an increase in the thermal stability of total SOC (i.e. a relative decrease in the labile C pool 315
and increase of the stable C pool). OIRE6 showed a similar increasing trend (p < 0.001) with
316
depth (225 37–439 138 mg O2·g−1 total SOC; Table 1), reflecting a more oxidized SOC in
317
the deeper layers. Conversely, HI decreased significantly (p < 0.001) with depth (276 77– 318
133 34 mg HC·g−1 total SOC; Table 1), suggesting a relative depletion of total SOC in
H-319
rich moieties with increased soil depth. The proportion of thermally stable SOC R-index, also 320
experienced a significant increase (p < 0.001) with depth (59–69%; Table 1), while the I-321
index decreased slightly (0.17–0.11; Table 1). 322
323
3.4. Correlations between methods 324
3.4.1. For all samples 325
There were mainly significant and strong correlations between POM-C and the RE6 326
parameters (Table 2). Notably T50_HC_PYR, OIRE6 and R-index all had a strong negative
correlation with POM-C (Spearman ρ = −0.73, −0.76 and −0.69 respectively; Table 2; Fig. 3). 328
T50_CO2_OX and HI moderately correlated with POM-C (ρ = −0.56 and 0.67) and the I-index
329
had a weak positive relationship with POM-C (ρ = 0.35). I-index, T50_HC_PYR and R-index
330
were the only parameters that were significantly related to respired-C, with a weak correlation 331
(ρ = 0.32, ρ = −0.26 and −0.31 respectively; Table 2). The two classical methods of 332
estimation of labile SOC (respired-C and POM-C) were weakly positively (ρ = 0.20; Table 2; 333
Fig. SI-B1 a) and indeed only marginally (p = 0.051) related. 334
To describe the similarity or dissimilarity in the different indicators of SOC lability, we 335
conducted a principal components analysis (PCA). As shown by the correlation test, T50
336
_HC_PYR and R-index on the one hand and OIRE6 and HI on the other hand were highly
337
correlated (ρ = 0.93 and −0.92 respectively; Table 2). We thus decided to conduct the PCA 338
using only the 6 following explanatory variables = respired-C; POM-C; HI; T50_CO2_OX; T50
339
_HC_PYR; I-index). The first two principal components (PC) explained approximately 73% of
340
the total variance, with 53% explained by the first and 20% explained by the second PC, 341
respectively (Fig. 2). PC1 clearly separated surface (0–10 cm) from deeper (40–80 cm) soil 342
samples. Along PC1, POM-C and HI showed moderate negative loadings (−0.47 and −0.46 343
respectively; Table SI-B1) while T50_HC_PYR and T50_CO2_OX had moderate positive loadings
344
(0.53 and 0.45; Table SI-B1). Respired-C and the I-index showed strong positive loadings 345
along PC2 (0.55 and 0.69; Table SI-B1), while they showed very weak negative loadings 346
along PC1. Samples from layers 0−10 and 40−80 cm did not significantly differ along the 347
second PC. 348
349
3.4.2. For the 0–10 cm and 40–80 cm layer separately 350
These global correlations prompted us into looking at the influence of soil depth on the 351
different parameters. The paired correlations between the 8 parameters differed in surface (0– 352
10 cm) and deep (40–80 cm) layers (Table 2). Specifically, the respired-C in the surface 353
layers was weakly and negatively related to POM-C (ρ = −0.29; Table 2). Conversely in the 354
deep layers, respired-C and POM-C were moderately and positively correlated, as it would be 355
expected (ρ = 0.47; Table 2; Fig. SI-B1 a). In the surface layers, HI and OIRE6 were also
356
moderately (negatively and positively, respectively; Table 2) correlated to respired-C, while 357
in the deep layers we observed again this negative and moderate correlation between 358
T50_HC_PYR and respired-C. For POM-C, we found the same negative correlations with
359
T50_HC_PYR and OIRE6 as in the “all samples” comparison but they were less strong (ρ = −0.35
360
to −0.42; Table 2). In the surface layer, the C/N ratio, pH and clay content had all moderate 361
and significant correlations with respired-C and T50_HC_PYR (Table 2). These correlations were
362
absent in the 40–80 cm layer. 363
We also looked at the evolutions of the correlations as a function of vegetation and soil types, 364
but there were no change as drastic as the ones we observed with depth (Table SI-C1). In both 365
cases the changes affected only the correlations between respired-C and the other parameters. 366
For instance, in coniferous plots, respired-C was weakly to moderately positively correlated to 367
clay content (ρ = 0.27) and pH (0.37) while those correlations were absent in deciduous plots 368
(Table SI-C1). For the soil types, POM-C and respired-C were moderately and positively 369
correlated in Podzols (0.42) and eutric Cambisols (0.46) but not in dystric Cambisols. 370
Furthermore, in eutric Cambisols, respired-C was moderately and negatively correlated with 371
T50_CO2_OX (−0.54), R-index (−0.50) and pH (−0.57; Table SI-C1).
372
373
4. Discussion
374
4.1. Relationships between respiration test and POM fractionation 375
Unexpectedly the two classical indicators of the labile SOC fraction correlated only weakly 376
and marginally when considering all our samples. 377
POM-C is considered as a labile SOC fraction (Wander, 2004; Haynes, 2005; von Lützow et 378
al., 2007), and we thus expected it would correlate significantly and strongly with the 379
respired-C fraction isolated by the 10-week laboratory respiration test. Indeed, in his review, 380
Haynes (2005) mentioned several studies reporting a positive and usually strong correlation 381
between the respired-C and the POM-C fractions, appearing to support that hypothesis. 382
However when carefully considering these papers (Janzen et al., 1992; Hassink, 1995; 383
Campbell et al., 1999a; Campbell et al., 1999b; Wander and Bidart, 2000) and others (Liang 384
et al., 2003; Hassan et al., 2016; Li et al., 2016), it emerged that the presented data were not 385
normalized by the total SOC concentration of the samples. Without normalization it could be 386
argued that the positive correlation between the POM-C and the respired-C fractions was in 387
fact driven by variations in total SOC concentration and not SOC biogeochemical stability. It 388
also prevented comparisons among studies, given the important difference in SOC 389
concentration. 390
The hypothesis of a positive correlation between the sizes of the labile SOC pool estimated by 391
respiration test and POM fractionation schemes has actually not been properly tested on 392
multiple sites, using SOC normalized data as it has been done in the present study. Indeed, the 393
few studies that have reported moderate to strong positive correlations between the sizes of 394
the labile SOC pool estimated by respiration test and POM fractionation were conducted on 395
similar soils under different management (e.g., Alvarez and Alvarez, 2000) or correlations 396
were made within sites (e.g., Janzen et al., 1992). When combining results from all sites, the 397
correlation appeared to be weaker and it can therefore be hypothesized that in our study the 398
weak and marginally significant correlation between POM-C and respired-C was partially due 399
to the large inter-sites variability of soil properties for our sample set (Table SI-A.1). 400
Finally, the labile SOC pools estimated by the two classical methods were so different in size 401
(i.e. the labile SOC pool estimated as respired-C was about an order of magnitude smaller 402
than the one estimated as POM-C; Table 1) that it is not surprising that the correlation did not 403
hold specifically when introducing a lot of inter-sites variability. This constitutes another 404
explanation to the lack of correlation between these two indicators of the size of the labile C 405
pool. The two methods appeared to measure different SOC fractions (i.e. different sizes) 406
(Table 2 and Fig. 2) that correspond to different SOC lability (i.e. mean residence time). 407
408
4.2. Relationships between RE6 parameters and POM-C and respired-C 409
Our RE6 results agreed with previous observations of thermal indicators of SOC lability. For 410
instance, Sebag et al. (2016) reported a trend of decreasing HI and increasing OIRE6 with soil
411
depth. Trends of decreasing HI and increasing T50_CO2_OX were observed with increasing time
412
since beginning of bare fallow experiments, which corresponded with a progressive 413
decomposition of the labile SOC pool (Barré et al., 2016). 414
Our correlations between the RE6 parameters and the POM-C fraction were close to those 415
previously reported by Saenger et al. (2015). They indeed obtained a moderate positive 416
correlation (R2 = 0.50) between the labile SOC pool stocks derived from a SOC fractionation 417
scheme isolating POM-C, and the thermally labile SOC pool stocks derived from RE6 418
indices. We found a similar strong positive correlation between the proportion of labile SOC 419
(1−R-index) and POM-C. The strong relationship between T50_HC_PYR and R-index could
420
likely be explained as T50_HC_PYR for our samples were very close to the 400 °C threshold used
421
for the calculation of the R-index. As hypothesized we were able to derive a quantitative 422
relationship between some of our RE6 parameters and POM-C (Fig. SI-B1 b–d). The best 423
model was obtained for T50_HC_PYR (R2 = 0.52; Fig. 3), while HI, R-index and OIRE6 were still
424
moderately good predictors of POM-C (R² = 0.42–0.47 (Fig. SI-B1 b–d). 425
Nevertheless no strong relationship between respired-C and the other parameters could be 426
established. Our correlations between the RE6 parameters and respired-C were smaller than 427
those previously reported by Gregorich et al. (2015). This could be explained by the fact that 428
their study was, by design, very restricted in terms of its soil properties variability and also 429
only considered surface soils (0–10 cm), in which the C/N ratios were around 10. 430
Previous studies have also demonstrated that RE6 can be used to look at changes in the size of 431
the SOC labile pools with time. For instance, RE6 was able to describe the decrease in the 432
labile SOC pool in long-term bare fallows (Barré et al., 2016). Besides, RE6 captured 433
differences in the size of the labile SOC pools in various land-uses and soil types over a small 434
landscape (Saenger et al., 2015). Our results thus contradict the conclusions from Schiedung 435
et al. (2017) who found no relationship between the thermally labile SOC (200–400 °C) and 436
the C in the POM fractions. The latter (free and occluded POM—obtained by sonication) 437
were indeed more stable at lower oxidation temperatures (300–350 °C) than the mineral-438
associated fraction. However, their analytical method was different from RE6 protocols: the 439
thermal analysis they used was entirely realized under aerobic conditions (oxidation only), 440
their temperature range was limited (only up to 400 °C) and they used a 50–100 °C 441
temperature step every 15 minutes rather than a constant thermal ramping rate (standard in 442
most thermal studies). For all these reasons, it is likely that their thermal indices differ greatly 443
from our RE6-derived parameters. Moreover their study was based on topsoils (0–10 cm) of 444
only three study sites. 445
The good approximation of the POM-C fraction by RE6 we reported constitutes a very 446
promising result. POM-C mean residence time (< 20 years in temperate conditions in the 447
absence of an important charcoals contribution; e.g., Trumbore and Zheng, 1996; Balesdent, 448
1996; Balesdent et al., 1998; Baisden et al., 2002; Schrumpf and Kaiser, 2015) and its size (11 449
to 23% of total SOC in this study) are much larger than the one of the respired-C fraction, and 450
is thus more meaningful regarding SOC stock evolutions upon changes of land management. 451
This suggests that RE6 could be used to determine the size of the labile SOC pool with a 452
decadal mean residence time. 453
454
4.3. Effects of depth on correlations between the three methods estimating labile SOC 455
Labile SOC content usually decreases with depth (e.g., Lorenz and Lal, 2005; Jenkinson et al., 456
2008). Such a trend was observed with the three methods used in the present study. Indeed, 457
with depth, we observed a decrease in respired-C (respiration test), POM-C (POM 458
fractionation) and HI alongside with an increase in T50_HC_PYR and R-index that all signified
459
the expected decrease in the size the labile SOC pool. Concurrently, OIRE6 increased with
460
depth, confirming the increase in SOC oxidative state with increasing decomposition 461
(Hockaday et al., 2009; von Lützow and Kögel-Knabner, 2010; Hockaday et al., 2015). 462
But more importantly, depth affected the correlations between the methods. The lack of 463
correlation between two classical indicators of the labile SOC fraction previously mentioned 464
appeared to originate from opposite trends in the surface and deep layers. In the 0–10 cm 465
layer we observed a surprising negative (but weak) correlation between respired-C and POM-466
C while the expected positive and moderate correlation between the two indicators was found 467
only in the deep layers. The differences in the sign of the correlations between respired-C and 468
POM-C in the two considered layers (0–10 cm and 40–80 cm) may be related to pedological 469
factors that can limit SOC mineralization in surface horizons. Indeed, the high C/N ratio 470
found in the surface layer (Table SI-A1) is far from the expected C/N of the microorganisms 471
and this lack of N may limit SOC respiration. Similarly, surface layers are on average more 472
acidic (Table SI-A1) than deep layers which can also reduce SOC respiration. We could 473
hypothesize that respired-C and POM-C correlate only when environmental conditions do not 474
limit SOC mineralization explaining the absence of correlation in the acidic N-poor 0–10 cm 475
layer. The significant correlations observed between respired-C and the C/N ratio, pH and the 476
clay content in the surface layer (Table 2) supports that hypothesis. This opposite behavior in 477
the two layers also affected T50_HC_PYR, which was not significantly correlated to respired-C in
478
the surface layer while the two parameters were moderately and negatively correlated in the 479
40–80 cm layer (Table 2). These observations matched those from Peltre et al. (2013) who 480
reported conflicting relationships between the parameter DSC-T50 (temperature at which half 481
of the energy is released in differential scanning calorimetry) and mean soil respiration rates 482
in two sets of high and low SOC content. Their DSC-T50 values were indeed negatively 483
correlated with the respiration values for the low-C soils, whereas there was only a marginal 484
positive correlation between the two parameters for the high-C soils. Their two groups were 485
characterized by soil properties similar to our 0–10 and 40–80 cm layers: their low-C set 486
consisted of samples with a higher pH and lower mean C/N ratio than those of the high-C. 487
Similarly to our 0–10 cm samples, soils in their high-C set had a greater C concentration than 488
those in the low-C set for similar clay contents (Table SI-A1). This would also explain why 489
our results differ from those of Gregorich et al. (2015). In the deep layer, in which the C/N 490
ratios are closer to those reported by Gregorich et al. (2015), we observed the same positive 491
correlation they reported albeit less strong. 492
Vegetation and soil types did not seem to have affected the correlations between the three 493
methods we tested as much as depth did. However, these environmental factors are likely 494
drivers of the size labile SOC pool as they have been shown to significantly influence RE6 495
parameters (e.g., Disnar et al., 2003; Sebag et al., 2006). 496
497
4.4. Towards high-throughput information on SOC biogeochemical stability using RE6 498
analysis 499
Respiration tests and POM fractionation schemes are both time consuming, thus limiting the 500
number of samples and/or replicates that are analyzed. With the RE6 set-up used in this study, 501
about 20 samples per day can be analyzed, and it requires only limited operator interventions 502
(soil weighing and routine supervision of the RE6 analyzer). 503
The lack of normalization in many studies using respiration tests and POM fractionation is an 504
important issue and it should be recommended for further studies to include normalized data 505
(% of TOC) when presenting their results. Moreover, despite the fact that POM-C and 506
respired-C are considered as standard estimates of the labile SOC pool, the temperature and/or 507
duration of incubations often varied from one study to the other. Similarly for the POM-C 508
fraction, the density of the solution used for the flotation may drastically differ among studies. 509
This makes data comparison almost impossible. In that regard, while the harmonization of 510
RE6 programs would probably be much easier to implement than respiration tests or POM 511
fractionation protocols as the number of users is still limited, protocol standardization is an 512
important and pressing goal to achieve and this rather quickly as the method starts to gain 513
interest. 514
RE6 analysis is thus a rapid technique that captures differences in the labile SOC pool as well 515
as other classical techniques. While the understanding of the underlying processes linking 516
SOC thermal stability observed with RE6 and the laboratory or in-situ biogeochemical 517
stability of SOC is not fully uncovered and further studies are needed, RE6 analysis appears 518
like a very promising method to provide quick and inexpensive information on the labile SOC 519
pool. Hence, it could constitute a standard method to complement C stock measurements in 520
soil monitoring programs. 521
522
523
Acknowledgments
524
This work was supported by the Agence de l’environnement et de la maîtrise de l’énergie 525
(ADEME) [APR REACCTIF, piCaSo project] and Campus France [PRESTIGE-2015-3-526
0008]. We thank M. Bryant, S. Cecchini, L. Le Vagueresse, J. Mériguet and F. Savignac and 527
for their technical support. The authors acknowledge two anonymous reviewers for their time 528
and valuable comments on the manuscript. 529
530
531
Reference list
532
Albrecht, R., Sebag, D., Verrecchia, E., 2015. Organic matter decomposition: Bridging the 533
gap between Rock-Eval pyrolysis and chemical characterization (CPMAS 13C NMR). 534
Biogeochemistry 122, 101–111. 535
Alvarez, R., Alvarez, C.R., 2000. Soil organic matter pools and their associations with carbon 536
mineralization kinetics. Soil Science Society of America Journal 64, 184–189. 537
Baisden, W.T., Amundson, R., Cook, A.C., Brenner, D.L., 2002. Turnover and storage of C 538
and N in five density fractions from California annual grassland surface soils. Global 539
Biogeochemical Cycles 16, 64-61; 64–16. 540
Balesdent, J., 1996. The significance of organic separates to carbon dynamics and its 541
modelling in some cultivated soils. European Journal of Soil Science 47, 485–494. 542
Balesdent, J., Besnard, E., Arrouays, D., Chenu, C., 1998. The dynamics of carbon in particle-543
size fractions of soil in a forest-cultivation sequence. Plant and Soil 201, 49–57. 544
Barré, P., Plante, A.F., Cécillon, L., Lutfalla, S., Baudin, F., Christensen, B.T., Eglin, T., 545
Fernandez, J.M., Houot, S., Kätterer, T., Le Guillou, C., Macdonald, A., van Oort, F., 546
Chenu, C., 2016. The energetic and chemical signatures of persistent soil organic matter. 547
Biogeochemistry 130, 1–12. 548
Behar, F., Beaumont, V., Penteado, D.B., 2001. Rock-Eval 6 technology: Performances and 549
developments. Oil & Gas Science and Technology - Rev.IFP 56, 111–134. 550
Beleites, C., Sergo, V., 2015. hyperSpec: A Package to Handle Hyperspectral Data Sets in R. 551
Borchers, H.W., 2015. Pracma: Practical numerical math functions. 552
Brêthes, A., Ulrich, E., Lanier, M., 1997. RENECOFOR : Caractéristiques Pédologiques Des 553
102 Peuplements Du Réseau : Observations De 1994/95. Office national des forêts, 554
Département des recherches techniques, Fontainebleau, France, 573 pp. 555
Campbell, C.A., Biederbeck, V.O., Wen, G., Zentner, R.P., Schoenau, J., Hahn, D., 1999a. 556
Seasonal trends in selected soil biochemical attributes: Effects of crop rotation in the 557
semiarid prairie. Canadian Journal of Soil Science 79, 73–84. 558
Campbell, C.A., Lafond, G.P., Biederbeck, V.O., Wen, G., Schoenau, J., Hahn, D., 1999b. 559
Seasonal trends in soil biochemical attributes: Effects of crop management on a black 560
chernozem. Canadian Journal of Soil Science 79, 85–97. 561
Copard, Y., Di-Giovanni, C., Martaud, T., Albéric, P., Olivier, J., 2006. Using Rock-Eval 6 562
pyrolysis for tracking fossil organic carbon in modern environments: Implications for the 563
roles of erosion and weathering. Earth Surface Processes and Landforms 31, 135–153. 564
Crow, S.E., Swanston, C.W., Lajtha, K., Brooks, J.R., Keirstead, H., 2007. Density 565
fractionation of forest soils: Methodological questions and interpretation of incubation 566
results and turnover time in an ecosystem context. Biogeochemistry 85, 69–90. 567
Di-Giovanni, C., Disnar, J.R., Bichet, V., Campy, M., Guillet, B., 1998. Geochemical 568
characterization of soil organic matter and variability of a postglacial detrital organic supply 569
(Chaillexon lake, France). Earth Surface Processes and Landforms 23, 1057–1069. 570
Disnar, J.-R., Guillet, B., Keravis, D., Di-Giovanni, C., Sebag, D., 2003. Soil organic matter 571
(SOM) characterization by Rock-Eval pyrolysis: Scope and limitations. Organic 572
Geochemistry 34, 327–343. 573
Feng, W., Shi, Z., Jiang, J., Xia, J., Liang, J., Zhou, J., Luo, Y., 2016. Methodological 574
uncertainty in estimating carbon turnover times of soil fractions. Soil Biology and 575
Biochemistry 100, 118–124. 576
Gillespie, A.W., Sanei, H., Diochon, A., Ellert, B.H., Regier, T.Z., Chevrier, D., Dynes, J.J., 577
Tarnocai, C., Gregorich, E.G., 2014. Perennially and annually frozen soil carbon differ in 578
their susceptibility to decomposition: Analysis of subarctic earth hummocks by bioassay, 579
XANES and pyrolysis. Soil Biology and Biochemistry 68, 106–116. 580
Golchin, A., Oades, J.M., Skjemstad, J.O., Clarke, P., 1994. Study of free and occluded 581
particulate organic matter in soils by solid state 13C CP/MAS NMR spectroscopy and 582
scanning electron microscopy. Australian Journal of Soil Research 32, 285–309. 583
Gregorich, E.G., Gillespie, A.W., Beare, M.H., Curtin, D., Sanei, H., Yanni, S.F., 2015. 584
Evaluating biodegradability of soil organic matter by its thermal stability and chemical 585
composition. Soil Biology and Biochemistry 91, 182–191. 586
Harrell, F.E.J., Dupont, C., and others, 2016. Hmisc: Harrell miscellaneous. 587
Harris, D., Horwáth, W.R., van Kessel, C., 2001. Acid fumigation of soils to remove 588
carbonates prior to total organic carbon or CARBON-13 isotopic analysis. Soil Science 589
Society of America Journal 65, 1853–1856. 590
Hassan, W., Bashir, S., Ahmed, N., Tanveer, M., Shah, A.N., Bano, R., David, J., 2016. 591
Labile organic carbon fractions, regulator of CO2 emission: Effect of plant residues and
592
water regimes. CLEAN - Soil, Air, Water 44, 1358–1367. 593
Hassink, J., 1995. Density fractions of soil macroorganic matter and microbial biomass as 594
predictors of C and N mineralization. Soil Biology and Biochemistry 27, 1099–1108. 595
Haynes, R.J., 1986. Chapter 2 - the Decomposition Process: Mineralization, Immobilization, 596
Humus Formation, and Degradation. In: Haynes, R.J. (Ed.), Mineral Nitrogen in the Plant– 597
Soil System. Academic Press, pp. 52–126. 598
Haynes, R.J., 2005. Labile organic matter fractions as central components of the quality of 599
agricultural soils: An overview. Advances in Agronomy 85, 221–268. 600
Hetényi, M., Nyilas, T., Sajgó, C., Brukner-Wein, A., 2006. Heterogeneous organic matter 601
from the surface horizon of a temperate zone marsh. Organic Geochemistry 37, 1931–1942. 602
Hetényi, M., Nyilas, T., Tóth, T.M., 2005. Stepwise Rock-Eval pyrolysis as a tool for typing 603
heterogeneous organic matter in soils. Journal of Analytical and Applied Pyrolysis 74, 45– 604
54. 605
Hockaday, W.C., Gallagher, M.E., Masiello, C.A., Baldock, J.A., Iversen, C.M., Norby, R.J., 606
2015. Forest soil carbon oxidation state and oxidative ratio responses to elevated CO2.
607
Journal of Geophysical Research: Biogeosciences 120, 1797–1811. 608
Hockaday, W.C., Masiello, C.A., Randerson, J.T., Smernik, R.J., Baldock, J.A., Chadwick, 609
O.A., Harden, J.W., 2009. Measurement of soil carbon oxidation state and oxidative ratio by 610
13C nuclear magnetic resonance. Journal of Geophysical Research 114.
611
IUSS Working Group, 2015. World reference base for soil resources 2014 (update 2015), 612
international soil classification system for naming soils and creating legends for soil maps. 613
World Soil Resources Reports No. 106. FAO, Rome. 614
Janzen, H.H., Campbell, C.A., Brandt, S.A., Lafond, G.P., Townley-Smith, L., 1992. Light-615
fraction organic matter in soils from long-term crop rotations. Soil Science Society of 616
America Journal 56, 1799–1806. 617
Jenkinson, D.S., Poulton, P.R., Bryant, C., 2008. The turnover of organic carbon in subsoils. 618
Part 1. Natural and bomb radiocarbon in soil profiles from the Rothamsted long-term field 619
experiments. European Journal of Soil Science 59, 391–399. 620
Jonard, M., Nicolas, M., Coomes, D.A., Caignet, I., Saenger, A., Ponette, Q., 2017. Forest 621
soils in France are sequestering substantial amounts of carbon. Science of The Total 622
Environment 574, 616–628. 623
Kassambara, A., Mundt, F., 2016. Factoextra: Extract and visualize the results of multivariate 624
data analyses. 625
Lafargue, E., Marquis, F., Pillot, D., 1998. Rock-Eval 6 applications in hydrocarbon 626
exploration, production, and soil contamination studies. Oil & Gas Science and Technology 627
- Revue IFP 53, 421–437. 628
Li, X.J., Li, X.R., Wang, X.P., Yang, H.T., 2016. Changes in soil organic carbon fractions 629
after afforestation with xerophytic shrubs in the tengger desert, northern china. European 630
Journal of Soil Science 67, 184–195. 631
Liang, B.C., McConkey, B.G., Schoenau, J., Curtin, D., Campbell, C.A., Moulin, A.P., 632
Lafond, G.P., Brandt, S.A., Wang, H., 2003. Effect of tillage and crop rotations on the light 633
fraction organic carbon and carbon mineralization in chernozemic soils of Saskatchewan. 634
Canadian Journal of Soil Science 83, 65–72. 635
Lorenz, K., Lal, R., 2005. The depth distribution of soil organic carbon in relation to land use 636
and management and the potential of carbon sequestration in subsoil horizons. Advances in 637
Agronomy 88, 35–66. 638
Luo, Y., Ahlström, A., Allison, S.D., Batjes, N.H., Brovkin, V., Carvalhais, N., Chappell, A., 639
Ciais, P., Davidson, E.A., Finzi, A., Georgiou, K., Guenet, B., Hararuk, O., Harden, J.W., 640
He, Y., Hopkins, F., Jiang, L., Koven, C., Jackson, R.B., Jones, C.D., Lara, M.J., Liang, J., 641
McGuire, A.D., Parton, W., Peng, C., Randerson, J.T., Salazar, A., Sierra, C.A., Smith, M.J., 642
Tian, H., Todd-Brown, K.E.O., Torn, M., van Groenigen, K.J., Wang, Y.P., West, T.O., 643
Wei, Y., Wieder, W.R., Xia, J., Xu, X., Xu, X., Zhou, T., 2016. Toward more realistic 644
projections of soil carbon dynamics by earth system models. Global Biogeochemical Cycles 645
30, 40–56. 646
Peltre, C., Fernández, J.M., Craine, J.M., Plante, A.F., 2013. Relationships between biological 647
and thermal indices of soil organic matter stability differ with soil organic carbon level. 648
SSSAJ 77, 2020–2028. 649
Ponette, Q., Ulrich, E., Brêthes, A., Bonneau, M., Lanier, M., 1997. RENECOFOR - Chimie 650
Des Sols Dans Les 102 Peuplements Du Réseau : Campagne De Mesures 1993-95. ONF, 651
Département des recherches techniques, Fontainebleau, France, 427 pp. 652
R Core Team, 2016. R: A language and environment for statistical computing. 653
Saenger, A., Cécillon, L., Poulenard, J., Bureau, F., De Daniéli, S., Gonzalez, J., Brun, J., 654
2015. Surveying the carbon pools of mountain soils: A comparison of physical fractionation 655
and Rock-Eval pyrolysis. Geoderma 241–242, 279–288. 656
Schiedung, M., Don, A., Wordell-Dietrich, P., Alcántara, V., Kuner, P., Guggenberger, G., 657
2017. Thermal oxidation does not fractionate soil organic carbon with differing biological 658
stabilities. Journal of Plant Nutrition and Soil Science 180, 18–26. 659
Schrumpf, M., Kaiser, K., 2015. Large differences in estimates of soil organic carbon 660
turnover in density fractions by using single and repeated radiocarbon inventories. 661
Geoderma 239–240, 168–178. 662
Sebag, D., Disnar, J.R., Guillet, B., Di Giovanni, C., Verrecchia, E.P., Durand, A., 2006. 663
Monitoring organic matter dynamics in soil profiles by ‘Rock-Eval pyrolysis’: Bulk 664
characterization and quantification of degradation. European Journal of Soil Science 57, 665
344–355. 666
Sebag, D., Verrecchia, E.P., Cécillon, L., Adatte, T., Albrecht, R., Aubert, M., Bureau, F., 667
Cailleau, G., Copard, Y., Decaens, T., Disnar, J.-R., Hetényi, M., Nyilas, T., Trombino, L., 668
2016. Dynamics of soil organic matter based on new Rock-Eval indices. Geoderma 284, 669
185–203. 670
Six, J., Elliott, E.T., Paustian, K., Doran, J.W., 1998. Aggregation and soil organic matter 671
accumulation in cultivated and native grassland soils. Soil Science Society of America 672
Journal 62, 1367–1377. 673
Trumbore, S.E., Zheng, S., 1996. Comparison of fractionation methods for soil organic matter 674
14C analysis. Radiocarbon 38, 219–229.
675
Trumbore, S.E., Chadwick, O.A., Amundson, R., 1996. Rapid exchange between soil carbon 676
and atmospheric carbon dioxide driven by temperature change. Science 272, 393–396. 677
Ulrich, E., 1995. Le réseau RENECOFOR : Objectifs et réalisation. Revue forestière française 678
47, 107–124. 679
von Lützow, M., Kögel-Knabner, I., 2010. Response to the concept paper: 'What is 680
recalcitrant soil organic matter?' by Markus Kleber. Environmental Chemistry 7, 333–335. 681
von Lützow, M., Kögel-Knabner, I., Ekschmitt, K., Flessa, H., Guggenberger, G., Matzner, 682
E., Marschner, B., 2007. SOM fractionation methods: Relevance to functional pools and to 683
stabilization mechanisms. Soil Biology and Biochemistry 39, 2183–2207. 684
Wander, M.M., Bidart, M.G., 2000. Tillage practice influences on the physical protection, 685
bioavailability and composition of particulate organic matter. Biology and Fertility of Soils 686
32, 360–367. 687
Wander, M., 2004. Soil Organic Matter Fractions and their Relevance to Soil Function. In: 688
Magdoff, F., Weil, R.R. (Eds.), Soil Organic Matter in Sustainable Agriculture. CRC Press, 689
pp. 67–102. 690
Figure captions
692
Fig. 1. (a) Location of the 53 study sites front the French national network for the long term 693
monitoring of forest ecosystems (RENECOFOR); (b) Number of samples by depths and 694
analyses realized. Plot locations are also available via the Interactive Map Viewer. 695
696
Fig. 2. Biplot of a principal components analysis (PCA) showing the loadings of the 6 697
parameters estimating the labile SOC (red arrows) and the 99 soil samples for the two layers 698
(0–10 cm, n = 53; 40–80 cm, n = 46) along the first two principal component axes (PC1 and 699
PC2). The 95% ellipses for both soil layers were added for information; the circle in the 700
center corresponds to the circle of correlations. 701
702
Fig. 3. The proportion of OC in the POM fraction (POM-C) as a function of T50_HC_PYR (the
703
temperature at which 50% of the HC pyrolysis effluents have evolved) for all samples (n = 704
99; surface = 0–10 cm and deep = 40–80 cm). 705
Figure captions
707
Fig. 1. (a) Location of the 53 study sites front the French national network for the long term
708
monitoring of forest ecosystems (RENECOFOR); (b) Number of samples by depths and 709
analyses realized. Plot locations are also available via the Interactive Map Viewer. 710
711
Fig. 2. Biplot of a principal components analysis (PCA) showing the loadings of the 6
712
parameters estimating the labile SOC (red arrows) and the 99 soil samples for the two layers 713
(0–10 cm, n = 53; 40–80 cm, n = 46) along the first two principal component axes (PC1 and 714
PC2). The 95% ellipses for both soil layers were added for information; the circle in the 715
center corresponds to the circle of correlations. 716
717
Fig. 3. The proportion of OC in the POM fraction (POM-C) as a function of T50_HC_PYR (the
718
temperature at which 50% of the HC pyrolysis effluents have evolved) for all samples (n = 719
99; surface = 0–10 cm and deep = 40–80 cm). 720
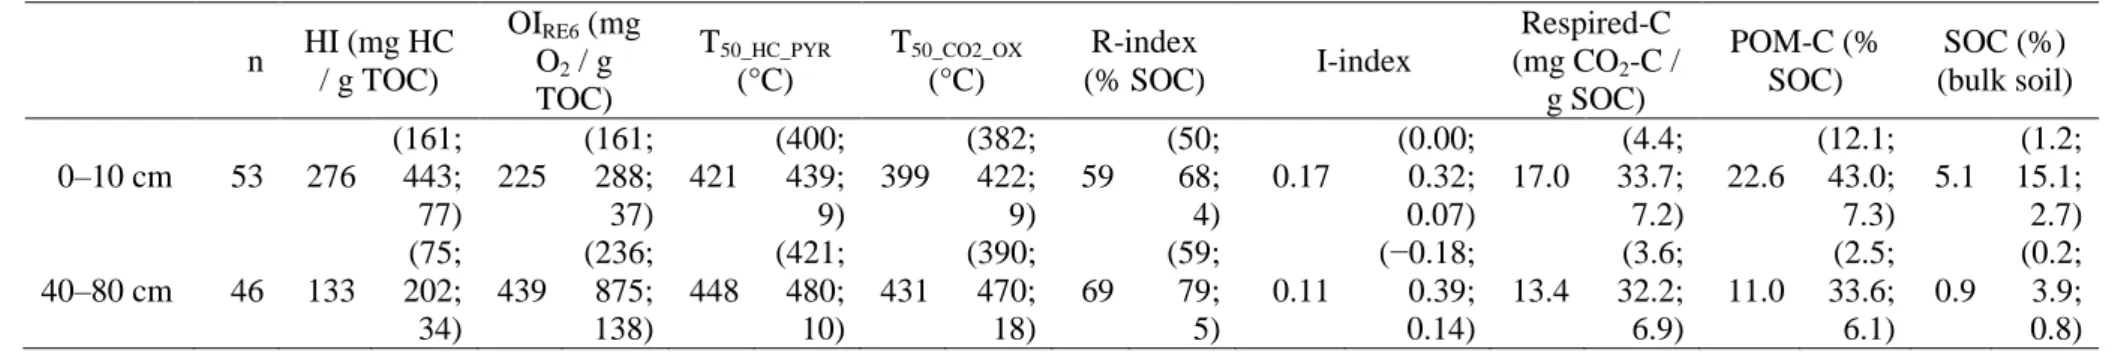
Table 1. Mean (and minimum; maximum; standard deviation) of the RE6 (HI, OIRE6,T50_HC_PYR, T50_CO2_OX, R-index, I-index), respiration test
(10-week mineralizable C, respired-C) and POM fractionation (POM-C) parameters, as well as the bulk SOC content for each soil layer (0–10
and 40–80 cm) of the 53 RENECOFOR plots.
n HI (mg HC / g TOC) OIRE6 (mg O2 / g TOC) T50_HC_PYR (°C) T50_CO2_OX (°C) R-index (% SOC) I-index Respired-C (mg CO2-C / g SOC) POM-C (% SOC) SOC (%) (bulk soil) 0–10 cm 53 276 (161; 443; 77) 225 (161; 288; 37) 421 (400; 439; 9) 399 (382; 422; 9) 59 (50; 68; 4) 0.17 (0.00; 0.32; 0.07) 17.0 (4.4; 33.7; 7.2) 22.6 (12.1; 43.0; 7.3) 5.1 (1.2; 15.1; 2.7) 40–80 cm 46 133 (75; 202; 34) 439 (236; 875; 138) 448 (421; 480; 10) 431 (390; 470; 18) 69 (59; 79; 5) 0.11 (−0.18; 0.39; 0.14) 13.4 (3.6; 32.2; 6.9) 11.0 (2.5; 33.6; 6.1) 0.9 (0.2; 3.9; 0.8) Table 1
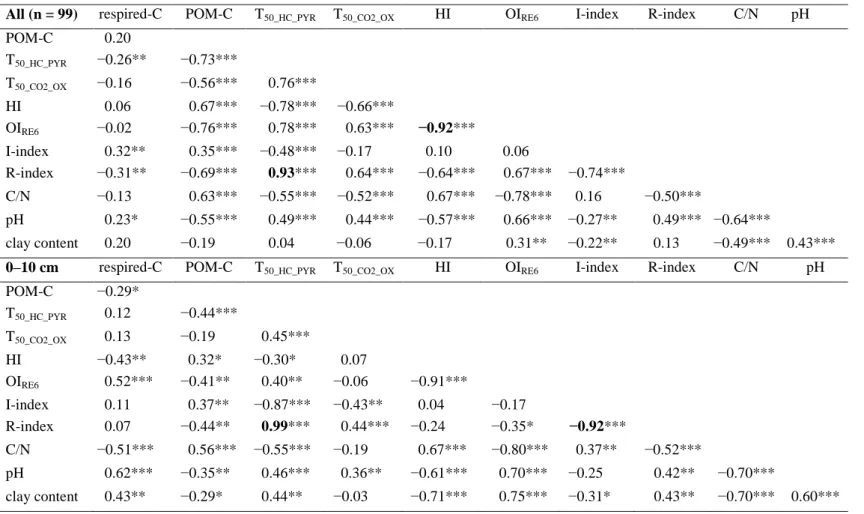
Table 2. Spearman correlation coefficients between 10-week mineralizable SOC (respired-C), the proportion of OC in the POM fraction
(POM-C), the RE6 parameters and the C/N ratio, pH and clay content of the bulk soil, for both the 0–10 cm (n = 53) and 40–80 cm (n = 46) layers and
each layer individually. Significance is indicated as follows: ***: p < 0.001; **: p < 0.01; *: p < 0.05. The very high correlations are marked in
bold.
All (n = 99) respired-C POM-C T50_HC_PYR T50_CO2_OX HI OIRE6 I-index R-index C/N pH
POM-C 0.20 T50_HC_PYR −0.26** −0.73*** T50_CO2_OX −0.16 −0.56*** 0.76*** HI 0.06 0.67*** −0.78*** −0.66*** OIRE6 −0.02 −0.76*** 0.78*** 0.63*** −0.92*** I-index 0.32** 0.35*** −0.48*** −0.17 0.10 0.06 R-index −0.31** −0.69*** 0.93*** 0.64*** −0.64*** 0.67*** −0.74*** C/N −0.13 0.63*** −0.55*** −0.52*** 0.67*** −0.78*** 0.16 −0.50*** pH 0.23* −0.55*** 0.49*** 0.44*** −0.57*** 0.66*** −0.27** 0.49*** −0.64*** clay content 0.20 −0.19 0.04 −0.06 −0.17 0.31** −0.22** 0.13 −0.49*** 0.43***
0–10 cm respired-C POM-C T50_HC_PYR T50_CO2_OX HI OIRE6 I-index R-index C/N pH
POM-C −0.29* T50_HC_PYR 0.12 −0.44*** T50_CO2_OX 0.13 −0.19 0.45*** HI −0.43** 0.32* −0.30* 0.07 OIRE6 0.52*** −0.41** 0.40** −0.06 −0.91*** I-index 0.11 0.37** −0.87*** −0.43** 0.04 −0.17 R-index 0.07 −0.44** 0.99*** 0.44*** −0.24 −0.35* −0.92*** C/N −0.51*** 0.56*** −0.55*** −0.19 0.67*** −0.80*** 0.37** −0.52*** pH 0.62*** −0.35** 0.46*** 0.36** −0.61*** 0.70*** −0.25 0.42** −0.70*** −0.29* −0.03 −0.71*** −0.31* −0.70*** 0.60*** Table 2
40–80 cm respired−C POM−C T50_HC_PYR T50_CO2_OX HI OIRE6 I−index R-index C/N pH POM−C 0.47*** T50_HC_PYR −0.41** −0.35* T50_CO2_OX −0.01 −0.01 0.26 HI −0.03 0.06 −0.24 −0.24 OIRE6 0.13 −0.42** 0.10 0.22 −0.47*** I−index 0.41** 0.13 −0.19 0.43** −0.49*** 0.40** R-index −0.52*** −0.28 0.64*** −0.19 0.20 −0.20 −0.85*** C/N −0.17 0.30* 0.10 −0.18 0.25 −0.65*** 0.30* 0.23 pH 0.03 −0.34* −0.03 −0.18 0.11 0.25 −0.07 0.06 −0.27 clay content −0.08 −0.42** −0.01 0.11 −0.07 0.62*** −0.15 0.17 −0.59*** 0.35*
Figure 1
Figure 2
Figure 3
Is Rock-Eval 6 thermal analysis a good indicator of soil organic carbon lability? – A
method-comparison study in forest soils
Laure Soucémarianadin1,*, Lauric Cécillon2, Claire Chenu3, François Baudin4, Manuel
Nicolas5, Cyril Girardin3 and Pierre Barré1
Supporting Information
Table SI-A.1. Mean (+ standard deviation) particle-size distribution, pH and C/N ratio of the
studied samples.
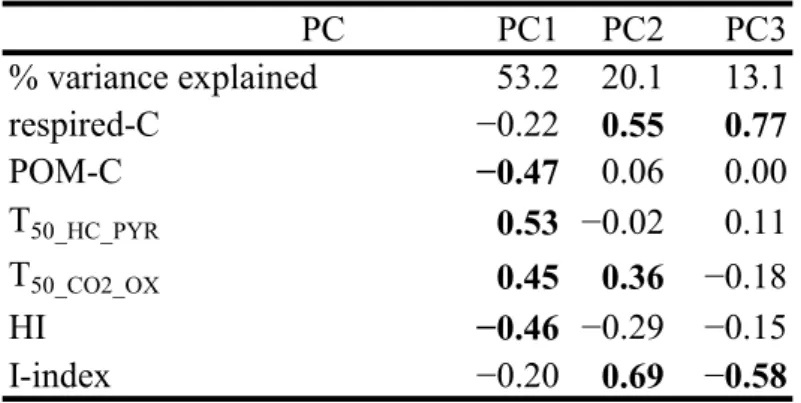
Table SI-B1. Percentage of variance explained and loadings of the first three principal
components (PC) after Box-Cox transformation to correct for skewness for the PCA of all (0–
10 cm and 40–80 cm) samples (n = 99). Values in bold indicate the variables with loading
greater than the mean of the absolute loading in each PC.
Table SI-C1. Spearman correlation coefficients between 10-week mineralizable SOC
(respired-C), the proportion of OC in the POM fraction (POM-C), the RE6 parameters and the
C/N ratio of the bulk soil, for the three soil types and the two vegetation types. Significance is
indicated as follows: ***: p < 0.001; **: p < 0.01; *: p < 0.05. The very high (> 0.9)
correlations are marked in bold.
Fig. SI-A1. Description of the Rock-Eval 6 thermal analysis (adapted from Saenger et al.,
2013) and calculation of four RE6-derived parameters (Hydrogen index; Oxygen index;
evolved; T50_CO2_OX, the temperature at which 50% of the residual SOM was oxidized to CO2
during the oxidation phase).
Fig. SI-B1. The proportion of OC in the POM fraction (POM-C) as a function of (a)
respired-C (the proportion of total SOrespired-C mineralizable during a 10-week laboratory incubation); (b)
OIRE6 (the oxygen index); (c) HI (the hydrogen index); (d) R-index (the proportion of
depth (cm) n
0–10 53 22.5 (13.6) 35.5 (18.0) 42.0 (28.8) 4.9 (1.0) 16.9 (4.5) 40–80 46 21.0 (15.4) 32.8 (16.2) 46.2 (26.7) 5.9 (1.5) 11.8 (3.8) Table SI-A.1. Mean (+ standard deviation) particle-size distribution, pH and C/N ratio of the studied samples in each layer of the 53 plots.
PC PC1 PC2 PC3 % variance explained 53.2 20.1 13.1 respired-C −0.22 0.55 0.77 POM-C −0.47 0.06 0.00 T50_HC_PYR 0.53 −0.02 0.11 T50_CO2_OX 0.45 0.36 −0.18 HI −0.46 −0.29 −0.15 I-index −0.20 0.69 −0.58
Table SI-B1. Percentage of variance explained and loadings of the first three principal components (PC) after Box-Cox transformation to correct for skewness for the PCA of all samples (n = 99). Values in bold indicate the variables with loading greater than the mean of the absolute loading in each PC.