HAL Id: hal-00303098
https://hal.archives-ouvertes.fr/hal-00303098
Submitted on 13 Sep 2007HAL is a multi-disciplinary open access
archive for the deposit and dissemination of sci-entific research documents, whether they are pub-lished or not. The documents may come from teaching and research institutions in France or abroad, or from public or private research centers.
L’archive ouverte pluridisciplinaire HAL, est destinée au dépôt et à la diffusion de documents scientifiques de niveau recherche, publiés ou non, émanant des établissements d’enseignement et de recherche français ou étrangers, des laboratoires publics ou privés.
Influence of clouds on the spectral actinic flux density in
the lower troposphere (INSPECTRO): overview of the
field campaigns
S. Thiel, L. Ammannato, A. Bais, B. Bandy, M. Blumthaler, B. Bohn, O.
Engelsen, G. P. Gobbi, J. Gröbner, E. Jäkel, et al.
To cite this version:
S. Thiel, L. Ammannato, A. Bais, B. Bandy, M. Blumthaler, et al.. Influence of clouds on the spectral actinic flux density in the lower troposphere (INSPECTRO): overview of the field campaigns. Atmospheric Chemistry and Physics Discussions, European Geosciences Union, 2007, 7 (5), pp.13417-13473. �hal-00303098�
ACPD
7, 13417–13473, 2007 Influence of clouds
on the spectral actinic flux density
S. Thiel et al. Title Page Abstract Introduction Conclusions References Tables Figures ◭ ◮ ◭ ◮ Back Close
Full Screen / Esc
Printer-friendly Version Interactive Discussion
EGU Atmos. Chem. Phys. Discuss., 7, 13417–13473, 2007
www.atmos-chem-phys-discuss.net/7/13417/2007/ © Author(s) 2007. This work is licensed
under a Creative Commons License.
Atmospheric Chemistry and Physics Discussions
Influence of clouds on the spectral actinic
flux density in the lower troposphere
(INSPECTRO): overview of the field
campaigns
S. Thiel1, L. Ammannato2, A. Bais3, B. Bandy4, M. Blumthaler5, B. Bohn6, O. Engelsen7, G. P. Gobbi2, J. Gr ¨obner8,*, E. J ¨akel9,******, W. Junkermann1, S. Kazadzis3, R. Kift10, B. Kjeldstad11, N. Kouremeti3, A. Kylling12,**, B. Mayer13, P. S. Monks14, C. E. Reeves4, B. Schallhart5, R. Scheirer13,***, S. Schmidt9,****, R. Schmitt15, J. Schreder16, R. Silbernagl5,*****, C. Topaloglou3,
T. M. Thorseth11,*******, A. R. Webb10, M. Wendisch9,******, and P. Werle1
1
Institut f ¨ur Meteorologie und Klimaforschung (IMK-IFU), Forschungszentrum Karlsruhe, Garmisch-Partenkirchen, Germany
2
Istituto di Scienze dell’Atmosfera e del Clima (ISAC-CNR), Consiglio Nazionale delle Ricerche, Rome, Italy
3
Aristotle University of Thessaloniki, Laboratory of Atmospheric Physics, Thessaloniki, Greece
4
School of Environmental Sciences, University of East Anglia, Norwich, UK
5
Division of Biomedical Physics, Innsbruck Medical University, Innsbruck, Austria
6
Forschungszentrum Juelich, ICG Institut II: Troposphere, Juelich, Germany
7
ACPD
7, 13417–13473, 2007 Influence of clouds
on the spectral actinic flux density
S. Thiel et al. Title Page Abstract Introduction Conclusions References Tables Figures ◭ ◮ ◭ ◮ Back Close
Full Screen / Esc
Printer-friendly Version Interactive Discussion
EGU
8
Institute for Health and Consumer Protection (IHCP), Physical and Chemical Exposure Unit, European Comission – Joint Research Center (JRC), Ispra, Italy
9
Institute for Tropospheric Research (IFT), Leipzig, Germany
10
University of Manchester, School of Earth, Atmospheric and Environmental Science, Manch-ester, UK
11
Dept. of Physics, Norwegian University of Science and Technology, Trondheim, Norway
12
Norwegian Institute for Air Research (NILU), Oslo, Norway
13
Institut f ¨ur Physik der Atmosph ¨are, Deutsches Zentrum f ¨ur Luft- und Raumfahrt (DLR), Oberpfaffenhofen, Germany
14
Department of Chemistry, University of Leicester, Leicester, UK
15
Meteoconsult GmbH, Glash ¨utten, Germany
16
CMS Ing. Dr. Schreder GmbH, Kirchbichl, Austria
∗now at: Physikalisch-Meteorologisches Observatorium Davos, World Radiation Center
(PMOD/WRC), Dorfstrasse 33, 7260 Davos Dorf, Switzerland
∗∗now at: St. Olavs Hospital, Trondheim Univ. Hospital, and ˚Alesund Hospital, ˚Alesund, Norway ∗∗∗now at: Swedish Meteorological and Hydrological Institute (SMHI), Folkborgsv ¨agen 1, 60176
Norrk ¨oping, Sverige
∗∗∗∗now at: University of Colorado, Laboratory for Atmospheric and Space Physics, Duane
Physics Building, Room D-337, University of Colorado, Boulder, CO 80309-0311, USA
∗∗∗∗∗now at: Institut f. Medizinischen Strahlenschutz und Dosimetrie, Landeskrankenhaus
Inns-bruck, Innrain 66, 6020 Innsbruck
∗∗∗∗∗∗now at: Institute for Atmospheric Physics, Johannes Gutenberg-University Mainz,
Becher-weg 21, 55099 Mainz, Germany
∗∗∗∗∗∗∗now at: Sor Trondelag University College, Faculty of Technology, 7004 Trondheim, Norway
Received: 20 July 2007 – Accepted: 4 September 2007 – Published: 13 September 2007 Correspondence to: S. Thiel ([email protected])
ACPD
7, 13417–13473, 2007 Influence of clouds
on the spectral actinic flux density
S. Thiel et al. Title Page Abstract Introduction Conclusions References Tables Figures ◭ ◮ ◭ ◮ Back Close
Full Screen / Esc
Printer-friendly Version Interactive Discussion
EGU
Abstract
Ultraviolet radiation is the key factor driving tropospheric photochemistry. It is strongly modulated by clouds and aerosols. A quantitative understanding of the radiation field and its effect on photochemistry is thus only possible with a detailed knowledge of the interaction between clouds and radiation. The overall objective of the project
INSPEC-5
TRO was the characterization of the three-dimensional actinic radiation field under cloudy conditions. This was achieved during two measurement campaigns in Norfolk (East Anglia, UK) and Lower Bavaria (Germany) combining space-based, aircraft and ground-based measurements as well as simulations with the one-dimensional radiation transfer model UVSPEC and the three-dimensional radiation transfer model MYSTIC.
10
During both campaigns the spectral actinic flux density was measured at several locations at ground level and in the air by up to four different aircraft. This allows the comparison of measured and simulated actinic radiation profiles. In addition satellite data were used to complete the information of the three dimensional input data set for the simulation. A three-dimensional simulation of actinic flux density data under cloudy
15
sky conditions requires a realistic simulation of the cloud field to be used as an input for the 3-D radiation transfer model calculations. Two different approaches were applied, to derive high- and low-resolution data sets, with a grid resolution of about 100 m and 1 km, respectively.
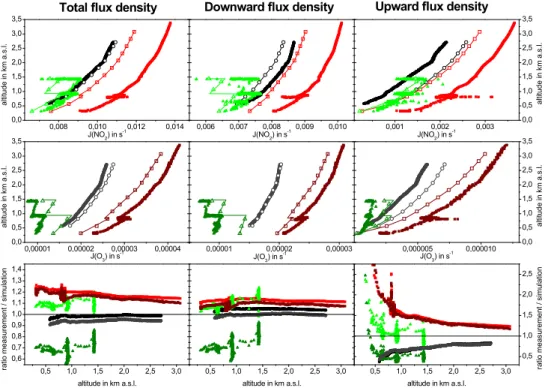
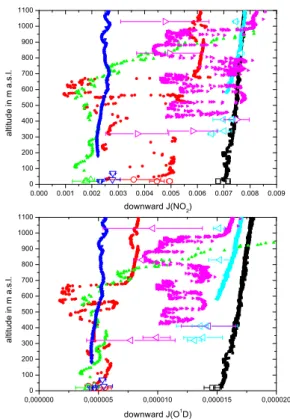
The results of the measured and simulated radiation profiles as well as the results
20
of the ground based measurements are presented in terms of photolysis rate profiles for ozone and nitrogen dioxide. During both campaigns all spectroradiometer systems agreed within ±10% if mandatory corrections e.g. stray light correction were applied. Stability changes of the systems were below 5% over the 4 week campaign periods and negligible over a few days. The J(O1D) data of the single monochromator systems can
25
be evaluated for zenith angles less than 70◦, which was satisfied by nearly all airborne
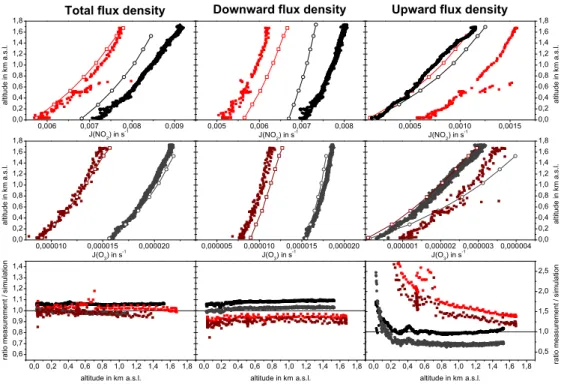
measurements during both campaigns. The comparison of the airborne measurements with corresponding simulations is presented for the total, downward and upward flux
ACPD
7, 13417–13473, 2007 Influence of clouds
on the spectral actinic flux density
S. Thiel et al. Title Page Abstract Introduction Conclusions References Tables Figures ◭ ◮ ◭ ◮ Back Close
Full Screen / Esc
Printer-friendly Version Interactive Discussion
EGU during selected clear sky periods of both campaigns. The compliance between the
measured (from three aircraft) and simulated downward and total flux profiles lies in the range of ±15%.
1 Introduction
Ultraviolet radiation is the main driving force of tropospheric photochemistry
5
(Madronich, 1987; Thompson and Stewart, 1991). Tropospheric chemistry is con-trolled by the photolysis of nitrogen dioxide, ozone, and various other trace gases, and thus by the amount of ultraviolet radiation available throughout the atmosphere and its spectral distribution. The radiation field itself is strongly modulated by clouds and aerosols (Mims and Frederick, 1994; Seckmeyer, 1996). Therefore, the interaction of
10
clouds with the radiation field plays a major role in tropospheric chemistry (Madronich, 1987; Lelieveld and Crutzen, 1991; Los et al., 1997; Trautmann et al., 1999). Con-sidering that approximately 60% of the globe is covered by clouds at any one time, a quantitative understanding of the radiation field and its effect on photochemistry is thus only possible with a detailed knowledge of the interaction of clouds with radiation. This
15
is particularly true for regional and global chemistry models which at present, due to lack of better knowledge, rely on very simple parameterizations of clouds.
While much effort has been expended on the measurement of UV irradiance in ground based networks, on quality assurance issues, and on the improvement of in-struments, the interaction of radiation with clouds has not been a main focus, mainly
20
due to a lack of tools to address this important question. The instrumentation and the-oretical methods developed during the last decade, however, form the ideal basis for starting research on the effect of clouds on photochemically active radiation. Consid-erable effort has been spent upon the quality control and to retrieval methodologies for the actinic flux measurements at the ground (Bais et al., 2003; Webb et al., 2002). The
25
International Photolysis Frequency Measurement and Model Intercomparison (IPMMI) and the ADMIRA project which investigated the relationship between spectral actinic
ACPD
7, 13417–13473, 2007 Influence of clouds
on the spectral actinic flux density
S. Thiel et al. Title Page Abstract Introduction Conclusions References Tables Figures ◭ ◮ ◭ ◮ Back Close
Full Screen / Esc
Printer-friendly Version Interactive Discussion
EGU flux density and spectral irradiance were an important step towards a higher level of
accuracy of photolysis frequency and spectral downwelling actinic flux density mea-surements (e.g. Crawford et al., 2003; Webb et al., 2004 ). Beneath the ground based measurement of actinic flux density also several airborne spectroradiometer systems were developed (Hofzumahaus et al., 1999, Shetter and M ¨uller, 1999; J ¨akel et al.,
5
2005) and used for first measurements mainly under cloudless conditions. Measured actinic flux and photolysis frequency profiles exhibit deviations to the 1-D radiation transfer models in UVB at lower altitudes and high aerosol loads even under clear sky conditions (Balis et al., 2002; Hofzumahaus et al., 2002).
The most challenging and important task is the characterization of the radiation field
10
under cloudy conditions so as to be representative of larger areas of 50×50 km2. This corresponds to the size of a typical grid cell of a Chemical Transport Model (CTM) and allows thus the investigation of the impact of the variability of the actinic flux density due to clouds on photochemistry on a statistical basis. Clouds are usually variable in all three spatial dimensions, thus requiring three-dimensional rather than one-dimensional
15
radiative transfer simulations. Secondly, the experimental characterization of a three-dimensional cloud field is a demanding task, requiring at least the instantaneous deter-mination of extinction coefficient throughout the cloud field. Single aircraft instrumenta-tion can only provide cross secinstrumenta-tions at the time and locainstrumenta-tion of the measurement and thus needs to be complemented by further aircraft and ground-based measurements
20
as well as satellite data.
The main task of the INSPECTRO-project was the investigation of the influence of clouds on the spectral actinic flux in the lower troposphere. This project brought to-gether state of the art measurement and modelling capabilities and combined them in an innovative approach to study the three-dimensional radiation field.
25
– ground-based instrumentation for measurements of spectrally resolved actinic flux density and irradiance as well as some properties of aerosols and clouds.
ACPD
7, 13417–13473, 2007 Influence of clouds
on the spectral actinic flux density
S. Thiel et al. Title Page Abstract Introduction Conclusions References Tables Figures ◭ ◮ ◭ ◮ Back Close
Full Screen / Esc
Printer-friendly Version Interactive Discussion
EGU actinic flux as well as cloud parameters and the optical properties of the
cloud-free areas.
– Satellite based information of cloud cover and total ozone column over the mea-surement area.
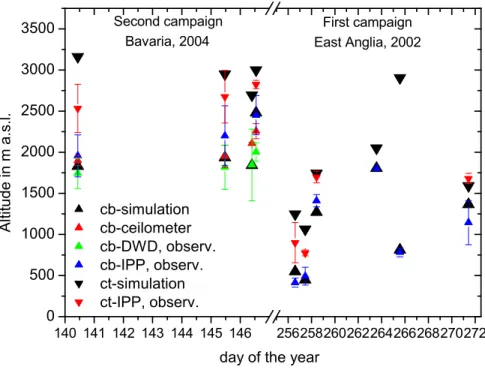
This paper provides an overview and summary of the INSPECTRO field campaigns in
5
2002 in East Anglia, UK and 2004 in Bavaria, Germany and describes the measure-ment sites and conditions as well as the spectral actinic flux measuremeasure-ment systems. We present results of the intercomparison of the participating spectroradiometers, the comparison of airborne measurements from different platforms and ground based mea-surements as well as the validation of simulated cloud fields (Scheirer and Schmidt,
10
2005; Schmidt et al., 2007) as input for 3-D radiation transfer models. The paper is part of a special issue within ACP and forms a reference for other publications util-ising data from the INSPECTRO campaigns as it contains detailed description of the campaign site, prevailing conditions, instrumentations, data collection and simulations.
2 Experimental
15
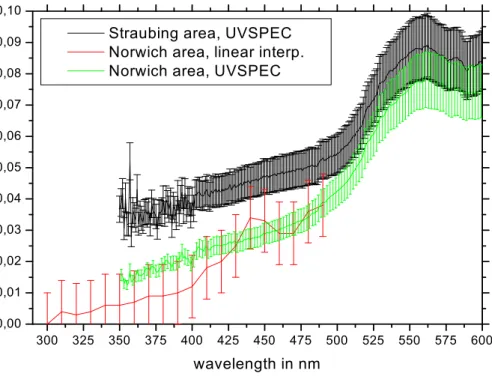
The first campaign was performed in East Anglia (Norfolk, UK) from 1 September until 1 October 2002. The second campaign was performed in the South East of Bavaria (Straubing, Germany) between 3 and 28 May 2004. While the area of East Anglia is strongly influenced by a maritime climate, the Bavarian area represents a continental climate site in Europe.
20
2.1 Measurement sites East Anglia
Ground based instruments were deployed at four sites, marking the corners of the ex-perimental box with an area of approximately 12×20 km2. The geographical position
ACPD
7, 13417–13473, 2007 Influence of clouds
on the spectral actinic flux density
S. Thiel et al. Title Page Abstract Introduction Conclusions References Tables Figures ◭ ◮ ◭ ◮ Back Close
Full Screen / Esc
Printer-friendly Version Interactive Discussion
EGU of the sites as well as the topography of the area is shown in Fig. 1. Each site was
equipped with a cabin housing the personnel and control computers. The instruments were mounted either on the ground close to the cabins, or on a cabin roof. The Wey-bourne site (WE, 20 m a.s.l.) is a field station of the University of East Anglia with routine chemical measurements so this was used as the core site with both chemistry
5
and radiation data available. The site is on the coast, with the permanent Weybourne buildings closest to the sea, then a gently sloping concrete area, finally grass closest to inland (to the south). The other sites were at Beeston Regis (BE, 20 m a.s.l.) on top of the cliff, to the east of Weybourne; at a school in Briston (BR, 70 m a.s.l.), inland to the south and slightly west of Weybourne; and at Aylsham (AY, 30 m a.s.l.), inland to
10
the south of Beeston Regis. Norwich airport (NO, 33 m a.s.l.), where the aircraft were based, is to the South East of this grid.
Bavaria
For the Bavarian campaign the ground based instruments were deployed at six sites shown in Fig. 1 (Bavaria, Germany) and covering an area of approximately 55×55 km2.
15
The topography of the Bavarian campaign area is much more pronounced than in East Anglia and ranges from 320 m a.s.l. at Straubing airport (ST) up to 1030 m a.s.l. on top of the Brotjacklriegel mountain (BJ). The site at Buchhofen (BU, 338 m a.s.l.) was centred in the measurement area and was used as the core site. Spiegelau (SP) is a site with an altitude of 830 m a.s.l. in the mountain area. On top of the mountain
Brot-20
jacklriegel the Federal Environmental Agency (UBA, Dessau, Germany) has operated a recording point for air quality. It was used as a “high elevation” site for spectral actinic flux measurements. However, this site was adversely affected by obstructions of the horizon. In addtition the three airports at F ¨urstenzell (FU, 410 m a.s.l.), Eggenfelden (EG, 411 m a.s.l.) and Straubing were used in the corners of the measurement grid.
25
The airfield of Straubing in the North East of the grid was used as an operational base for the aircraft. The surroundings for most sites consisted of a mixture of grass-, farm-and woodlfarm-and. As in East Anglia, each site was equipped with a cabin housing the
ACPD
7, 13417–13473, 2007 Influence of clouds
on the spectral actinic flux density
S. Thiel et al. Title Page Abstract Introduction Conclusions References Tables Figures ◭ ◮ ◭ ◮ Back Close
Full Screen / Esc
Printer-friendly Version Interactive Discussion
EGU personnel and control computers for the instrumentation at the site.
2.2 Measurement platforms and airborne instrumentation
The following airborne platforms were used during both campaigns:
– A Cessna (C) for measuring ground albedo (East Anglia and Bavaria) and spectral actinic flux below clouds (Bavaria)
5
– Two Partenavia P68 (PG and PL) for measuring albedo (ground and clouds, only PL), spectral actinic flux within and above clouds, microphysical parameters of clouds and aerosol parameters
Additionally an ultralight aircraft (Junkermann, 2005) was used during the first cam-paign in East Anglia for measuring ozone, aerosol properties and spectral actinic flux
10
around clouds (small scale variability of the actinic flux density). Further a hot air balloon (Cameron Viva 77) was operated for specific measurements of the effective albedo and actinic flux vertical profiles in East Anglia (Webb et al., 2004). Each aircraft also contributed to cloud geometry data e.g. altitude of cloud base and cloud top. In addition each aircraft logged basic data such as position, altitude, speed and direction
15
during flight. Partenavia PL:
On board of the Partenavia P68B aircraft, operated by the Leibniz-Institute for Tro-pospheric Research (IFT), radiation, microphysical and standard meteorological mea-surements were performed. Up- and downwelling irradiances were measured by the
20
Albedometer (Wendisch et al., 2001; Wendisch and Mayer, 2003) in the wavelength range between 350 and 1000 nm. Up- and downwelling actinic flux density data were collected in a wavelength range between 280 nm and 700 nm by the actinic flux density meter (AFDM; DFD/DFU) described by J ¨akel et al. (2005). The optical inlets of the Albedometer and the AFDM mounted at the top and the bottom of the aircraft were
ACPD
7, 13417–13473, 2007 Influence of clouds
on the spectral actinic flux density
S. Thiel et al. Title Page Abstract Introduction Conclusions References Tables Figures ◭ ◮ ◭ ◮ Back Close
Full Screen / Esc
Printer-friendly Version Interactive Discussion
EGU actively stabilized in a horizontal position with respect to the Earth-fixed coordinate
system during the flight within a range of ±6◦ pitch and roll angle. The time
resolu-tion of both instruments was less than 1 s. During the second INSPECTRO campaign the Photo Diode Array (PDA) was replaced by a Charge Coupled Device (CCD). This new development of ZEISS (Oberkochen, Germany) enabled a higher sensitivity in the
5
UV-B resulting in an extension of the reliable spectral range between 290 and 650 nm, as well as a higher time resolution. In addition, the sampling time was decreased to 100 ms which corresponds to 6 m spatial resolution for an aircraft flight velocity of 60 m/s (Jaekel et al., 2007).
All spectrometers have been calibrated in absolute irradiance units (W m−2 nm−1)
10
using a 1000 W tungsten halogen Lamp (Manufactured by OMTec GmbH, Teltow, Ger-many, lamp no. 28), which is traceable to an absolute level (PTB-SL 144) maintained at PTB (Physikalisch-Technische Bundesanstalt, Braunschweig, Germany) with an abso-lute accuracy of ±3% in the wavelength range between 400 nm and 770 nm and ±5% in the spectral regions below 400 nm and above 770 nm. The wavelength averaged
15
FWHM values of all the spectrometers were determined: FWHMAlbedometer=3.0 nm, FWHMAFDM−PDA=2.5 and 2.6 nm, respectively, FWHMAFDM−CCD=1.5 nm. An overall
uncertainty for the spectral irradiance measurements with the Albedometer of ±4% for wavelengths λ=400–700 nm and of ±6% for λ<400 nm and λ>770 nm was estimated (Wendisch and Mayer, 2003). An overall uncertainty of ±8% in the UV range and ±5%
20
in the visible spectral range were given for the AFDM by J ¨akel et al. (2005).
Aerosol particle size distributions for particle diameters between 0.1 and 1 µm were sampled with a commercial Passive Cavity Aerosol Spectrometer Probe (PCASP-X, manufactured by Particle Measuring Systems, Inc., Boulder, CO, USA). From these distributions the effective particle radius and particle number concentration were
de-25
rived. Details of the calibration and data processing can be found in Keil et al. (2001). A Particle Volume Monitor (PVM) was used to measure the liquid water content (LWC) for droplets with diameters below 30 µm and with a measurement uncertainty of about 10%. The droplet size distribution measurements were performed for droplet diameters
ACPD
7, 13417–13473, 2007 Influence of clouds
on the spectral actinic flux density
S. Thiel et al. Title Page Abstract Introduction Conclusions References Tables Figures ◭ ◮ ◭ ◮ Back Close
Full Screen / Esc
Printer-friendly Version Interactive Discussion
EGU below 40 µm with the Fast Forward Scattering Spectrometer Probe (Fast-FSSP). The
accuracy of the effective radius derived from the FSSP measurements was within 5%. In addition a constant temperature hot wire Nevzorov probe manufactured by SkyTech Research Inc. (Toronto, Canada) was used for LWC and total water content (TWC) measurements in the range between 0.003 gm−3and 3 gm−3.
5
Partenavia PG:
The main task of the Garmisch-Partenavia during the INSPECTRO campaigns was to measure spectral actinic flux within, between and above the clouds. The corre-sponding spectroradiometer system (METCON, Glash ¨utten, Germany) is based upon two photo diode array spectrographs (ZEISS, Oberkochen, Germany) with a FWHM
10
of approx. 2.1 nm and a 0.83 nm pixel distance in the range of 250 to 700 nm. Both spectrographs were temperature stabilized in one box at (20±1)◦C. The entrance slits
were connected to the actinic heads using a quartz fibre. Both heads were mounted in a fixed position on top of the aircraft between the wings (PGD, downward flux) and at the bottom of the aircraft (PGU, upward flux), respectively. The time to measure
15
one spectrum was in the range of 3 s. This has lead to a horizontal resolution of the radiation measurements of approximately 170 m assuming a ground speed of approx-imately 55 m/s. The spectroradiometer was calibrated in the laboratory with a 1000 W FEL lamp which was traceable to a secondary standard of the Physikalisch-Technische Bundesanstalt (PTB, Braunschweig, Germany). The installation into the aircraft was
20
possible without dismounting the fibres or other parts of the system. However, the cal-ibration was checked against the other spectroradiometers during the intercomparison period of the campaigns. A self constructed broadband instrument measuring down-ward flux of photolysis frequencies of NO2 was used for reasons of quality control of the spectroradiometer data.
25
The cloud droplet size distribution was measured with a forward scattering probe (FSSP-100; Knollenberg, Boulder, Colorado) in the size range of 0.5–47 µm in 20 size bins. The time resolution of the measurements was approximately 10 s. The calibration
ACPD
7, 13417–13473, 2007 Influence of clouds
on the spectral actinic flux density
S. Thiel et al. Title Page Abstract Introduction Conclusions References Tables Figures ◭ ◮ ◭ ◮ Back Close
Full Screen / Esc
Printer-friendly Version Interactive Discussion
EGU of the FSSP is performed several times during the campaign using glass beads of
differ-ent sizes. Up to 100 glass beads of well defined sizes were passed through the FSSP by a vacuum cleaner mounted at the rear of the FSSP. The airborne measurement of the backscattering coefficient of the aerosols was performed with a nephelometer (TSI inc., St. Paul, MN, USA) measuring at the three wavelengths (450±40) nm, (550±40)
5
nm and (700±40) nm. The time resolution was 6 s. Cessna (C):
On board the Cessna 182 light aircraft an Optronic 742 wavelength-scanning spectro-radiometer (GBR) was installed. The spectrospectro-radiometer was mounted in a temperature stabilised box. The instrument deployment has been described by Webb et al. (2000).
10
A bifurcated fibre is used to sample the irradiance from upward and downward point-ing cosine response input optics. The signal from up and down pointpoint-ing fibres was alternated at the entrance slit to the double monochromator so that the sampling se-quence during a scan was alternated between up and down at a certain wavelength. The monochromator has a spectral slit function with a FWHM of 1.5 nm. The Optronic
15
742 was calibrated using a 200 W transfer standard traceable to the National Insti-tute for Standards and Technology (NIST). The 200 W lamps were used during the campaigns to check the absolute calibration and allow for correction before the data were submitted. The wavelength alignment of the monochromator was also frequently checked using a mercury lamp and was within 0.1 nm. During this project the scans
20
were in 10 nm steps from 300 nm to 500 nm. The time required for one scan (up and down) was less than 2 min, during which time the aircraft travelled approximately 7 km. The monochromator was set from time to time to a single wavelength and alternated continuously between the upward and downward inputs at the designated wavelength. Also mounted on the Cessna during the campaign in Straubing was a two-channel
25
Photodiode array spectrometer (GBE/GBS) with a pair of 2π actinic heads (METCON inc., Glash ¨utten, Germany). Unlike the cosine head which weights the incoming radi-ation with the cosine of the angle of incidence, an actinic head provides un-weighted
ACPD
7, 13417–13473, 2007 Influence of clouds
on the spectral actinic flux density
S. Thiel et al. Title Page Abstract Introduction Conclusions References Tables Figures ◭ ◮ ◭ ◮ Back Close
Full Screen / Esc
Printer-friendly Version Interactive Discussion
EGU data from the upper hemisphere (2π). The head is attached via two 5 m long quartz
fibres to a pair of solid state single monochromators mounted in a standard 19” rack sized box. The spectrometer scans both channels from 290 to 700 nm simultaneously with both heads having slit functions with a FWHM of (2.2±0.1) nm. The two 2π sensor heads were mounted with one facing upwards (GBS) and the other downwards (GBE)
5
on the aircraft to measure the total 4π actinic flux. To prevent an overlap of the fields of view, shadow bands were fitted to both heads. The spectrometer was operated in simultaneous mode during the flights producing 3 pairs of spectra every 10 s with three different integration times (300, 600 and 800 ms). The spectroradiometers were cali-brated using a 200 W transfer standard traceable to NIST. In addition the spectrometer
10
calibration was checked at the beginning and end of the campaign and no significant changes were observed. The wavelength alignment was measured during the absolute calibration checks.
2.3 Ground based instrumentation
The ground-based instrumentation mainly consisted of spectroradiometer systems for
15
the measurement of spectrally resolved actinic flux and irradiance. From the tech-nical point of view the spectroradiometers can be divided into two groups: scanning systems and diode array systems. The advantage of the diode array systems be-side robustness and low costs is a time resolution within a few seconds per spectrum (e.g. 290–600 nm) compared to scan times of approximately 6 min for the scanning
sys-20
tems. Especially during periods of rapidly changing weather conditions and particularly for airborne measurements this advantage is very important.
Additionally meteorological parameters like cloud type and cloud cover have been obtained from sky images as well as aerosol properties in the cloud free regimes by lidar measurements. During the first campaign direct measurement of free radicals
25
and other chemical parameters at the surface were performed to allow a comparison of measured and calculated radical concentrations.
spec-ACPD
7, 13417–13473, 2007 Influence of clouds
on the spectral actinic flux density
S. Thiel et al. Title Page Abstract Introduction Conclusions References Tables Figures ◭ ◮ ◭ ◮ Back Close
Full Screen / Esc
Printer-friendly Version Interactive Discussion
EGU tral irradiance was measured at each site simultaneously to detect short term changes
of the actinic flux instrument. Additionally a quality control measure was provided by mobile reference systems travelling from site to site to check the long-term stability of the spectroradiometer systems.
2.3.1 Spectroradiometer systems
5
This section provides a detailed description of all spectroradiometer systems deployed for ground based measurements during the campaigns and introduces the abbrevia-tions used further on in the paper.
ATI: The DTM 300 of Bentham (Bentham inc., Reading, UK) consists of a double monochromator with 300 mm focal length and two sets of holographic gratings with
10
1200 and 2400 rules/mm respectively. With the 1200 rules/mm grating the slitwidth (FWHM) is 0.96 nm and the wavelength uncertainty is less than 0.1 nm. The input optics for the measurement of global irradiance and actinic flux were connected to the spectroradiometer via a Y-shaped fibre. Moreover both input optics were equipped with a shutter that opens and closes the entrance of the fibre inside the heads. With this
15
setup it was possible to measure global irradiance and actinic flux at each wavelength step within seconds, so the measurements were almost simultaneous. This minimizes differences in both radiation quantities that are due to changing conditions. Global irra-diance was detected with a specially shaped teflon diffuser to minimize the cosine er-ror (http://www.photobiology.com/UVR98/schreder/index.htm). The usual wavelength
20
range of the measurements was between 280 and 600 nm. The signal was detected with a photomultiplier operated at 600 V, which gives a lower limit for irradiance of about 10−6m−2nm−1. The absolute calibration of the spectroradiometer was based on a 1000 W halogen lamp, traceable to the Physikalisch Technische Bundesanstalt (PTB, Braunschweig, Germany). The Bentham instrument also measured the direct
25
irradiance with a custom optic with a field of view about 1.5◦. For an absolute calibra-tion of the direct spectral irradiance a 1000 W calibrated lamp source was posicalibra-tioned at a distance of about 3 m. To obtain the irradiance of the lamp at this distance, the
ACPD
7, 13417–13473, 2007 Influence of clouds
on the spectral actinic flux density
S. Thiel et al. Title Page Abstract Introduction Conclusions References Tables Figures ◭ ◮ ◭ ◮ Back Close
Full Screen / Esc
Printer-friendly Version Interactive Discussion
EGU irradiances from the calibration certificate were scaled by the inverse square law.
Dur-ing the first campaign the spectroradiometer system was placed at Weybourne and at Buchhofen during the Bavarian campaign.
GRT : The Brewer spectroradiometer was operated by the University of Thessaloniki (LAP-AUTH) at Spiegelau (Bavaria), respectively. The heart of the system is a double
5
monochromator consisting of two identical spectrometers equipped with holographic diffraction gratings (3600 lines/mm) operating in the first order. The operational spec-tral range of the instrument for the global irradiance measurements is 287.5–366 nm, and its spectral resolution was 0.55 nm at full width at half maximum (FWHM). De-tails on the operation, the calibration for the global irradiance and total column ozone
10
measurements are given in Bais et al. (1996).
DEG: This spectroradiometer system bases on a double monochromator DTM300 from Bentham instruments (Bentham inc., Reading, UK ) with a focal length of 300 mm, a turret for the use of up to three gratings (2400 lines/mm, 1200 lines/mm and 600 lines/mm) as well as two exit slits after the second monochromator. The use of a
15
photomultiplier, type 9205QB from EMI and a Si-photodiode in combination with the choice of the different gratings enables coverage of the spectral range between 200 and 1100 nm for the measurements. The measured full width at half maximum (FWHM) of the slit function was 0.96 nm. The entrance optics for the measurement of global irradiance consisted of a self constructed head in combination with a commercially
20
available diffuser (Bernhard and Seckmeyer, 1997). In order to measure the spectral actinic flux density a 2π actinic head manufactured by METCON was used (METCON inc., Glash ¨utten, Germany). Both of the former entrance optics were coupled to the 2Way-SAM (switching mirror; Bentham, Reading, UK) to allow rapid switching between both values. Each entrance optic was coupled by a quartz fiber to the monochromator.
25
The third entrance of the monochromator was used for the measurement of direct irradiance in combination with a self constructed entrance optic and a 2AP solar tracker (Kipp&Zonen, Delft, Netherlands) to follow the sun. The spectroradiometer system was temperature stabilized at (20±0.5)◦C. The calibration was performed with a 100 W
ACPD
7, 13417–13473, 2007 Influence of clouds
on the spectral actinic flux density
S. Thiel et al. Title Page Abstract Introduction Conclusions References Tables Figures ◭ ◮ ◭ ◮ Back Close
Full Screen / Esc
Printer-friendly Version Interactive Discussion
EGU working standard within a lamp house specially designed for field calibrations. The
working standard was calibrated with a collective standard based on three calibrated 1000 W FEL lamps provided by the German Physikalisch Technische Bundesanstalt (PTB, Braunschweig, Germany). The expanded uncertainty (comp. to the 2σ level) for measurements of global spectral irradiance varies between 6.3% in the UVA and
5
12.7% at 300 nm and 60◦ solar zenith angle (Bernhard and Seckmeyer, 1999). The
spectroradiometer system was set up at Briston during the first campaign and during the second campaign at F ¨urstenzell.
GBM: The Manchester Bentham DTM300 (Bentham inc., Reading, UK) was used during both INSPECTRO campaigns at Beeston Regis (UK) and at Straubing airport
10
(Germany). The double monochromator was fitted with two input optics via fibre op-tic light guides: a METCON 2π actinic head (METCON inc., Glash ¨utten, Germany) and a Schreder J1002 global head (CMS, Kirchbichl, Austria). Each head could be chosen under software control to perform an actinic flux or global irradiance measure-ment. The instrument was mounted in a temperature stabilised box kept at a constant
15
(25.0±0.3)◦C. For the campaigns the Manchester instrument was calibrated from 290 to 500 nm at 0.5 nm steps for both heads. The FWHM of the slit functions for the actinic and the global head were both 0.7 nm. The calibration of the Bentham was performed in the laboratory in Manchester using a 1000 W traceable to the National Institute of Standards and Technology (NIST, Gaithersburg, MD, USA). Then a 200 W lamp was
20
used as a transfer standard. This was measured after instrument set-up to check cal-ibration at the start, then every two days until the end of campaigns. Changes in the calibration of more than 3% were post corrected and the calibration file corrected for the next day measurements. After the first few days the instrument was always found to be stable. A mercury lamp was used to check initial wavelength alignment, which
25
needed no further adjustment during the campaigns.
NTN: This spectroradiometer system used by the NTNU (Norwegian University of Science and Technology) group measured the global and the direct irradiance at Ayl-sham, East Anglia, and at Eggenfelden, Bavaria. The system consists of a Bentham
ACPD
7, 13417–13473, 2007 Influence of clouds
on the spectral actinic flux density
S. Thiel et al. Title Page Abstract Introduction Conclusions References Tables Figures ◭ ◮ ◭ ◮ Back Close
Full Screen / Esc
Printer-friendly Version Interactive Discussion
EGU DM 150 double monochromator (Bentham inc., Reading, UK) and two optical fibres
of 4.0 m, one measuring direct irradiance and the other global irradiance. During the INSPECTRO campaigns only global irradinace data were used. The optical input used for global irradiance was provided by CMS-Schreder (Diffuser UV-J1002) with a teflon diffuser and cosine error less than 3% for incidence angles between 0◦ an 70◦. The
5
optical head is installed in a heater system. Calibration of the spectroradiometer was performed with a 1000 W FEL standard lamp (Optronic Laboratories Inc., Orlando, FL, USA). Wavelength calibration was performed using two strong lines from a mercury lamp. The spectroradiometer slit function was measured with a He-Cd laser (325 nm), and applied in the data analyses. The wavelength accuracies of the solar spectra were
10
checked with respect to Fraunhofer lines using the software SHICrivm (Slaper et al. 1995). The global irradiance measurements were performed from 290 nm to 500 nm in steps of 0.5 nm. The second quartz fibre connected to the monochromator was equipped with a direct sun optic from Bentham consisting of a 20 cm tube with a di-ameter of 4 cm and baffles every 5 cm. The entrance optic was mounted to the quartz
15
fibre and is attached to a tracking system with two microstepping motors for azimuth and zenith direction.
DED/DEM: Each spectrometer was based on a single monochromator with no mov-ing parts (ZEISS, Oberkochen, Germany). Made from ceramics/glass, the monochro-mator had negligible sensitivity to temperature changes. This resulted in very stable
20
wavelength settings. The spectrometer also had an extremely fast response time. It used a 512 pixel diode array detector with a spatial resolution of ca 0.85 nm (pixel-distance) and an FWHM of ca. 2.1 nm. The spectrometer system allowed to determine ozone photolysis rates within 2 s, depending on the solar elevation as well as calculat-ing the photolysis rates for J(O1D), J(CHO), J(NO2), J(HONO), and J(NO3). A 1000 W
25
FEL-lamp, which is traceable to the Physikalisch Technische Bundesanstalt (PTB) was used for the calibration.
FZJ: The FZJ spectroradiometer system was described in detail by Hofzumahaus et al. (1999). During the second INSPECTRO campaign the system was used at
Spiege-ACPD
7, 13417–13473, 2007 Influence of clouds
on the spectral actinic flux density
S. Thiel et al. Title Page Abstract Introduction Conclusions References Tables Figures ◭ ◮ ◭ ◮ Back Close
Full Screen / Esc
Printer-friendly Version Interactive Discussion
EGU lau to measure the spectral actinic flux density. The main components are an actinic
flux quartz receptor optic, a 10 m quartz fiber, a double-monochromator DTM300 of Bentham (Bentham inc., Reading, UK), and a UV sensitive photomultiplier tube con-nected to a dc amplifier (Bentham 267). Absolute calibration is made with a PTB trace-able 1000 W Tungsten Lamp Osram Sylvania (Gigahertz Optik, Puchheim, Germany)
5
prior to and after the campaign. Field calibration was made with four 45 W secondary standards (Optronics), typically every 3–5 days with at least two lamps at a time. Wave-length positions were checked with a low pressure Hg-lamp using 4–5 lines in the range 295–550 nm. The FWHM was 0.95 nm. With a step size of 0.5 nm, scanning times of about 4 min resulted for the 290–500 nm scanning range.
10
RJB: The RJB system consists of a diode array spectroradiometer (Meteorologie Consult GmbH, Glash ¨utten, Germany) and using a quartz entrance optic to measure the spectral actinic flux density. The collected light is dispersed using a monolithic single monochromator (ZEISS, Oberkochen, Germany) and detected by a 512 pixel diode array (Hamamatsu Photonics, Japan). A 280–700 nm wavelength range is
cov-15
ered at a pixel width of 0.83 nm and a nominal resolution of 2.1 nm. In a wavelength range below about 315 nm stray light limits the precision of measurements under at-mospheric conditions. During the Bavarian campaign the system was operated on top of the Brotjacklriegel mountain.
QASUME: The QASUME spectroradiometer was used as a mobile reference
sys-20
tem for spectral irradiance measurements during the first campaign in UK. The system consists of a commercially available Bentham DM-150 double monochromator with an effective focal length of 2×150 mm and a 2400 lines/mm grating. The wavelength range is 250 to 500 nm and the entrance and exit slit width was chosen to yield a near triangular slit function with a full width at half maximum resolution of about 0.8 nm.
25
The smallest wavelength increment is 0.0025 nm. The spectroradiometer has two en-trance ports which can be selected by a remotely controlled internal mirror. The solar irradiance is sampled through a specially designed entrance optic (Model UV-J1002, CMS-Schreder, Kirchbichl, Austria) which is connected to one port of the
spectrora-ACPD
7, 13417–13473, 2007 Influence of clouds
on the spectral actinic flux density
S. Thiel et al. Title Page Abstract Introduction Conclusions References Tables Figures ◭ ◮ ◭ ◮ Back Close
Full Screen / Esc
Printer-friendly Version Interactive Discussion
EGU diometer through a quartz fiber. The second entrance port holds a pencil ray Mercury
lamp (Model 6035, Oriel, Darmstadt, Germany) which is used to check the wavelength setting of the spectroradiometer. Up to September 2003 a side-window type photo-multiplier (PMT) was used as detector, and then it was replaced with an end-window type bi-alkali PMT (Electron tubes 9250QB). The photocurrent is measured with a six
5
decade current amplifier, integrated for a 100 ms time window, digitised and transferred to a computer for further data treatment and storage. The irradiance scale of the QA-SUME spectroradiometer is based on a number of 1000 W FEL type tungsten halogen lamps traceable to the primary radiation standard held at the Physikalisch-Technische Bundesanstalt (PTB) in Braunschweig, Germany. Since the instrument is designed for
10
outdoor solar measurements, the whole spectroradiometer system including the data acquisition electronics are contained in a temperature controlled box which is stabilised to a predetermined temperature with a precision of 0.5 K. A more detailed description of the reference spectroradiometer system and the results of its performance from 2002 to 2004 is given by Gr ¨obner et al. (2005) and Gr ¨obner et al. (2006), respectively.
15
2.3.2 Ancillary instruments
Ancillary measurements were performed to characterize the atmospheric conditions during the campaigns regarding the meteorological conditions, the vertical distribution and the optical depth of the aerosols, air chemical parameters as well as cloud pa-rameters. In addition the spectral measurements were complemented by fast sampling
20
broadband instruments such as pyranometer, Biometer or other photoelectric detec-tors that measured e.g. the photolysis frequencies of NO2 or O3. All this information was needed for data analysis, data mining and quality assurance.
Radiation (broadband instruments and filterradiometers)
While the spectral information and the accuracy of broadband radiometer systems are
25
ACPD
7, 13417–13473, 2007 Influence of clouds
on the spectral actinic flux density
S. Thiel et al. Title Page Abstract Introduction Conclusions References Tables Figures ◭ ◮ ◭ ◮ Back Close
Full Screen / Esc
Printer-friendly Version Interactive Discussion
EGU but mostly slower spectral instruments. Three Pyranometers (CM11 and CM21, Kipp &
Zonen, Delft, Netherlands) were used to measure the total global irradiance on a plane surface resulting from radiant fluxes in the wavelength range from 0.3 to 3 micrometers. The response time of the instruments was 5 s while data are recorded as averages of 1 min intervals. The UVB-1 Pyranometer of Yankee Environmental Systems (YES,
5
Turners Falls, MA, USA) has measured the radiation received by a horizontal surface from the entire hemisphere of the sky from 280 to 320 nm. The instrument produced a high level 0–4 VDC output signal and was thermally stabilized for long term reference-grade measurements. The UV Biometer (v. 501, Solar Light inc., PA, Philadelphia, USA) was used to measure erythemally weighted irradiance with a time resolution of
10
1 min.
During the second campaign the multichannel radiometer GUV- 541 from Biospher-ical Inc. (San Diego, CA, USA) was used as a mobile reference instrument for spec-tral irradiance measurements (GUV). The filterradiometer has five channels at 305 nm (7 nm bandwidth), 313 nm (11 nm bandwidth), 320 nm, 340 nm and 380 nm (all with 10
15
nm bandwidth). The instrument logged the global irradiance every 1s. The detector was temperature stabilized at 40◦C. The instrument was calibrated against the NTN
spectroradiometer system (simultaneous measurement).
Further filter radiometers were used to measure J(NO2) and J(O1D) directly. The ra-diometers were manufactured by METCON (METCON inc., Glash ¨utten, Germany) and
20
utilize similar entrance optics as the scanning spectroradiometer FZJ. The filter instru-ments measured integrated spectral actinic flux in a selected wavelength range. The relative spectral sensitivity was selected to reproduce the wavelength dependencies of the products of absorption cross sections and quantum yields of the photolysis pro-cesses. The devices thus produced signals proportional to the photolysis frequencies.
25
Laboratory characterisations and field or laboratory calibrations allow a calculation of photolysis frequencies. More details on the technique can be found elsewhere (Junker-mann et al., 1989; Volz-Thomas et al., 1996; Bohn et al., 2004). Filterradiometer sig-nals were recorded every 5 s providing high resolution complementary information on
ACPD
7, 13417–13473, 2007 Influence of clouds
on the spectral actinic flux density
S. Thiel et al. Title Page Abstract Introduction Conclusions References Tables Figures ◭ ◮ ◭ ◮ Back Close
Full Screen / Esc
Printer-friendly Version Interactive Discussion
EGU rapid changes of external conditions.
Aerosols and clouds
A mobile lidar VELIS (VEhicle-mounted LIdar System) and two LD-40 lidar-ceilometer (VAISALA, Vantaa, Finland) were employed to provide range and time-resolved infor-mation on aerosol and cloud properties during the INSPECTRO campaigns. During
5
the first campaign in East Anglia only VELIS was used. The instrument was located at the core site of Weybourne. In 2004 the VELIS was installed at the core site of Buchhofen. The VAISALA LD-40 lidar-ceilometers were installed at the mountain site of Spiegelau, and at F ¨urstenzell.
The VELIS lidar was developed at ISAC to retrieve calibrated profiles of aerosol
10
backscatter and extinction coefficients, plus depolarization ratio, at 532 nm between 200 m and 20 km above ground level (a.g.l.). Each VELIS profile was obtained af-ter averaging the returns of 6000 laser shots, corresponding to 6.6 min. Calibrations were performed against climatological molecular density profiles from radio-sounding records of nearby airports. One profile every 15 min was retrieved during the campaign
15
flights. A thorough description of the VELIS inversion procedure and errors of the re-trieved backscatter and extinction coefficients can be found in Gobbi et al. (2003). A series of aerosol models (Barnaba and Gobbi, 2001 and 2004) has been implemented to invert the lidar signal and retrieve aerosol properties as extinction coefficient, surface area and volume. Other parameters retrieved by the lidar analysis are the
backscat-20
ter ratio and the linear depolarization ratio. The backscatter ratio relates the amount of aerosol/cloud backscatter to the molecular one. The depolarization ratio was used to discriminate non-spherical (That is solid) particles as dust or cirrus clouds (typical depolarization ∼40–60%) from spherical ones as liquid aerosols or cloud droplets (typ-ical depolarization of ∼1–5%) (Gobbi et al., 2003). Information on planetary boundary
25
layer (PBL) height plus cloud base and top heights was also retieved from the VELIS observations by visual analysis of single profiles. In particular, the PBL height was determined as the level of the first change in slope (minimum in signal derivative) of
ACPD
7, 13417–13473, 2007 Influence of clouds
on the spectral actinic flux density
S. Thiel et al. Title Page Abstract Introduction Conclusions References Tables Figures ◭ ◮ ◭ ◮ Back Close
Full Screen / Esc
Printer-friendly Version Interactive Discussion
EGU the backscatter signal (Menut et al., 1999). Cloud bottom is defined at the level of
sharp increase in backscatter, while cloud top is inferred looking at the uppermost level of increased backscatter in regions of reduced cloud optical thickness (usually near cloud gaps). In fact, determining cloud height in optically thick, unbroken clouds is not possible for this system.
5
The LD-40 ceilometer was developed by VAISALA to retrieve cloud layers height up to 13 km. This system operated at 855 nm. Cloud base and top, as well as PBL alti-tude were retrieved with an approach similar to the one described for the VELIS lidar. A code for the analysis of the LD40 record implemented at ISAC, provides contour plots of range-corrected signal and the PBL height. Conversely, tropospheric aerosol
10
profiling is not possible with this instrument due to its much lower signal to noise ratio with respect to VELIS. Eggenfelden and Straubing have regular airfields and thus have their own standard deployment of ceilometers. Therefore, with the exception of Brot-jacklriegel, each site was equipped with a ceilometer or a lidar system measuring the cloud base altitude.
15
Several MICROTOPS II sunphotometers (Solar Light inc., Philadelphia, PA, USA) were used to measure aerosol optical depth (AOD) at 440, 500, 670 and 1020 nm as well as precipitable water column and total ozone column, depending on the type of instrument.
Cloud cover and cloud type was determined from the analysis of sky camera pictures
20
and eye observations. In addition eye observations of cloud cover in octas, cloud type and cloud altitude in m were made routinely every hour at the German Weather Service (DWD) stations F ¨urstenzell and Straubing. In addition eye observation was performed at the core sites of each campaign (Weybourne and Buchhofen).
Meteorological and chemical parameters
25
During the first campaign ground-based measurements of chemical parameters were made at Weybourne alongside the measurement of standard meteorological data. These included measurements of peroxy radicals (HO2 and RO2), ozone, carbon
ACPD
7, 13417–13473, 2007 Influence of clouds
on the spectral actinic flux density
S. Thiel et al. Title Page Abstract Introduction Conclusions References Tables Figures ◭ ◮ ◭ ◮ Back Close
Full Screen / Esc
Printer-friendly Version Interactive Discussion
EGU monoxide, nitrogen oxides and peroxides. An overview of the instruments and methods
is given in Penkett et al. (1999) and Green et al. (2006). Observations of wind direction and speed as well as temperature obtained from the ground based systems were used for interpretation of the trace gas measurements and in combination with pyranometer data for deriving cloud geometrical parameters like cloud base size, whilst the other
5
chemical data was used to constrain chemical box model calculations which will be described elsewhere in a forthcoming paper (Claire Reeves, personal communication). During the second campaign only meteorological parameters (wind, temperature and humidity) were measured at Buchhofen, and also obtained from the German Weather Service (DWD) stations Straubing and F ¨urstenzell.
10
3 Campaigns
Instrument intercomparison
During the first week of the first campaign (Norfolk, UK) all the spectroradiometers used at the ground stations, plus the University of Manchester (UMIST) aircraft instrument, were located at the Weybourne site for an instrument intercomparison. This
intercom-15
parison lasted 5 days, 4 to 8 September (day numbers 247–251 of the year), during which a range of sky conditions were encountered, including some clear skies. The weather was predominantly dry but cloud cover could change rapidly in the often windy conditions. To minimize the influence of changing conditions all scans were synchro-nized, with the instruments scanning 290–500 nm in 0.5 nm steps with 3 s per step.
20
Several of the instruments could measure two or more radiation parameters by chang-ing input optics, thus measurements on the full hour were global irradiance, and those on the half hour were actinic flux. Generally the intercomparison started at 07:00 UTC and continued until 18:00 UTC each day. Only the first day began with a few blind scans (each instrument independent of any knowledge of the others). After the first
25
ACPD
7, 13417–13473, 2007 Influence of clouds
on the spectral actinic flux density
S. Thiel et al. Title Page Abstract Introduction Conclusions References Tables Figures ◭ ◮ ◭ ◮ Back Close
Full Screen / Esc
Printer-friendly Version Interactive Discussion
EGU clouds for sufficient time to enable the measurement.
There was also one day of intercomparison at the airport (19 September, day 262) when the QASUME instrument was installed at one side of the apron and the aircraft irradiance instruments mounted alongside, either still installed in the aircraft or removed and placed on the apron. This intercomparison was made during high cloud cover and
5
occasional light rain. The airborne radiation instruments were thus cross-referenced to each other, and the ground based instruments through the QASUME instrument.
During the first week of the second campaign in Germany (GER) all the ground-based and airborne spectroradiometers were located on the airfield of Straubing for an instrument intercomparison. The instruments were mounted on the flat surface of
10
concrete surrounded by grassland or on the roofs of the cabins housing the personnel and control computers, or in their respective aircraft. The intercomparison lasted 5 and half days between 6 and 11 May (days 127–132 of the year). During this time period mainly broken cloud and overcast conditions with occasional rain occurred.
Main campaign
15
After intercomparison, equilibration and calibration checks of the instruments the mea-surement program began for the first campaign on 12 September (day 255 in 2002) and on 14 May (day 135 in 2004) for the second campaign, respectively. All ground based measurements were performed between 08:00 to 18:00 local time throughout the campaign. Each instrument was allowed to scan at its own best speed. Since
20
conditions were expected to differ at the various sites there was no advantage to syn-chronization and it was better to make the measurement as frequently as possible to capture a particular sky condition. Scan speeds ranged from approximately one step per second to one step per 3 s dependent on instrument. The standard scans were 290–500 nm at 0.5 nm steps (290–550 nm during the second campaign), though some
25
instruments were limited to shorter wavelengths and others had the ability to extend further into the visible. In order to check the long term stability of all instruments inter-comparisons were conducted at each measurement site once the full campaign was
ACPD
7, 13417–13473, 2007 Influence of clouds
on the spectral actinic flux density
S. Thiel et al. Title Page Abstract Introduction Conclusions References Tables Figures ◭ ◮ ◭ ◮ Back Close
Full Screen / Esc
Printer-friendly Version Interactive Discussion
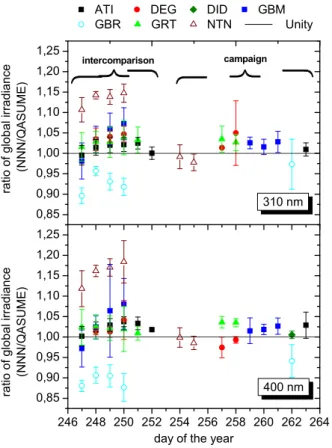
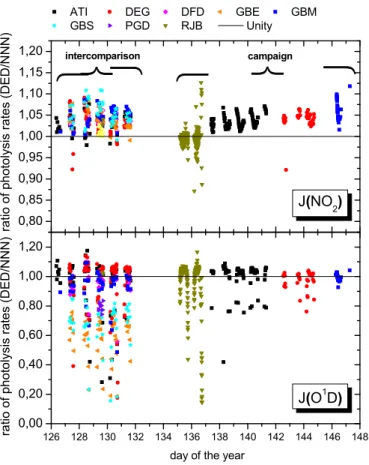
EGU in progress. Therefore, two instruments were chosen as traveling standards for quality
control, one instrument for actinic flux (DED, second campaign) and one instrument for irradiance (QASUME, first campaign and GUV, second campaign).
Two Partenavias, a Cessna and during the first campaign an Ultralight formed the main airborne platforms available for simultaneous flights. For each campaign area
5
a basic flight path was defined around the experimental box shown in Fig. 1 for use in synchronized flights. The flight paths covered the location of the ground stations. During the first campaign the single engine aircrafts (Cessna and microlight) flew close to the coast from the edge of Weybourne to Beeston rather than going out to sea, truncating the tip of the flight triangle. Not all flights were flown to this pattern, the
10
Ultralight in particular had its own flight missions, and the Partenavias sometimes made almost vertical profiles to measure the spectral actinic flux density as a function of altitude.
4 Data products and simulations
Data homogenization
15
Homogenization procedures are important to ensure that measurements from all in-struments are intercomparable, independent of the instrument type or resolution. This mainly results in correction procedures e.g. for an instrumental wavelength shift, a co-sine response error or stray-light errors. Differences in the slit-function between the instruments and inaccuracies in wavelength settings (calibration, instrument
character-20
istics) were corrected using the ShicRIVM algorithm (Slaper et al., 1995). A correction of the wavelength shift and deconvolution of the measured spectra to standardized 1 nm FWHM spectra was performed. The major post correction procedures used for the spectral instruments GBE and GBS were on the J(O1D) photolysis rates derived from the Cessna airborne actinic flux data. Due to the lack of sensitivity of the PDA
25
de-ACPD
7, 13417–13473, 2007 Influence of clouds
on the spectral actinic flux density
S. Thiel et al. Title Page Abstract Introduction Conclusions References Tables Figures ◭ ◮ ◭ ◮ Back Close
Full Screen / Esc
Printer-friendly Version Interactive Discussion
EGU veloped by J ¨akel et al. (2005) was used. For similar reasons a correction procedure
was applied for the spectral actinic flux measurements of the instruments DED, DEM and DFD/DFU.
Photolysis frequencies, aerosol optical depth and total ozone column
The photolysis frequency J in s−1 of a substance was calculated on the basis of the
5
measured or simulated spectral actinic flux density in photons m−3 s−1 as described
e.g. in Madronich (1987). Our work set the focus on the photolysis of ozone and nitro-gen dioxide. The photolysis rates of the corresponding photo-dissociation processes were calculated using the quantum yields from Matsumi et al. (2002) and Troe (2000) as well as the absorption cross sections from Daumont et al. (1992) and Merienne et
10
al. (1995), respectively.
For the direct spectral irradiance and the aerosol optical depth retrieval following the methodology described in Marenco et al. (1997), the absolute calibrated direct irradi-ance spectral measurements (BREWER instrument) in the range 290–365 nm and in steps of 0.5 nm was used. The spectral aerosol optical depth was determined by
com-15
paring the measured cloud-free spectral direct irradiance at the surface to the direct irradiance which was calculated from the transfer of the high resolution extraterrestrial spectrum ATLAS 3 (VanHoosier, 1996) through the atmosphere using Beer’s law and accounting only for molecular absorption (mainly O3 and SO2) and Rayleigh scatter-ing. The method that was used to calibrate the direct irradiance spectra for the GRT
20
spectroradiometer is described in Kazadzis et al. (2005). The Rayleigh optical depth was calculated according to Hansen and Travis (1974) or Bodhaine et al. (1999) and the ozone cross sections were taken from Bass and Paur (1985).
Ground albedo and Satellite information
The airborne instruments measured the spectrally resolved effective albedo at a certain
25
ACPD
7, 13417–13473, 2007 Influence of clouds
on the spectral actinic flux density
S. Thiel et al. Title Page Abstract Introduction Conclusions References Tables Figures ◭ ◮ ◭ ◮ Back Close
Full Screen / Esc
Printer-friendly Version Interactive Discussion
EGU downward looking entrance optics to the irradiance incident on the upward looking
entrance optics. Since there is a layer of atmosphere between the surface and the actual place of aircraft this effective albedo is a combination of the inhomogeneous albedo of the surface and reflection by the intervening atmospheric layer at a certain altitude above ground. In order to derive the spectral ground albedo the measured
5
data were linearly extrapolated to the surface (Webb et al., 2004). This method has proved valid in clean air conditions. Another method uses the radiation transfer model UVSPEC to remove the effect of the atmospheric layer between the surface and the measurement altitude. Details of this method are described by Wendisch et al. (2003). Space-borne composite pictures (METEOSAT, MODIS) were used to prepare the
10
flight plans and to define the airborne measurement schedule. AVHRR data was used to derive the cloud cover in a spatial resolution of approx. 1x1 km. While their spatial resolution is relatively coarse, their main advantage is area coverage.
Total cloud cover was provided by the European Cloud Climatology (ECC) data base. The cloud products base on NOAA/AVHRR data and were derived by the AVHRR
15
Processing scheme Over cLouds, Land, and Ocean (APOLLO) including a careful quality control (Meerk ¨otter et al., 2004). An important characteristic of the ECC is its high spatial resolution of approximately 1.1×1.1 km2in latitude and longitude, respec-tively. This high resolution allowed the direct comparison with surface observations.
In addition to ground based measurements of the total ozone column, particularly
20
under overcast conditions, the data from the EP-TOMS instrument was used (http: //toms.gsfc.nasa.gov/index v8.html).
1-D radiation transfer model
The actinic flux profiles were simulated using the multi-stream discrete ordinates ra-diative transfer equation solver DISORT2 based on Stamnes et al. (1988) within the
25
libRadtran software package version 1.0 (Mayer and Kylling, 2005). For all simulations a cloudless US standard atmosphere (Anderson et al., 1986) were assumed. Spec-tral surface albedos were measured from a low-flying aircraft at each campaign site.
ACPD
7, 13417–13473, 2007 Influence of clouds
on the spectral actinic flux density
S. Thiel et al. Title Page Abstract Introduction Conclusions References Tables Figures ◭ ◮ ◭ ◮ Back Close
Full Screen / Esc
Printer-friendly Version Interactive Discussion
EGU The ozone layer thicknesses were derived from direct irradiance measurements. The
aerosol optical depth is given by τ = β*λ−α where β denotes the ˚Angstr ¨om turbidity
coefficient and λ the wavelengths in micrometers. The ˚Angstr ¨om exponent α was set to 1.3. A spring/summer aerosol profile (Shettle, 1989) was used containing rural tro-pospheric aerosol from MODTRAN 3 (Abreu and Anderson, 1996). Only background
5
conditions of stratospheric aerosols were assumed (from MODTRAN 3). Photolysis rates of O3and NO2were computed at a fixed temperature of 298 K using the absorp-tion cross secabsorp-tions described above. The Solar Ultraviolet Spectral Irradiance Monitor (SUSIM) extraterrestrial solar spectrum measured on board the Space Shuttle during the ATLAS 3 mission in November 1994 (Van Hoosier, 1996) was applied. All actinic
10
flux density simulations accounted for the instrumental spectral response functions. 3-D radiation transfer model
For the 3-D radiative transfer calculations during the project the MYSTIC (Monte Carlo code for the physically correct tracing of photons in cloudy atmospheres) model was used (Mayer, 2000; Mayer and Kylling, 2005). For calculations in the spectral range
15
of interest the following components are required: (1) a description of the background atmosphere including the profiles of pressure, temperature, and ozone concentration (which are basically available from routine observations); (2) three-dimensional cloud data sets and (3), the surface albedo or the Bidirectional Reflectance Distribution Func-tion (BRDF) which could technically be parameterized via the three-parameter formula
20
of Rahman et al. (1993). Homogenized data sets have been prepared for all campaign days where sufficient aircraft observations were available, in total 6 days for the first campaign in Norwich, UK and 3 days for the second campaign in Straubing, Germany. The model accuracy was determined only by the number of photons. As the Monte Carlo method is a statistical technique, the uncertainty (standard deviation)
25
of the result is proportional to the inverse square root of the number of photons traced. Comparisons for one-dimensional geometries using 109 photons have shown an agreement between MYSTIC and the one-dimensional DISORT code (Stamnes et
ACPD
7, 13417–13473, 2007 Influence of clouds
on the spectral actinic flux density
S. Thiel et al. Title Page Abstract Introduction Conclusions References Tables Figures ◭ ◮ ◭ ◮ Back Close
Full Screen / Esc
Printer-friendly Version Interactive Discussion
EGU al., 1988) of better than 0.01% (which was less than the MYSTIC statistical
uncer-tainty for this photon number). In the Intercomparison of 3-D radiation codes (I3RC, http://climate.gsfc.nasa.gov/I3RC), a core group of about 6 models including MYSTIC agreed within typically 0.1–1% for several inhomogeneous cloud cases.
The calculation of irradiances in a Monte Carlo code is straightforward, by counting
5
photons passing through a given area, normalising the sum of photon weights to the number of photons incident at the top of the atmosphere, and multiplying with the extraterrestrial irradiance. The calculation of actinic flux density, however, requires weighting each photon with a factor 1/cosθ where θ is the polar angle of the photon passing through the plane. Within the framework of INSPECTRO, Scheirer and Mayer
10
introduced a new method to calculate the actinic flux density, using the fact that the energy absorbed per unit time is simply the product of the actinic flux density and the absorption coefficient (Madronich, 1987; Mayer and Madronich, 2004). Hence, an alternative method to calculate the actinic flux density is to count the absorbed photons in each grid cell and to divide it by the absorption coefficient. The new method
15
was implemented, tested, and found to perform considerably better than the original algorithm.
Generation of a 3-D cloud field
Clouds vary significantly in space and time. A 3-D retrieval of clouds from aircraft observations is a great challenge. Until now measurements could not provide the
com-20
plete three-dimensional cloud structure but only point observations along the aircraft path. If the latter is carefully chosen, and if the cloud stays reasonably constant during the flight, the derivation of the cloud field is possible, or at least the derivation of a cloud field with statistical properties identical to those observed along the flight path. During INSPECTRO we were able to follow both methods, (1) to generate a cloud field which
25
reproduces the observations along the flight path and is statistically similar otherwise; and (2) a cloud field which closely resembles the actual geometrical distribution, by combining the aircraft observations with high-resolution satellite remote sensing.