HAL Id: hal-00297841
https://hal.archives-ouvertes.fr/hal-00297841
Submitted on 9 Aug 2006HAL is a multi-disciplinary open access
archive for the deposit and dissemination of sci-entific research documents, whether they are pub-lished or not. The documents may come from teaching and research institutions in France or abroad, or from public or private research centers.
L’archive ouverte pluridisciplinaire HAL, est destinée au dépôt et à la diffusion de documents scientifiques de niveau recherche, publiés ou non, émanant des établissements d’enseignement et de recherche français ou étrangers, des laboratoires publics ou privés.
The significance of nitrogen fixation to new production
during early summer in the Baltic Sea
U. Ohlendieck, K. Gundersen, M. Meyerhöfer, P. Fritsche, K. Nachtigall, B.
Bergmann
To cite this version:
U. Ohlendieck, K. Gundersen, M. Meyerhöfer, P. Fritsche, K. Nachtigall, et al.. The significance of nitrogen fixation to new production during early summer in the Baltic Sea. Biogeosciences Discussions, European Geosciences Union, 2006, 3 (4), pp.1279-1311. �hal-00297841�
BGD
3, 1279–1311, 2006 Significance of nitrogen fixation in early summer U. Ohlendieck et al. Title Page Abstract Introduction Conclusions References Tables Figures J I J I Back CloseFull Screen / Esc
Printer-friendly Version Interactive Discussion
Biogeosciences Discuss., 3, 1279–1311, 2006 www.biogeosciences-discuss.net/3/1279/2006/ © Author(s) 2006. This work is licensed
under a Creative Commons License.
Biogeosciences Discussions
Biogeosciences Discussions is the access reviewed discussion forum of Biogeosciences
The significance of nitrogen fixation to
new production during early summer in
the Baltic Sea
U. Ohlendieck1, K. Gundersen2,*, M. Meyerh ¨ofer1, P. Fritsche1, K. Nachtigall1, and B. Bergmann2
1
Leibniz Institut f ¨ur Meereswissenschaften, D ¨usternbrooker Weg 20, 24105 Kiel, Germany
2
Department of Botany, Stockholm University, Lilla Frescativ ¨agen 5, 10691 Stockholm, Sweden
*
now at: Bigelow Laboratory for Ocean Sciences, McKown Point, P.O. Box 475, West Boothbay Harbour, ME 04575, USA
Received: 8 May 2006 – Accepted: 28 May 2006 – Published: 9 August 2006 Correspondence to: U. Ohlendieck (ute.ohlendieck@t-online.de)
BGD
3, 1279–1311, 2006 Significance of nitrogen fixation in early summer U. Ohlendieck et al. Title Page Abstract Introduction Conclusions References Tables Figures J I J I Back CloseFull Screen / Esc
Printer-friendly Version Interactive Discussion Abstract
Rates of dinitrogen (N2) fixation and primary production were measured during two 9 day transect cruises in the Baltic proper in June–July of 1998 and 1999. Assuming that the early phase of the bloom of cyanobacteria lasted a month, total rates of N2fixation contributed 15 mmol N m−2 (1998) and 33 mmol N m−2 (1999) to new production
5
(sensu Dugdale and Goering, 1967). This constitutes 12–26% more new N than other annual estimates (mid July–mid October) from the same region. The between-station variability observed in both total N2fixation and primary productivity greatly emphasize the need for multiple stations and seasonal sampling strategies in biochemical studies of the Baltic Sea. The majority of new N from N2fixation was contributed by filamentous
10
cyanobacteria. On average, cyanobacterial cells >20 µm were able to supply a major part of their N requirements for growth by N2 fixation in both 1998 (73%) and 1999 (81%). The between-station variability was high however, and ranged from 28–150% of N needed to meet the rate of C incorporation by primary production. Since the molar C:N rate incorporation ratio (C:NRATE) in filamentous cyanobacterial cells was almost
15
twice as high as the molar C:N mass ratio (C:NMASS) in both years, we suggest that the diazotrophs incorporated excess C on a short term basis (for carbohydrate ballasting and buoyancy regulation), released nitrogen or utilized other regenerated sources of N nutrients. Measured rates of total N2fixation contributed only a minor fraction of 13% (range 4–24) in 1998 and 18% (range 2–45) in 1999 to the amount of N needed for the
20
community primary production. An average of 9 and 15% of total N2fixation was found in cells <5 µm. Since cells <5 µm did not show any detectable rates of N2fixation, the
15
N-enrichment could be attributed to regenerated incorporation of dissolved organic N (DON) and ammonium generated from larger diazotroph cyanobacteria. Therefore, N excretion from filamentous cyanobacteria may significantly contribute to the pool
25
of regenerated nutrients used by the non-diazotroph community in summer. Higher average concentrations of regenerated N (ammonium) coincided with higher rates of N2fixation found during the 1999 transect and a higher level of15N-enrichment in cells
BGD
3, 1279–1311, 2006 Significance of nitrogen fixation in early summer U. Ohlendieck et al. Title Page Abstract Introduction Conclusions References Tables Figures J I J I Back CloseFull Screen / Esc
Printer-friendly Version Interactive Discussion
<5 µm. A variable but significant fraction of total N2fixation (1–10%) could be attributed to diazotrophy in cells between 5–20 µm.
1 Introduction
Surface blooms of filamentous diazotrophic cyanobacteria are well documented and a recurring phenomenon in the Baltic Sea in summer (cf. Lepp ¨anen et al., 1988). Due
5
to their ability to fix N2, diazotroph cyanobacteria may contribute significantly to the input of new N to the Baltic Sea ecosystem. The contribution of this source of new N has been subject of a number of investigations (e.g. Rinne et al., 1978; Lepp ¨anen et al., 1988; Rahm et al., 2000; Larsson et al., 2001; Wasmund et al., 2001). Our cur-rent knowledge may suggest large-scale regional differences in the abundance of the
10
most common filamentous cyanobacteria in the Baltic Sea, Aphanizomenon sp. and
Nodularia sp. (Kahru et al., 1994; Wasmund, 1997). During peak abundance in
sum-mer, maximum biomass of the filamentous cyanobacteria can be found in the southern and eastern parts of the Baltic proper (Niemist ¨o et al., 1989). Although the filamentous cyanobacteria rarely dominate the autotroph community, conspicuous surface
accumu-15
lations of the buoyant diazotrophs may congregate in wind and current driven rows or patches in coastal and off shore waters of the Baltic Sea (Niemist¨o et al., 1989; Walsby et al., 1995). Larsson et al. (2001) clearly demonstrated the great extent of inter-annual variability in timing and total abundance of filamentous cyanobacteria at an off shore station in the Baltic Sea. A similar spatial and temporal variability in measured rates of
20
N2fixation during the growth season of diazotrophic cyanobacteria has been found by Ohlendieck et al. (2000) and Wasmund et al. (2001).
The earliest estimates of N2fixation in the Baltic Sea were based on the acetylene-reduction method. Plankton samples were routinely concentrated in net-tows or by a screen from natural seawater. Due to this pre-treatment of the samples, the
enrich-25
ment method may have excluded or even physiologically disturbed certain plankton groups and hence, underestimated total rates of N2 fixation to the Baltic Sea. More
BGD
3, 1279–1311, 2006 Significance of nitrogen fixation in early summer U. Ohlendieck et al. Title Page Abstract Introduction Conclusions References Tables Figures J I J I Back CloseFull Screen / Esc
Printer-friendly Version Interactive Discussion
recent studies however, have applied the sensitive 15N tracer method using natural water samples to measure N2 fixation directly (Montoya et al., 1996; Ohlendieck et al., 2000; Wasmund et al., 2001). The 15N method opened the possibility to investi-gate the significance of new (nitrate, nitrite and N2) and regenerated (ammonium) N incorporated into the autotroph community of Baltic Sea phytoplankton (e.g. S ¨orensson
5
and Sahlsten, 1987; Sahlsten and S ¨orensson, 1989). A number of studies have also used the15N method to monitor the direct transfer of newly fixed N into the planktonic foodweb (Pearl, 1984; Glibert and Bronk, 1994; Ohlendieck et al., 2000).
Historically, decay and cell lysis of cyanobacteria have been viewed as a significant source of regenerated N (Lindahl et al., 1980; Schultz and Kaiser, 1986) and high
10
concentrations of dissolved organic nutrients have been found during and immediately after blooms of Baltic Sea cyanobacteria (Gundersen, 1981; Kuparinen et al., 1984). However, Ohlendieck et al. (2000) found that actively growing diazotroph filamentous cyanobacteria transferred DON to the picoplankton community during the early stages of a summer bloom. A similar observation was made by Gallon et al. (2002), who
at-15
tributed the discrepancy between the acetylene reduction method (gross N2 fixation) and the15N-tracer method (net N2fixation) in filamentous cyanobacteria collected over several diel cycles to be DON excretion by the diazotrophs. Exoenzymes are instru-mental in the regenerative process of dissolved organic matter and have been found in association with filamentous cyanobacteria in the Baltic Sea (Stoecker, et al., 2005).
20
Therefore, filamentous cyanobacteria may not only be a source of DON for the non-diazotrophs, but also serve as an active centre of organic nutrient regeneration to the plankton community. Until recently, filamentous cyanobacteria were considered the only diazotroph organisms that contributed significantly to new production by N2 fixa-tion in the Baltic Sea. Nitrogen fixafixa-tion by single cell cyanobacteria (Wasmund et al.,
25
2001; Zehr et al., 2001; Montoya et al., 2004) however, may also be of importance and represents another source pathway of new N to the pelagic food-web.
The aim of this study was to assess the significance of N2 fixation to new produc-tion during the early stages of a cyanobacterial bloom. During two successive years,
BGD
3, 1279–1311, 2006 Significance of nitrogen fixation in early summer U. Ohlendieck et al. Title Page Abstract Introduction Conclusions References Tables Figures J I J I Back CloseFull Screen / Esc
Printer-friendly Version Interactive Discussion
rates of N2 fixation and primary production were monitored in early summer at 9 sta-tions along a N-S transect covering the major parts of the Baltic proper. By exclusion filtration of natural seawater prior to and after in situ incubations, we identified the sig-nificance of single cell diazotrophs and the magnitude of DON excretion by filamentous cyanobacteria incorporated by organisms <5 µm. By applying known molar C:NRATE
5
ratios for filamentous cyanobacteria, we estimated the significance of N2 fixation con-tributing to new N growth in filamentous cyanobacteria.
2 Materials and methods
CTD profiles and seawater samples were collected at designated stations (Fig. 1) on two transect cruises in the Central Baltic Sea in 1998 (23 June–1 July) and 1999 (21
10
June–29 June). During a drift station experiment (see Gallon et al., 2001), three day-stations were kept during 5 additional days in 1998 (6 July–11 July; drift experiment stations 12–14; Fig. 1). Physical parameters were measured using a Neil-Brown unit equipped with conductivity, temperature and density (CTD) sensors. Only temperature profiles are reported here. Seawater was collected at pre-determined depths using
Hy-15
drobios water samplers attached to the CTD unit (1998) or the same water samplers attached to a hydro-wire (1999). Upon retrieval on deck, a small quantity of water (ap-prox. 150 mL) was collected immediately from each water sampler for nutrient analysis (see below). The majority of the water sample from each depth was transferred to a 20 L canister. Each canister was gently homogenized by inverting it a couple of times
20
prior to sub-sampling. Sub-sample aliquots were immediately dispensed into paral-lel incubation bottles for in situ N2 fixation and primary production incubations using the15N and 14C tracer methods (see below) and for HPLC pigment analysis (see be-low). The incubation bottles were deployed at ambient depths on a free-floating array from 07:00–19:00 h (1998 transect) or 06:00–18:00 h (1999 transect). During the 3
25
drift experiment stations in 1998 (Fig. 1), incubations commenced from 04:00–16:00 h daytime (N2 fixation and primary production) and 16:00-04:00 h at night (N2fixation).
BGD
3, 1279–1311, 2006 Significance of nitrogen fixation in early summer U. Ohlendieck et al. Title Page Abstract Introduction Conclusions References Tables Figures J I J I Back CloseFull Screen / Esc
Printer-friendly Version Interactive Discussion
At noon each day, samples were also collected for particulate organic carbon (POC), particulate nitrogen (PN) and particulate total phosphorus (PTP) analysis (see below). 2.1 Nutrient analysis
Nutrient samples were collected in the morning and afternoon at each station visited. The nutrient samples were stored at 4◦C and analysed daily (typically within 4 h of
5
sampling) using an onboard auto-analyser. Dissolved inorganic nitrogen (DIN; nitrate, nitrite, ammonium) and soluble reactive phosphate (SRP) were determined according to the methods described by Grasshoff et al. (1983). A daily average using the morning and afternoon data was calculated for each station visited.
2.2 N2fixation
10
Sample aliquots were collected in replicates of 0.5 or 1 L polycarbonate bottles filled to the brim and sealed with a butyl rubber septum cap. Great care was taken to avoid air-bubbles inside the sealed incubation bottles. A gas-tight syringe was used to inject15 N-labelled dinitrogen (N2) gas (99 atom %15N, Campro Scientific) and excess water was allowed to bleed out through a second injection needle to equalize pressure. Final15N2
15
enrichments ranged between 5.4–6.1 atom % N depending on the physical parameters of the sample water (Weiss, 1970). Each incubation was terminated by collecting the cells on pre-combusted (450◦C, 6 h) 25 mm Whatman GF/F filters using low vacuum (<100 mm Hg) filtration. At all stations in both years, one whole seawater sample from each depth was collected on a GF/F filter (total N2fixation) and one sample was
20
screened through a 5 µm membrane filter and cells <5 µm were collected on a GF/F filter upon terminating the incubation. In another set of samples (see Table 2 for details) cells >20 µm were collected on a Nytex screen and transferred to a GF/F filter using GF/F filtered seawater. A number of samples were also screened prior to deployment and cells <5 µm were incubated separately as a control to test for N2 fixed by this
25
BGD
3, 1279–1311, 2006 Significance of nitrogen fixation in early summer U. Ohlendieck et al. Title Page Abstract Introduction Conclusions References Tables Figures J I J I Back CloseFull Screen / Esc
Printer-friendly Version Interactive Discussion
13 and 15). During the 1998 transect (stations 6–9) cells <20 µm were also separated prior to the in situ incubations to test for N2 fixation by smaller sized cyanobacteria. Incubations with pre-screened cells <5 µm and <20 µm were terminated and collected on separate GF/F filters. Each filter sample was wrapped in pre-combusted aluminium foil and stored at –20◦C until further analysis. In the laboratory, the samples were dried
5
at 60◦C, wrapped in tin cups (Heraeus CHN cups) and packed into pellets. The15N enrichments were analysed on a Europa Mass Spectrometer 20–20, with an ANCA-SL preparatory unit (Crewe, England, UK). The mass spectrometer was standardised with bovine serum albumin and the precision of the analytical procedure, as measured by standard deviation of the nitrogen isotope, was typically 0.04%. The rate of N2fixation
10
was calculated according to Montoya et al. (1996). 2.3 Primary production
Sample water was collected in acid cleaned (10% hydrochloric acid) 250 mL Erlen-meyer polycarbonate incubation bottles. Three replicate incubation bottles, a time zero and a dark bottle were collected for each depth. The primary production method was
15
adapted to the trace-metal clean procedures outlined by Fitzwater et al. (1982). Un-der low light conditions14C-labelled sodium bicarbonate was added to each flask at the start of the assay (final specific activity= 1.6 µg C nCi−1) and the time zero was immediately filtered and processed. At the end of the incubation and under low light conditions, each bottle was immediately filtered onto a 25 mm Whatman GF/F filter.
20
Thereby particles >20 µm were collected separately at all stations in both years. The size fraction >20 µm was collected on a Nytex screen and transferred to a 25 mm Whatman GF/C filter using GF/F filtered seawater. Each filter was placed in a 20 ml scintillation vial and added 250 µl HCl (0.5%) until further processing after each cruise. In the laboratory all sample vials were uncapped and the residual14C-bicarbonate was
25
left to evaporate off the filters in a fume hood. Ultima Gold XR scintillation cocktail was added to each filter sample and the activity was counted on a Wallac 1409 Liquid
BGD
3, 1279–1311, 2006 Significance of nitrogen fixation in early summer U. Ohlendieck et al. Title Page Abstract Introduction Conclusions References Tables Figures J I J I Back CloseFull Screen / Esc
Printer-friendly Version Interactive Discussion
Scintillation Counter using the external channel ratio method. 2.4 HPLC pigment analysis
Sample water aliquots of 2 L were filtered onto Whatman GF/F filters. Cells >20 µm were collected separately at stations 1–7 in 1998 and on all stations (except stations 9– 11) in 1999. The size fraction >20 µm was collected on a Nytex screen and transferred
5
to a 25 mm Whatman GF/C filter using GF/F filtered seawater. The filter samples were wrapped in aluminium foil and stored in liquid nitrogen until further analysis. Each pig-ment sample was placed in 2.5 ml (90%) acetone and, to ensure complete extraction, each sample was added a mixture of 2 and 4 mm glass beads and shaken for 5 min in a cooled Vibrogen cell mill (Buehler, Germany). Subsequently, the extracts were
10
centrifuged (5000 rpm) for 10 min at –10◦C and the supernatant analysed according to the method of Derenbach (1969). The entire processing and analysis was executed under low light conditions to prevent photo-oxidation of the pigments. Pigment concen-trations were determined by reverse-phase high-performance liquid chromatography (RP-HPLC) according to the method of Barlow et al. (1997) using a diode array
spec-15
trophotometer (Waters) and commercially available pigment standards (Sigma Chem-ical Company, USA and International Agency for14C Determination, Denmark). The pigment composition from each sample was used to calculate the relative proportion of phytoplankton classes to total chlorophyll a (Chl a) using the CHEMTAX program (Mackey et al., 1996). Only the fraction of total Chl a associated with filamentous
20
cyanobacteria is shown in this study. The ratio between the class specific pigment of filamentous cyanobacteria (echinenone) and Chl a was established from natural sam-ples of the filamentous diazotrophs collected specifically for this purpose (Meyerh ¨ofer, 1994).
BGD
3, 1279–1311, 2006 Significance of nitrogen fixation in early summer U. Ohlendieck et al. Title Page Abstract Introduction Conclusions References Tables Figures J I J I Back CloseFull Screen / Esc
Printer-friendly Version Interactive Discussion
2.5 POC and PN analysis
Sample aliquots of 0.5 L from each depth were filtered onto pre-combusted (5 h, 500◦C) 25 mm Whatman GF/F filters, that were wrapped in pre-combusted aluminium foil and stored at –20◦C. Particles >20 µm were collected separately at all stations in both years. A sample aliquot of 1 L was collected on a 20 µm Nytex screen and the retained
5
particles transferred to a 25 mm Whatman GF/C filter. Prior to analysis, the filters were dried at 65◦C, fumigated by concentrated HCl, dried again and packed in tin capsules. The POC and PN content was analysed using a Control Equipment Corporation 240-XA Elemental Analyzer (1998) or a Carlo-Erba Strumentazione Elemental Analyser (1999).
10
2.6 PTP analysis
Sample aliquots of 0.5 L were filtered onto HCl washed 25 mm Whatman GF/F filters. Particles >20 µm were collected separately at all stations in both years. A sample aliquot of 1 L was collected on a 20 µm Nytex screen and the retained particles trans-ferred to a 25 mm Whatman GF/C filter. Analysis of cellular P by the ashing-hydrolysis
15
method was performed as discussed in Solorzano and Sharp (1980). The filters were soaked in phosphate-free, deionised water (particle free) and were dried prior to use. The filter-collected samples were rinsed with 0.17 M Na2SO4and stored in acid cleaned containers at –20◦C. Prior to analysis, the samples were thawed and 0.017 M MgSO4 was added before being left overnight at 95◦C. The samples were then
com-20
busted at 500◦C for 3 h and the remaining P was extracted in 2 ml of 0.2 M HCl at 80◦C for a minimum of 1 h. The acid extraction solution was centrifuged (30 min, 5000 rpm), and the supernatant analysed as for SRP according to Grasshof et al. (1983).
BGD
3, 1279–1311, 2006 Significance of nitrogen fixation in early summer U. Ohlendieck et al. Title Page Abstract Introduction Conclusions References Tables Figures J I J I Back CloseFull Screen / Esc
Printer-friendly Version Interactive Discussion
3 Results
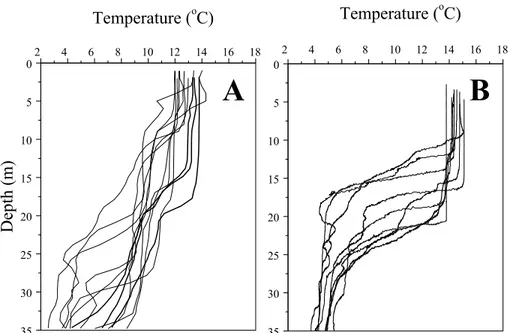
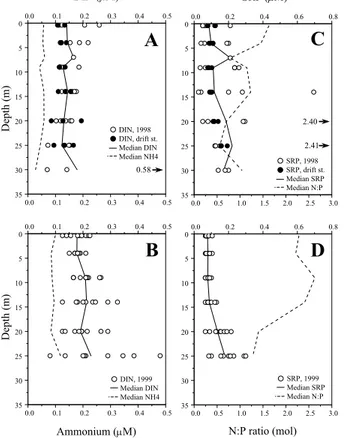
Average surface water temperature between the two years was approximately 2◦C higher in 1999 than in 1998 (Fig. 2). The thermocline was more pronounced in 1999 and during the drift experiment stations in 1998 (Fig. 2). DIN (0.1–0.2 µM) was slightly higher in 1999 than during the 1998 transect with average concentrations of
ammo-5
nium twice as high in 1999 (Fig. 3A, B). The average concentration of SRP in surface waters (0–14 m) was uniformly low during the 1999 transect (0.08 µM) (Fig. 3C, D) and slightly higher in 1998 (average of 0.2 µM at the southern stations and 0.05 µM at the northern stations). Due to these differences between the years, the median (geometric mean) of the molar N:P ratio (1–3) was almost twice as high during the 1999 transect.
10
Cursory microscopy of live samples during the two cruise transects showed that
Aph-anizomenon sp. was the predominant filamentous cyanobacteria in surface waters at
the northern stations (data not shown), whereas Nodularia sp. appeared more frequent at the southern stations.
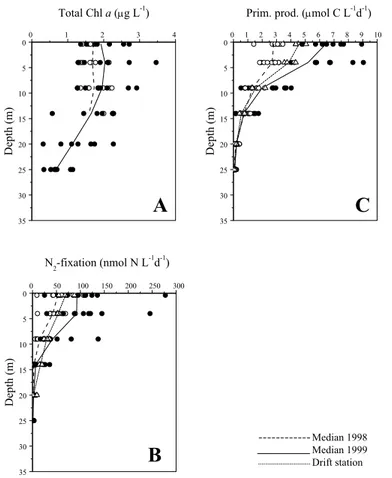
Total Chl a as a function of depth did not show any pronounced inter-annual di
ffer-15
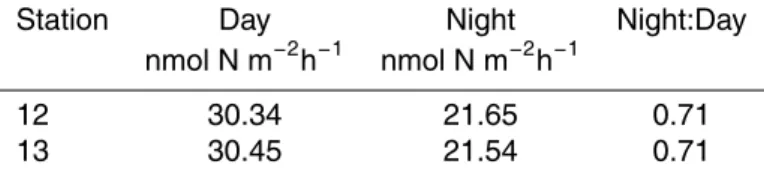
ences (Fig. 4A). Integrated rates of total N2fixation were a fraction of 0.71 lower at night than in daytime at the drift station (Table 1). The daytime rates of N2fixation measured on all transect stations in both years, were factor corrected for the night-time activity to yield daily rates (Fig. 4B). Since primary production was measured from dawn to dusk, no factor correction was used for this parameter. With the exception of the drift
20
experiment stations, the rates of N2fixation and primary production were twice as high in surface waters in 1999 compared to 1998 (Fig. 4B, C). Very low or no rates of N2 fixation and primary production were detected below 14 m depth in both transects. In-tegrated median rates of total N2 fixation (0–14 m) were 0.5 mmol N m−2d−1 in 1998 (range 0.1–0.8) and 1.0 mmol N m−2d−1 in 1999 (range 0.3–2.7). Integrated median
25
rates of total primary production were 32.3 mmol C m−2d−1in 1998 (range 20.4–40.9) and 57.9 mmol C m−2d−1 in 1999 (range 25.9–85.2).
BGD
3, 1279–1311, 2006 Significance of nitrogen fixation in early summer U. Ohlendieck et al. Title Page Abstract Introduction Conclusions References Tables Figures J I J I Back CloseFull Screen / Esc
Printer-friendly Version Interactive Discussion
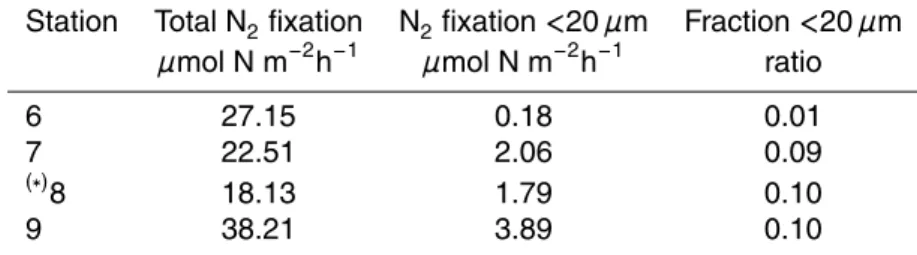
a linear function of total N2 fixation for both transects in 1998 and 1999 (Fig. 5) and the average fraction of 15N enrichment in cells <5 µm (the slope) was 0.09 in 1998 and 0.15 in 1999. Cells <5 µm (separated prior to incubation) showed no detectable uptake. Cells <20 µm (separated prior to incubation) at stations 6–9 in 1998 showed low rates of N2 fixation (median fraction 0.05 of total N2 fixation) but the ratios were
5
variable (range 0.01–0.1) between stations (Table 2).
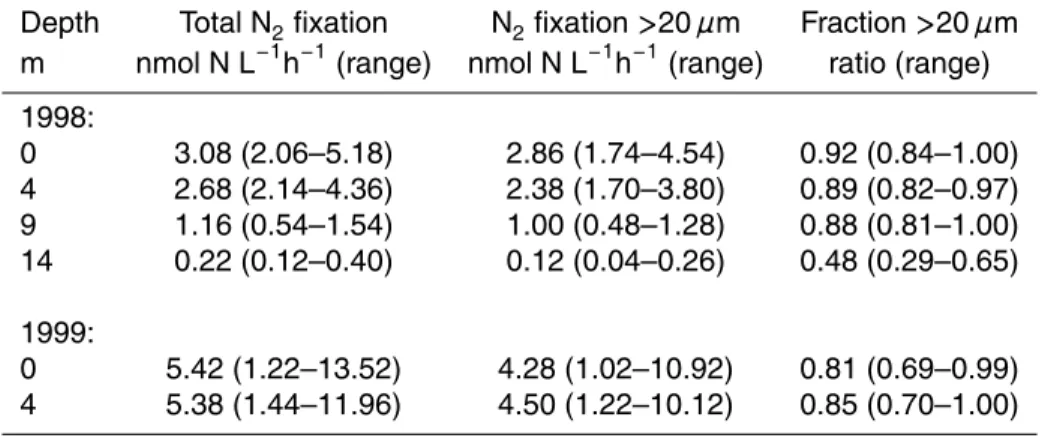
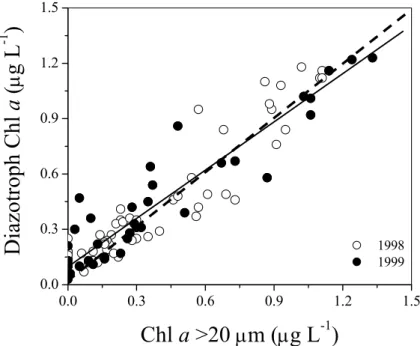
Diazotroph specific Chl a was plotted as a linear function of Chl a>20 µm (Fig. 6). The fraction of N2fixation in cells >20 µm ranged between 0.92–0.88 of the total rate in surface waters in 1998, and was 0.48 of the total at 14 m depth (Table 3). The fraction of N2fixation in cells >20 µm was 0.81–0.85 in surface waters in 1999 (Table 3). The
10
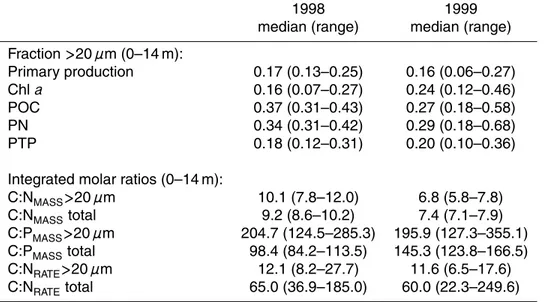
average fractions of N2 fixation in cells >20 µm were used to calculate the integrated rate of N2fixation in cells >20 µm at each station of both transects. In 1999, the depths without data were substituted with the results from the 1998 transect (Table 3). The fraction of primary production in cells >20 µm varied widely between stations in each year (Table 4) but the median value in 1998 (0.17) was similar to the median
calcu-15
lated in 1999 (0.16). The median fractions of integrated Chl a and PTP in particles
>20 µm were similar in both years and approximately one fifth of the total (Table 4).
The fractions of integrated POC and PN in particles >20 µm (relative to total amount) were slightly higher and approximately one third of the total (Table 4). Both the mo-lar elemental ratios of C:N in particles >20 µm (C:NMASS>20 µm) and total integrated
20
C:NMASSwere lower in 1999 than in 1998 (Table 4). The median of total C:PMASSwas higher in 1999 and the integrated C:P in particles >20 µm (C:PMASS>20 µm) varied
little between the two years, but was higher than total C:PMASS(Table 4). The median of the total C:N incorporation ratio was more than 5 times higher than the molar C:N incorporation in cells >20 µm (C:NRATE >20 µm) and both size fractions were similar
25
between the years (Table 4). The calculated C:NRATE in cells >20 µm was plotted as a function of daily integrated PAR (Fig. 7).
BGD
3, 1279–1311, 2006 Significance of nitrogen fixation in early summer U. Ohlendieck et al. Title Page Abstract Introduction Conclusions References Tables Figures J I J I Back CloseFull Screen / Esc
Printer-friendly Version Interactive Discussion
4 Discussion
4.1 Early blooms of diazotrophic cyanobacteria
We found a striking difference in surface water hydrography between the two summer transects investigated in 1998 and 1999. Surface waters during the 1999 transect was warmer and had a variable, but more pronounced thermocline than in 1998. This
dif-5
ference appeared to be reflected in the overall plankton community production. Given the great variability between stations in each year (Fig. 3) there was a general trend towards higher rates of both N2 fixation and primary production in surface waters in 1999. This was also evident in the median rates of total N2 fixation and primary pro-duction that were a factor of 2 higher during the 1999 transect. The hydrography at
10
the drift stations visited 5 days after the 1998 transect (st. 12–14) were characterized by a stronger thermocline and slightly warmer surface waters than observed earlier in the cruise that year. The higher rates of N2 fixation and primary production at the drift station (Fig. 3B, C) may suggest that, once in place, the plankton commu-nity was able to respond quickly to changes in hydrography and the strengthening of
15
the thermocline. Integrated estimates by Wasmund et al. (2001) for the central Baltic Sea in 1997–1998 showed that 75 mmol N m−2 was incorporated in surface waters in summer (mid July–mid August). Their estimate for late summer and fall amounted to 50 mmol N m−2(mid August–mid October), but Wasmund et al. (2001) did not include the early summer phase of the bloom of filamentous cyanobacteria. Assuming that the
20
early onset of the bloom lasted about a month, our study may suggest that a significant amount of N2fixation contributed to new production in 1998 (15 mmol N m−2) and 1999 (33 mmol N m−2). By including the early bloom, 12–26% more N can be added to the annual estimate given by Wasmund et al. (2001), which brings the annual budget in the range of 140–158 mmol N m−2yr−1. The between-station variability in both primary
25
production and N2 fixation that appeared in this study greatly emphasize the need for implementing spatial as well as temporal sampling strategies in ecological studies of
BGD
3, 1279–1311, 2006 Significance of nitrogen fixation in early summer U. Ohlendieck et al. Title Page Abstract Introduction Conclusions References Tables Figures J I J I Back CloseFull Screen / Esc
Printer-friendly Version Interactive Discussion
the Baltic Sea.
4.2 Primary production and N2fixation in filamentous cyanobacteria
We found that cells collected in the >20 µm fraction were predominantly filamentous cyanobacteria (Fig. 6) and the contribution of N2 fixation to new production in open waters of the Baltic Sea was almost entirely found in cells >20 µm (Table 3). Gallon
5
et al. (2002) found that filamentous cyanobacteria incorporate C and N at ratios much higher than the Redfield relationship of 6.6 in surface waters. By applying these C:N in-corporation ratios to our specific depths (C:NRATE [0–7 m]=17.6; [7–14 m]=5.1; Gallon et al., 2002) we calculated how much new N from N2fixation did support the measured rates of primary production. Integrated rates of N2fixation in filamentous cyanobacteria
10
contributed an average of 73% in the 1998 transect (range 28–119%) and 81% in 1999 (range 46–150%) towards the measured rates of primary production in cells >20 µm. This may suggest that filamentous cyanobacteria were able to support their photosyn-thetic growth requirement with new N at some of the stations, while at other stations they were not able to compliment their growth by diazotroph N at the days visited. The
15
average integrated C:NRATE ratios in cells >20 µm in this study (Table 4) were almost two times higher than the Redfield relationship of 6.6 in both years but showed high variability in both years (C:NRATE ranged between 7–28). Gallon et al. (2002) found a similar C:NRATE ratio to ours and noted a temporal uncoupling between C and N in-corporation rates in the filamentous diazotrophs investigated over 3 diel cycles. In high
20
light conditions, filamentous cyanobacteria do incorporate excess amounts of C as glu-cose, lipids and polyhydroxybutyrate storage products (Stal and Walsby, 1998). Loss of buoyancy results from excessive C-incorporation and carbohydrate ballasting (Ibelings et al., 1991) limiting the exposure of filamentous cyanobacteria to UV irradiance in the top layer of the water column. In our study integrated C:NRATE in cells >20 µm was
25
frequently higher on days with high surface irradiance (Fig. 7) showing that measured rates of primary production and N2 fixation were at times out of phase. These rates were not reflected however, in C:NMASSof all particles combined or >20 µm (Table 3).
BGD
3, 1279–1311, 2006 Significance of nitrogen fixation in early summer U. Ohlendieck et al. Title Page Abstract Introduction Conclusions References Tables Figures J I J I Back CloseFull Screen / Esc
Printer-friendly Version Interactive Discussion
Indeed, the C:NMASS ratios that were similar to the Redfield relationship, may suggest that excess C incorporated was stored on a very short term basis (<24 h). Also a low cellular P content causes loss of buoyancy in filamentous cyanobacteria (Konopka et al., 1985; Klemer et al., 1995) and particles >20 µm had a low P content in our study (Table 4). Low P is commonly found in filamentous cyanobacteria in the Baltic Sea in
5
summer (Larsson et al., 2001; Nausch et al., 2004).
Other studies in the Baltic Sea have found that diazotrophs can meet (S ¨orensen and Sahlsten, 1987) or even exceed (Stal and Walsby, 2000) their growth requirements for new N by N2 fixation. The biogeochemical estimates by Larsson et al. (2001), based on measurements of total nitrogen, also suggested that Baltic Sea cyanobacteria were
10
able to assimilate more new N through N2 fixation, than what was needed to support their growth. The Gallon et al. (2002) study noted a discrepancy in the rates of N2 fixation determined by the acetylene reduction method (gross N2fixation) and the15 N-tracer method (net N2fixation). They concluded that a significant amount of newly fixed N may have been released by the filamentous cyanobacteria (Gallon et al., 2002) and
15
this was not being accounted for with the15N tracer method used in this study. We found evidence of exudation of newly fixed N (see below) and this may be a reason for the discrepancy between our study and the gross estimates of N2 fixation mentioned above (Stal and Walsby, 2000; S ¨orensen and Sahlsten, 1987; Larsson et al., 2001). A crude comparison between these gross estimates from literature and our results based
20
on the15N method (73% and 81%, see above), indicate that filamentous cyanobacteria may excrete as much as one third of newly fixed N during the course of a day. Stal et al. (2003) however, suggested that up to 80% of recently fixed N can at times be released over shorter periods of time in surface waters of the Baltic Sea. High C:NRATE ratios in filamentous cyanobacteria may also be caused by uptake of other sources
25
of N (S ¨orensson and Sahlsten, 1987). Mulholland et al. (2004) found rapid uptake of previously released NH4 and DON in their cultures of Trichodesmium. Evans et al. (2000) found that nitrogenase activity in filamentous cyanobacteria decreased over the course of a day in the Baltic Sea and we suggest that this can be attributed to
BGD
3, 1279–1311, 2006 Significance of nitrogen fixation in early summer U. Ohlendieck et al. Title Page Abstract Introduction Conclusions References Tables Figures J I J I Back CloseFull Screen / Esc
Printer-friendly Version Interactive Discussion
simultaneous uptake of regenerated N. Therefore, the exceedingly high C:NRATEratios found in this study may be as a consequence of both excess C incorporation as well as release of newly fixed N and regenerated N incorporation.
4.3 Diazotroph release of DON and single cell N2fixation
Cells <5 µm incorporated 9% in 1998 and 15% in 1999 of total N2 fixation and the
5
same size fraction showed no detectable rates of N2 fixation in this study. There-fore, the observed 15N enrichment in cells <5 µm may have resulted from recent N2 fixation excreted as DON or NH4 and incorporated by non-diazotroph phytoplankton. Cyanobacteria are known to exudate nitrogenous material as DON (Flynn and Gallon, 1990; Glibert and Bronk, 1994) and NH4 (Mulholland and Capone, 2001) at times of
10
excess N2fixation relative to cellular synthesis (Gallon et al., 2002). Our study confirms the findings of Ohlendieck et al. (2000), who suggested that newly fixed N was trans-ferred from filamentous cyanobacteria to smaller plankton. In their study, an increase in abundance of Synechococcus sp. was observed between cruises and over the course of a month, and this co-occurred with a developing bloom of filamentous cyanobacteria
15
in the central Baltic Sea in 1995. Ohlendieck et al. (2000) suggested that the observed increase in biomass of the non-diazotroph cyanobacteria may have been fuelled by newly excreted DON from the larger filamentous diazotrophs. Pico-cyanobacteria are strongly N-limited in the Baltic Sea and may benefit from diazotroph cyanobacteria as a nutrient source, since they show similar temporal and spatial distribution (Stal et al.,
20
2003). The release of N by filamentous cyanobacteria represents an important and significant way of making new N available for the pelagic food-web at the early stage of cyanobacterial blooms in the Baltic Sea.
By monitoring total N in surface waters of the Baltic Sea in summer, Larsson et al. (2001) estimated the annual new production by N2 fixation and found a sizeable
25
amount of N that could not be attributed to their estimates of filamentous cyanobac-teria biomass (determined from cell counts). Larsson et al. (2001) concluded that the N that could not be accounted for may have been generated by DON excretion from
BGD
3, 1279–1311, 2006 Significance of nitrogen fixation in early summer U. Ohlendieck et al. Title Page Abstract Introduction Conclusions References Tables Figures J I J I Back CloseFull Screen / Esc
Printer-friendly Version Interactive Discussion
filamentous cyanobacteria, or generated by other diazotrophs that were not investi-gated in their study. N2fixation by single cell cyanobacteria represents another source pathway of newly fixed N to the pelagic food-web in early summer. In our study we found N2fixation in the pre-screened cells <20 µm (Table 2). Since the group specific pigment echinenone was not found in size fractions <20 µm, we assume that this size
5
fraction did not contain any significant amounts of filamentous cyanobacteria. Was-mund et al. (2001) also detected N2fixation in the smaller size fractions of Baltic Sea phytoplankton. They estimated that cells <10 µm contributed 43% of total N2fixation in the upper 20 m of the water column (Wasmund et al., 2001) and suggested that this was caused by non-heterocystous, coccoid cyanobacteria. Recent studies have
10
also demonstrated that significant amounts of active single cell diazotrophs are found in temperate regions of the northern Pacific (Zehr et al., 2001; Montoya et al., 2004). Since we did not detect any significant rates of N2fixation in cells <5 µm in our daylight incubations, we conclude that cells between 5–20 µm in the Baltic Sea in early summer may at times use N2fixation to support their nutrient requirements.
15
4.4 The importance of N2fixation to total primary productivity
Assuming the same C:NRATE assimilation ratios as above (Gallon et al., 2002), inte-grated rates of total N2 fixation contributed 13% in 1998 (range 4–24%) and 18% in 1999 (range 2–45%) to total primary production. In recent years, a wide range in C:NRATE ratios has emerged from Baltic Sea studies. By using the15N-tracer method,
20
Wasmund et al. (2001) found a C:NRATE of 6.8 at the height of the bloom of filamen-tous cyanobacteria in August 1997. During other stages of the bloom however, molar C:NRATEapproached 20 to >100 and in August the year after, only 17% of the average N demand could be met by N2fixation (Wasmund et al., 2001). Studies taking into ac-count gross N2fixation on the other hand, e.g. acetylene reduction by Stal and Walsby
25
(2000) and total N biogeochemistry by Larsson et al. (2001), have generally measured a higher contribution (>50%) to new production. This discrepancy can to a large extent be attributed to N excretion (see Gallon et al., 2002) that is not being accounted for
BGD
3, 1279–1311, 2006 Significance of nitrogen fixation in early summer U. Ohlendieck et al. Title Page Abstract Introduction Conclusions References Tables Figures J I J I Back CloseFull Screen / Esc
Printer-friendly Version Interactive Discussion
in N2fixation estimates using the15N-tracer method. S ¨orensson and Sahlsten (1987) however, measured N2 fixation by the acetylene reduction method and found that N2 fixation contributed only 16% of the total N utilized by the phytoplankton community at station BY31 (stations 8 in 1998 and 9 in 1999 in this study). The low contribu-tion to new produccontribu-tion by N2fixation in the S ¨orensson and Sahlsten (1987) study may
5
suggest that other nutrient sources (such as regenerated N) were utilized by the phy-toplankton community (including the diazotroph cyanobacteria). The S ¨orensson and Sahlsten (1987) study took place in late summer during the last stages of a cyanobac-terial bloom. At that time we can assume that there was a closely coupled food-web dominated by regenerated production with ammonium as one of the major sources of
10
N. In contrast, our study took place at the beginning of the cyanobacterial growth sea-son with a plankton community still attuned towards new production and relatively low levels of ammonium. We found that 9 and 15% of the total rate of N2 fixation (domi-nated by filamentous cyanobacteria), was incorporated by cells <5 µm in early summer (Fig. 5). This is almost a factor of ten less than what Sahlsten and S ¨orensson (1989)
15
found during a declining cyanobacterial bloom in the same area (71–93% of total N). In our study we found relatively low concentrations of ammonium (median conc. 0.05 µM) in 1998 and the median concentration of ammonium in 1999 was almost twice as high (approx. 0.1 µM). The higher median values of ammonium in surface waters during the 1999 transect (Fig. 3) also coincided with higher rates of N2fixation during that transect
20
and a higher level of15N-enrichment in cells <5 µm (Fig. 5). The diel increase in am-monium concentrations reported by Stal et al. (2003) for the 1999 transect may be as a result of enzymatic regeneration of newly released DON or release of NH4and hence, the larger filamentous diazotrophs may have contributed new N to the pool of regener-ated nutrients. Surface waters of the Baltic Sea in summer are characterized by a low
25
N:P nutrient ratio and we can assume that regenerated nutrients are readily utilized by the non-diazotroph components of the phytoplankton community. Therefore, we con-cur with Larsson et al. (2001) in that N2fixation may sustain a considerable fraction of net community production in the Baltic Sea in summer. Rolff (2000) also demonstrated
BGD
3, 1279–1311, 2006 Significance of nitrogen fixation in early summer U. Ohlendieck et al. Title Page Abstract Introduction Conclusions References Tables Figures J I J I Back CloseFull Screen / Esc
Printer-friendly Version Interactive Discussion
that the effect of N2 fixation (trophic δ15N enrichment) was found in all size fractions of phytoplankton in the Baltic Sea in late summer. Hence, N2 fixation in summer may contribute significantly to new as well as regenerated production in surface waters of the Baltic Sea.
5 Summary
5
This study shows that N2 fixation by filamentous cyanobacteria may provide a signifi-cant input to new production in the surface waters of the Baltic Sea in early summer. Disproportionate amounts of C are at times incorporated relative to N in filamentous cyanobacteria. Since the C:NMASS is fairly constant and similar to the Redfield rela-tionship, we assume that excess C is not stored in cells over longer periods of time
10
and possibly used within the course of a day. Filamentous cyanobacteria and non-diazotroph phytoplankton may also utilize significant amounts of regenerated N. Even though the phytoplankton community is dominated by non-diazotroph organisms in the Baltic Sea, a small fraction of single cell diazotrophs may at times contribute signifi-cantly towards new production. Total rates of N2 fixation, measured by the15N tracer
15
method, contribute only a minor portion of new N to the phytoplankton community in summer. DON release from filamentous diazotroph cyanobacteria however, may contribute significantly towards the utilization of regenerated N by the non-diazotroph community of phytoplankton.
Acknowledgements. We thank the Captain and crew on R/V A. v. Humboldt and R/V Valdivia
20
for help and support during numerous seawater collections. We are indebted to K. von Br ¨ockel (Chief Scientist) for facilitating two excellent summer cruises to the Baltic proper. F. Lipschultz (BBSR) did the analysis of the15N-samples. Post cruise data processing and planning of this paper was supported by ESF-CYANOFIX. This is an ELOISE publication supported by the European Commission (the Environment Programme) contract number EV5V-CT94-0404 to
25
BGD
3, 1279–1311, 2006 Significance of nitrogen fixation in early summer U. Ohlendieck et al. Title Page Abstract Introduction Conclusions References Tables Figures J I J I Back CloseFull Screen / Esc
Printer-friendly Version Interactive Discussion References
Barlow, R. G., Cummings, D. G., and Gibb, S. W.: Improved resolution of mono- and divinyl chlorophylls a and b and zeaxanthin and lutein in phytoplankton extracts using reverse phase C-8 HPLC, Mar. Ecol. Prog. Ser., 161, 303–307, 1997.
Derenbach, J.: Zur Homogenisation des Phytoplanktons f ¨ur die Chlorophyllbestimmung, Kieler
5
Meeresforschungen, XXV, 166–171, 1969.
Dugdale, R. C. and Goering, J. J.: Uptake of new and regenerated forms of nitrogen in primary productivity, Limnol. Oceanogr., 12, 196–206, 1967.
Evans, A. M., Gallon, J. R., Jones, A., Staal, M., Stal, L. J., Villbrandt, M., and Walton, T. J.: Nitrogen fixation by Baltic cyanobacteria is adapted to the prevailing photon flux density, New
10
Phytol., 147, 285–297, 2000.
Fitzwater, S. E., Kramer, G. A., and Martin, J. H.: Metal contamination and its effects on primary production measurements, Limnol. Oceanog., 27, 544–551, 1982.
Flynn, K. J. and Gallon, J. R.: Changes in intracellular and extracellular α-aminoacids in
Gloeotheke during N2 fixation and following addition of ammonium, Arch. Microbiol., 153,
15
574–579, 1990.
Gallon, J. R., Albertano, P., Bergman, B., von Br ¨ockel, K., Canini, A., Congresti, R., Evans, A. M., Fritsche, P., Gundersen, K., te Lintel Hekkert, S., Jones, D. A., Meyerh ¨ofer, M., Nachtigall, K., Ohlendieck, U., Orcutt, K. M., Repka, S., Sivonen, K., Staal, M., and Stal, L. J.: N2fixation and primary production are uncoupled in a developing cyanobacterial bloom in the Baltic
20
Sea, Limnol. Oceanogr., 47, 1514–1521, 2002.
Glibert, P. M. and Bronk, D. A.: Release of dissolved organic nitrogen by marine diazitrophic cyanobacteria, Trichodesmium spp., Appl. Environ. Microbiol., 60, 3996–4000, 1994. Grasshoff, K., Ehrhardt, M., and Kremling, K.: Methods of seawater analysis, Verlag Chemie,
Weinheim, 1983.
25
Gundersen, K.: The distribution and biological transformations of nitrogen in the Baltic Sea, Mar. Pollut. Bull., 12, 199–205, 1981.
Ibelings, B. W., Mur, L. R., and Walsby, A. E.: Diurnal changes in buoyancy and vertical dis-tribution in populations of Microcystis in two shallow lakes, J. Plankton Res., 13, 419–436, 1991.
30
Kahru, M., Horstmann, U., and Rud, O.: Satellite detection of increased cyanobacteria blooms in the Baltic Sea: Natural fluctuation or ecosystem change?, Ambio, 23, 469–72, 1994.
BGD
3, 1279–1311, 2006 Significance of nitrogen fixation in early summer U. Ohlendieck et al. Title Page Abstract Introduction Conclusions References Tables Figures J I J I Back CloseFull Screen / Esc
Printer-friendly Version Interactive Discussion
Klemer, A. R., Hendzel, L. L., Findlay, D. L., Hedin, R. A., Mageau, M. T., and Konopka, A.: Car-bon availability and the pattern of cyanobacterial dominance in enriched low-carCar-bon lakes, J. Phycol., 31, 735–744, 1995.
Konopka, A., Kromkamp, J., and Mur, L. R.: Regulation of gas vesicle content and buoyancy in light- or phosphate-limited cultures of Aphanizomenon flos-aquae (Cyanophyta), J. Phycol.,
5
23, 70–78, 1987.
Kuparinen, J. Lepp ¨anen, J.-M., Sarvala, J., Sundberg, A., and Vistanen, A.: Production and utilizzation of organic matter in Baltic ecosystem off Tv¨arminne, southwest coast of Finland, Rapp. P.-V. Reun.-Cons. Int. Explor. Mer., 183, 180–192, 1984.
Larsson, U., Hajdu, S., Walve, J., and Elmgren, R.: Baltic nitrogen fixation estimated from the
10
summer increase in upper mixed layer total nitrogen, Limnol. Oceanogr., 46, 811–20, 2001. Lepp ¨anen, J.-M., Niemi, ˚A., and Rinne, I.: Nitrogen fixation of cyanobacteria (blue-green algae)
and the nitrogen cycle of the Baltic Sea, Symbiosis, 6, 181–194, 1988.
Lindahl, G., Wallstr ¨om, K., and Brattberg, G.: Short-term variability in nitrogen fixation in a coastal area of the northern Baltic, Arch. Hydrobiol., 98, 88–100, 1980.
15
Mackey, M. D., Mackey, D. J., Higgins, H. W., and Wright, S. W.: CHEMTAX- a program for estimating class abundances from chemical markers: application to HPLC measurements of phytoplankton, Mar. Ecol. Prog. Ser., 144, 265–283, 1996.
Meyerh ¨ofer, M.: Plankton-Pigmente und deren Abbauprodukte als biomarker zur Beschreibung und Absch ¨atzung der Phytoplankton-Sukzession und -Sedimentation im Nordatlantik, Ber.
20
Inst. Meereskunde Kiel, 251, 188 pp, 1994.
Montoya, J. P., Voss, M., K ¨ahler, P., and Capone, D. G.: A simple, precision, high-sensitivity tracer assay for N2fixation, Appl. Environ. Microbiol., 62, 986–993, 1996.
Montoya, J. P., Holl, C. M., Zehr, J. P., Hansen, A., Villareal, T. A., and Capone, D. G.: High rates of N2fixation by unicellular diazotrophs in the oligotrophic Pacific Ocean, Nature, 430,
25
1027–1031, 2004.
Mulholland, M. R. and Capone, D. G.: Stoichiometry of nitrogen utilization in cultured popula-tions of Trichodesmium IMS101: Implicapopula-tions for growth, Limnol. Oceanogr., 46, 436–443, 2001.
Mulholland, M. R., Bronk, D. A., and Capone, D. G.: Dinitrogen fixation and release of
ammo-30
nium and dissolved organic nitrogen by Trichodesmium IMS101, Aquat. Microb. Ecol., 37, 85–94, 2004.
BGD
3, 1279–1311, 2006 Significance of nitrogen fixation in early summer U. Ohlendieck et al. Title Page Abstract Introduction Conclusions References Tables Figures J I J I Back CloseFull Screen / Esc
Printer-friendly Version Interactive Discussion
nitrogen to phosphate limitation in the central Baltic Sea, Mar. Ecol. Prog. Ser., 266, 15–25, 2004.
Niemist ¨o, L., Rinne, I., Melvasalo, T., and Niemi, ˚A.: Blue-green algae and their nitrogen fixation in the Baltic Sea in 1980, 1982, and 1984, Meri, 17, 3–59, 1989.
Ohlendieck, U., Stuhr, A., and Siegmund, H.: Nitrogen fixation by diazotrophic cyanobacteria
5
in the Baltic Sea and transfer of the newly fixed nitrogen to picoplankton organisms, J. Mar. Syst., 25, 213–219, 2000.
Paerl, H. W.: Transfer of N2and CO2 fixation products from Anabaena oscillarioides to acco-ciated bacteria during inorganic carbon sufficiency and deficiency, J. Phycol., 20, 600–608, 1984.
10
Rahm, L., J ¨onsson, A., and Wulff, F.: Nitrogen fixation in the Baltic proper: an empirical study, J. Mar. Syst., 25, 239–48, 2000.
Redfield, A. C., Ketchum, B. H., and Richards, F. A.: The influence of organisms on the sea water, in: The sea, Vol 2, edited by: Hill, M. N., General Edition Inter-science Publishers, London, pp. 26–77, 1963.
15
Rinne, I., Melvasalo, T., Niemi, ˚A., and Niemist ¨o, L.: Nitrogen fixation by blue-green algae in the Baltic Sea, Kieler Meeresforsch. Sonderheft, 4, 178–187, 1978.
Rolff, C.: Seasonal variation in δ13
C and δ15N of size-fractionated plankton at a coastal station in the northern Baltic proper, Mar. Ecol. Prog. Ser., 203, 47–65, 2000.
Sahlsten, E. and S ¨orensson, F.: Planktonic nitrogen transformations during a declining bloom
20
in the Baltic Sea, J. Plankt. Res., 11, 1117–1128, 1989.
Schultz, S. and Kaiser, W.: Increasing trends in plankton variables in the Baltic Sea – a further sign of eutrophication?, Ophelia (Suppl), 4, 249–257, 1986.
Solorzano, L. and Sharp, J. H.: Determination of total dissolved phosphorus and particulate phosphorus in natural waters, Limnol. Oceanogr., 25, 754–758, 1980.
25
Stal, L. J. and Walsby, A. E.: The daily integral of nitrogen fixation by planktonic cyanobacteria in the Baltic Sea, New Phytol., 139, 665–671, 1998.
Stal, L. J. and Walsby, A. E.: Photosynthesis and nitrogen fixation in a cyanobacterial bloom in the Baltic Sea, European J. Phycol., 35, 97–108, 2000.
Stal, L., Albertano, P., Bergman, B., Br ¨ockel, K. v., Gallon, J., Hayes, P. K., Sivonen, K., and
30
Walsby, A. E.: BASIC: Baltic Sea cyanobacteria. An investigation of the structure and dy-namics of water blooms of cyanobacteria in the Baltic Sea – responses to a changing envi-ronment, Cont. Shelf Res., 23, 1695–1714, 2003.
BGD
3, 1279–1311, 2006 Significance of nitrogen fixation in early summer U. Ohlendieck et al. Title Page Abstract Introduction Conclusions References Tables Figures J I J I Back CloseFull Screen / Esc
Printer-friendly Version Interactive Discussion
Stoecker, D., Autio, R., Rintala, J.-M., and Kuosa, H.: Ecto-cellular enzyme activity associated with filamentous cyanobacteria, Aquat. Microbiol. Ecol., 40, 151–161, 2005.
S ¨orensson, F. and Sahlsten, E.: Nitrogen dynamics of a cyanobacteria bloom in the Baltic Sea: new versus regenerated production, Mar. Ecol. Prog. Ser., 37, 277–284, 1987.
Walsby, A., Hayes, P., and Boje, R.: The gas vesicles, buoyancy and vertical distribution of
5
cyanobacteria in the Baltic Sea, Eur. J. Phycol., 30, 87–94, 1995.
Wasmund, N.: Occurrence of cyanobacterial blooms in the Baltic Sea in relation to environ-mental conditions, Int. Rev. Ges. Hydrobiol., 82, 169–184, 1997.
Wasmund, N., Voss, M., and Lochte, K.: Evidence of nitrogen fixation by non-heterocystous cyanobacteria in the Baltic Sea and re-calculation of a budget of nitrogen fixation, Mar. Ecol.
10
Prog. Ser., 214, 1–14, 2001.
Weiss, R. F.: The solubility of nitrogen, oxygen, and argon in seawater, Deep-Sea Res., 17, 721–735, 1970.
Zehr, J. R., Waterbury, J. B., Turner, P. J., Montoya, J. P., Omoregie, E., Steward, G. F., Hansen, A., and Karl, D. M.: Unicellular cyanobacteria fix N2 in the subtropical North Pacific Ocean,
15
BGD
3, 1279–1311, 2006 Significance of nitrogen fixation in early summer U. Ohlendieck et al. Title Page Abstract Introduction Conclusions References Tables Figures J I J I Back CloseFull Screen / Esc
Printer-friendly Version Interactive Discussion
Table 1. Rates of N2fixation measured in daylight (04:00–16:00 h) and at night (16:00–04:00 h) in whole seawater from the Baltic Sea in 1998. The rates from each station were integrated (0–14 m) and the N2fixation at night was calculated as a fraction of the daytime.
Station Day Night Night:Day nmol N m−2h−1 nmol N m−2h−1
12 30.34 21.65 0.71 13 30.45 21.54 0.71
BGD
3, 1279–1311, 2006 Significance of nitrogen fixation in early summer U. Ohlendieck et al. Title Page Abstract Introduction Conclusions References Tables Figures J I J I Back CloseFull Screen / Esc
Printer-friendly Version Interactive Discussion
Table 2. Integrated rates of N2 fixation (0–14 m) in whole seawater and cells <20 µm in the Baltic Sea in 1998. Cells <20 µm were separated prior to the in situ daytime incubations and the rates of N2fixation in cells <20 µm were also calculated as a fraction of the total rate.
Station Total N2fixation N2fixation <20 µm Fraction <20 µm
µmol N m−2h−1 µmol N m−2h−1 ratio
6 27.15 0.18 0.01
7 22.51 2.06 0.09
(∗)
8 18.13 1.79 0.10
9 38.21 3.89 0.10
BGD
3, 1279–1311, 2006 Significance of nitrogen fixation in early summer U. Ohlendieck et al. Title Page Abstract Introduction Conclusions References Tables Figures J I J I Back CloseFull Screen / Esc
Printer-friendly Version Interactive Discussion
Table 3. Rates of N2fixation measured in cells larger and smaller than 20 µm (separated after incubation) in the Baltic Sea in 1998 (stations 6–9) and 1999 (stations 7–15). The rates from each station were averaged per depth and the rate of N2fixation in cells >20 µm was calculated as a fraction of the total rate.
Depth Total N2fixation N2fixation >20 µm Fraction >20 µm m nmol N L−1h−1(range) nmol N L−1h−1(range) ratio (range) 1998: 0 3.08 (2.06–5.18) 2.86 (1.74–4.54) 0.92 (0.84–1.00) 4 2.68 (2.14–4.36) 2.38 (1.70–3.80) 0.89 (0.82–0.97) 9 1.16 (0.54–1.54) 1.00 (0.48–1.28) 0.88 (0.81–1.00) 14 0.22 (0.12–0.40) 0.12 (0.04–0.26) 0.48 (0.29–0.65) 1999: 0 5.42 (1.22–13.52) 4.28 (1.02–10.92) 0.81 (0.69–0.99) 4 5.38 (1.44–11.96) 4.50 (1.22–10.12) 0.85 (0.70–1.00)
BGD
3, 1279–1311, 2006 Significance of nitrogen fixation in early summer U. Ohlendieck et al. Title Page Abstract Introduction Conclusions References Tables Figures J I J I Back CloseFull Screen / Esc
Printer-friendly Version Interactive Discussion
Table 4. Integrated mass and primary production in cells >20 µm calculated as the fraction
of the total, during two transect cruises (1998, 1999) in the Baltic Sea. The molar ratios of integrated mass and elemental incorporation in two size fractions (total mass and particles
>20 µm) were also calculated.
1998 1999
median (range) median (range) Fraction >20 µm (0–14 m): Primary production 0.17 (0.13–0.25) 0.16 (0.06–0.27) Chl a 0.16 (0.07–0.27) 0.24 (0.12–0.46) POC 0.37 (0.31–0.43) 0.27 (0.18–0.58) PN 0.34 (0.31–0.42) 0.29 (0.18–0.68) PTP 0.18 (0.12–0.31) 0.20 (0.10–0.36) Integrated molar ratios (0–14 m):
C:NMASS>20 µm 10.1 (7.8–12.0) 6.8 (5.8–7.8) C:NMASStotal 9.2 (8.6–10.2) 7.4 (7.1–7.9) C:PMASS>20 µm 204.7 (124.5–285.3) 195.9 (127.3–355.1) C:PMASStotal 98.4 (84.2–113.5) 145.3 (123.8–166.5) C:NRATE>20 µm 12.1 (8.2–27.7) 11.6 (6.5–17.6) C:NRATEtotal 65.0 (36.9–185.0) 60.0 (22.3–249.6)
BGD
3, 1279–1311, 2006 Significance of nitrogen fixation in early summer U. Ohlendieck et al. Title Page Abstract Introduction Conclusions References Tables Figures J I J I Back CloseFull Screen / Esc
Printer-friendly Version Interactive Discussion EGU 12 13 14 4 14 3 2 1 15 13 12 5 6 11 7 8 9 8 7 Stockholm SWEDEN LATVIA LITHUANIA FINLAND 58 ºN 56 ºN 60 ºN 20 ºE 15 ºE 25 ºE ESTONIA RUSSIA 9 10
Fig. 1. Map of the Baltic Sea showing the cruise tracks in 1998 (open circles, S-N) and 1999
(closed circles, N-S). Location of the drift experiment stations in 1998 (larger open circle) 12–14 are also shown.
BGD
3, 1279–1311, 2006 Significance of nitrogen fixation in early summer U. Ohlendieck et al. Title Page Abstract Introduction Conclusions References Tables Figures J I J I Back CloseFull Screen / Esc
Printer-friendly Version Interactive Discussion EGU 0 5 10 15 20 25 30 35 2 4 6 8 10 12 14 16 18 Temperature (oC) Depth (m) 0 5 10 15 20 25 30 35 2 4 6 8 10 12 14 16 18 Temperature (oC)
A
B
Transects Drift stationsFig. 2. Seawater temperature measured as a function of depth at the transect stations in 1998 (A) and 1999 (B). Temperature profiles at the drift stations 12–14 (thick line) are also shown.
BGD
3, 1279–1311, 2006 Significance of nitrogen fixation in early summer U. Ohlendieck et al. Title Page Abstract Introduction Conclusions References Tables Figures J I J I Back CloseFull Screen / Esc
Printer-friendly Version Interactive Discussion 0 5 10 15 20 25 30 35 0.0 0.2 0.4 0.6 0.8 SRP (µM) 0.0 0.5 1.0 1.5 2.0 2.5 3.0 0 5 10 15 20 25 30 35 0.0 0.1 0.2 0.3 0.4 0.5 Depth (m) 0.0 0.1 0.2 0.3 0.4 0.5 Ammonium (µM) 0 5 10 15 20 25 30 35 0.0 0.1 0.2 0.3 0.4 0.5 DIN (µM) Depth (m) 0.0 0.1 0.2 0.3 0.4 0.5 0 5 10 15 20 25 30 35 0.0 0.2 0.4 0.6 0.8 N:P ratio (mol) 0.0 0.5 1.0 1.5 2.0 2.5 3.0 Figure 3
A
D
B
C
2.41 2.40 DIN, 1998 DIN, drift st. Median DIN Median NH4 SRP, 1998 SRP, drift st. Median SRP Median N:P DIN, 1999 Median DIN Median NH4 SRP, 1999 Median SRP Median N:P 0.58Fig. 3. DIN concentrations (open circles) as a function of depth in 1998 (A) and 1999 (B). The
geometric average of DIN (whole line) and ammonium (dashed line) is shown for each cruise transect each year. SRP concentrations (open circles) as a function of depth in 1998(C) and
1999(D). The geometric average of SRP (whole line) and the molar N:P ratio (dashed line)
is shown for each cruise in each year. Nutrient sample were also collected at the drift station casts 12–14 (whole circles). Stations 1, 2, 6 and 7 in 1998 did not have all nutrients analysed and were not included in the graph.
BGD
3, 1279–1311, 2006 Significance of nitrogen fixation in early summer U. Ohlendieck et al. Title Page Abstract Introduction Conclusions References Tables Figures J I J I Back CloseFull Screen / Esc
Printer-friendly Version Interactive Discussion 0 5 10 15 20 25 30 35 0 1 2 3 4 Total Chl a (µg L-1) Depth (m) 0 5 10 15 20 25 30 35 0 1 2 3 4 5 6 7 8 9 10
Prim. prod. (µmol C L-1d-1)
Depth (m) Drif Figure 4
A
B
C
0 5 10 15 20 25 30 35 0 50 100 150 200 250 300 N2-fixation (nmol N L-1d-1) Depth (m) Median 1998 Median 1999 t stationFig. 4. Total Chl a (A), rates of N2fixation(B) and primary production (C) plotted as a function of
depth in 1998 (open circles) and 1999 (closed circles). Where available, the geometric average at each depth was calculated for the 1998 transect cruise (dashed line) and drift station (dotted line) and the cruise transect in 1999 (whole line).
BGD
3, 1279–1311, 2006 Significance of nitrogen fixation in early summer U. Ohlendieck et al. Title Page Abstract Introduction Conclusions References Tables Figures J I J I Back CloseFull Screen / Esc
Printer-friendly Version Interactive Discussion EGU 0 3 6 9 12 15 0.0 0.4 0.8 1.2 1.6 2.0 1998 1999 15
N-enrichment <5
µ
m (
nmol N L
-1h
-1)
Total N
2fixation (nmol N L
-1h
-1)
Fig. 5. Rates of15N enrichment in cells <5 µm (screened after incubation) as a function of total N2fixation measured from water samples at the transect stations 1–9 and at the drift experiment stations 12–14 in 1998 (open circles) and from the transect stations 7–15 in 1999 (closed circles). Solid lines shows the linear regression in 1998; y=0.089(±0.009)·x+0.008(±0.030), n=33, R=0.881, P<0.0001; and in 1999; y=0.147(±0.014)·x+0.058(±0.075), n=26, R=0.904, P<0.0001. Rates of15N enrichment in cells <5 µm at stations 1–2 in 1998 were below detection and not included in this figure.
BGD
3, 1279–1311, 2006 Significance of nitrogen fixation in early summer U. Ohlendieck et al. Title Page Abstract Introduction Conclusions References Tables Figures J I J I Back CloseFull Screen / Esc
Printer-friendly Version Interactive Discussion EGU 0.0 0.3 0.6 0.9 1.2 1.5 0.0 0.3 0.6 0.9 1.2 1.5 1998 1999
Diazotroph C
hl
a (
µ
g L
-1)
Chl a >20
µ
m (
µ
g L
-1)
Fig. 6. Diazotroph Chl a plotted as a function of Chl a>20 µm in samples collected from
the cruise transects in 1998 (open circles) and 1999 (closed circles). Dashed line is the 1:1 relationship and the solid line shows the linear regression of both cruises combined; y=0.872(±0.036)·x+0.098(±0.019), n=90, R=0.933, P<0.0001.
BGD
3, 1279–1311, 2006 Significance of nitrogen fixation in early summer U. Ohlendieck et al. Title Page Abstract Introduction Conclusions References Tables Figures J I J I Back CloseFull Screen / Esc
Printer-friendly Version Interactive Discussion EGU C:N = 6.6 0 20000 40000 60000 80000 0 5 10 15 20 25 30 1998 1999
C:
N
RAT E>20
µ
m
PAR (
µ
E m
-2d
-1)
Fig. 7. Integrated C:NRATE>20 µm as a function of daily integrated PAR in 1998 (open circles)
and 1999 (closed circles). The dashed line is the Redfield relationship and the solid line is the linear regression; y=0.000095(±0.000069)·x+8.18(±3.31), n=18, R=0.322, P=0.192.