HAL Id: insu-00662255
https://hal-insu.archives-ouvertes.fr/insu-00662255
Submitted on 17 Jan 2018HAL is a multi-disciplinary open access
archive for the deposit and dissemination of sci-entific research documents, whether they are pub-lished or not. The documents may come from teaching and research institutions in France or abroad, or from public or private research centers.
L’archive ouverte pluridisciplinaire HAL, est destinée au dépôt et à la diffusion de documents scientifiques de niveau recherche, publiés ou non, émanant des établissements d’enseignement et de recherche français ou étrangers, des laboratoires publics ou privés.
Takashi Yoshino, Elizabeth Mcisaac, Mickaël Laumonier, Tomoo Katsura
To cite this version:
Takashi Yoshino, Elizabeth Mcisaac, Mickaël Laumonier, Tomoo Katsura. Electrical conductivity of partial molten carbonate peridotite. Physics of the Earth and Planetary Interiors, Elsevier, 2012, 194-195, pp.1-9. �10.1016/j.pepi.2012.01.005�. �insu-00662255�
Electrical conductivity of partial molten carbonate peridotite
Takashi Yoshino, Elizabeth McIsaac, Mickael Laumonier, Tomoo Katsura
PII: S0031-9201(12)00013-1
DOI: 10.1016/j.pepi.2012.01.005
Reference: PEPI 5496
To appear in: Physics of the Earth and Planetary Interiors Received Date: 24 April 2011
Revised Date: 9 January 2012 Accepted Date: 12 January 2012
Please cite this article as: Yoshino, T., McIsaac, E., Laumonier, M., Katsura, T., Electrical conductivity of partial molten carbonate peridotite, Physics of the Earth and Planetary Interiors (2012), doi: 10.1016/j.pepi.2012.01.005
This is a PDF file of an unedited manuscript that has been accepted for publication. As a service to our customers we are providing this early version of the manuscript. The manuscript will undergo copyediting, typesetting, and review of the resulting proof before it is published in its final form. Please note that during the production process errors may be discovered which could affect the content, and all legal disclaimers that apply to the journal pertain.
Electrical conductivity of partial molten carbonate peridotite
1Takashi Yoshino1*, Elizabeth McIsaac2, Mickael Laumonier3 and Tomoo Katsura1,4
2
1Institute for Study of the Earth’s Interior, Okayama University, Misasa, Tottori
682-3
0192, Japan
4
2Department of Earth Sciences, Dalhousie University, Edzell Castle Circle, Halifax NS,
5
B3H 4J1, Canada
6
3 Université d'Orléans, Université François Rabelais - Tours, CNRS/INSU, Institut des
7
Sciences de la Terre d'Orléans - UMR 6113, Campus Géosciences 1A, rue de la
8
Férollerie 45071 Orléans cedex 2, hFrance
9
4Bayerisches Geoinstitut, Universität Bayreuth, 95447 Bayreuth, Germany
10
Abstract In order to investigate the effect of carbonate-content in partial melt on bulk
11
conductivity under high pressure, electrical conductivity measurements were performed
12
on carbonate melt-bearing peridotites using a Kawai-type multi-anvil apparatus. The
13
starting materials were composed of spinel lherzolite (KLB1) with small amounts of
14
dolomite (1 and 3 wt.%). To obtain various melt fractions, annealing experiments were
15
performed at different temperatures above 1400 K at 3 GPa. At low temperatures (≤
16
1500 K), the conductivity was distinctly higher than that of carbonate-free peridotite
17
and close to that of the carbonatite melt-bearing olivine aggregates. Although the
18
sample conductivity increased with increasing temperature, the rate at which the
19
conductivity increases was small and the conductivity approached that of silicate
melt-20
bearing peridotite. CO2 concentration in the partial melt decreased with increasing 21
annealing temperature. Thus, the small increase of the conductivity with annealing
22
temperature is attributed to a decrease of the melt conductivity due to a decrease in
carbonate content in the partial melt. As the carbonate concentration in the melt
24
decreases, the estimated melt conductivity approaches that of the basaltic melt.
25
Therefore, conductivity enhancement by the carbonate-bearing melt is very effective at
26
temperature just above that of the carbonate peridotite solidus.
27
Keywords: Carbonatite; Electrical conductivity; Melt fraction; Peridotite; Upper
28
mantle
29
1. Introduction
30
The high conductivity anomaly in the upper mantle is a general feature
31
beneath the oceanic lithosphere as observed by electromagnetic surveys (e.g., Lizarralde
32
et al., 1995; Evans et al., 2005; Baba et al., 2006). There are two major candidates for
33
what causes the raising of the conductivity in that region: partial melt and hydration of
34
nominally anhydrous minerals (e.g., Tyburczy and Waff, 1983; Karato, 1990). However,
35
the electrical conductivity of hydrous olivine is not high enough to explain the
36
conductivity anomaly at the top of the asthenosphere (Yoshino et al., 2006; 2009a; Poe
37
et al., 2009). Recently Gaillard et al. (2008) proposed that a very small amount of
38
carbonatite is an attractive agent for generating the conductivity anomaly based on the
39
conductivity measurement of carbonate melts at atmospheric pressure. Later research
40
showed the conductivity measurement of carbonate melt-bearing olivine aggregates at 3
41
GPa had an order of magnitude higher conductivity than the silicate melt-bearing
42
olivine aggregates for the same melt fraction (Yoshino et al., 2010). In addition, carbon
43
in peridotite can significantly reduce the solidus temperature (e.g., Falloon and Green,
44
1989; Dasgupta and Hirschmann, 2006). Thus the presence or absence of carbonatite
45
melt will affect the estimation of mantle temperature from the conductivity structure of
46
the upper mantle obtained from geophysical surveys.
Yoshino et al. (2010) reported on the effect of carbonatitic partial melt with
48
higher carbon concentration on the bulk conductivity. However, partial melts of
49
carbonate-bearing mantle peridotites may have variable carbonate concentrations under
50
a wide range of mantle conditions. Thus, to assess conductivity anomalies in the upper
51
mantle, we need to know the effect of the carbonate component in partial melt on the
52
bulk conductivity of the partially molten peridotite under high pressure. In this study,
53
we determined the electrical conductivities of carbonate-bearing peridotite with variable
54
melt fractions. A variation of melt fractions was obtained by annealing under different
55
temperature conditions. Since we used starting materials with a fixed carbonate
56
concentration, the variation in the degree of partial melting can provide the variation in
57
carbonate concentration in the partial melt. In addition, we measured conductivity of
58
dolomite melt in order to constrain the absolute conductivity and activation enthalpy of
59
carbonate melt at high pressure. The electrical conductivity of carbonate-bearing melt
60
was estimated as a function of CO2 concentration in the melt. We obtained CO2 61
concentration dependence of electrical conductivity by comparing the data obtained
62
from our previous results, in which the conductivity was obtained for the partial molten
63
carbonate peridotite with fixed CO2 concentration in melt. Such an argument provides 64
the constraints on the presence of carbonate partial melt and on the thermal structure of
65
the upper mantle.
66
2. Experimental Methods
67
Starting materials were powder mixtures of natural spinel lherzolite (KLB1)
68
with 1 and 3 wt. % natural dolomite from Austria, which have approximately 0.5 and
69
1.5 wt.% bulk CO2, respectively. For one experiment, a powder of the KLB1 without 70
dolomite was used as a starting material to investigate the effect of carbonate on
71
electrical conductivity. Dolomite powder was also used as a starting material to measure
72
conductivity of dolomite melt. The particle size of the powder was less than a few
micrometers. The powdered sample was encapsulated in a cylindrical MgO sleeve and
74
was sandwiched by two graphite electrodes in contact with two sets of W97Re3-W75Re25 75
thermocouples. Two sets of thermocouples were also used for the four-pole resistance
76
method of electrical conductivity measurement. The design of the cell assembly is the
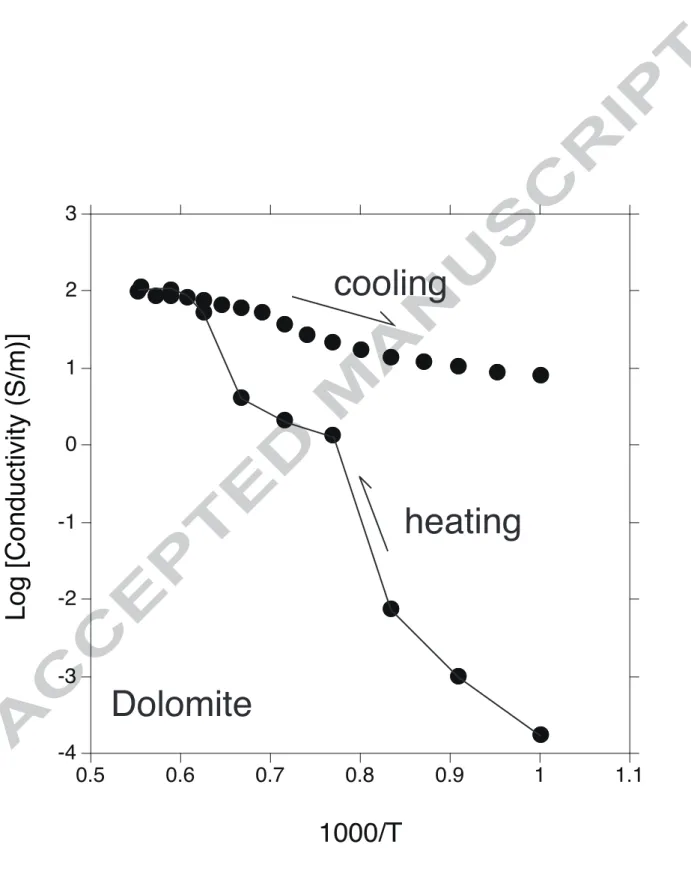
77
same as that given in Yoshino et al. (2010).
78
Conductivity measurement with impedance spectroscopy was carried out using a
79
Solartron 1260 impedance Gain-Phase Analyzer combined with a Solartron 1296
80
interface. Complex impedances were obtained at frequencies ranging from 0.1 Hz to 1
81
MHz and applied voltages of 1 or 1.41 V. We applied the pseudo 4-pole electrode
82
system to the conductivity measurement, because the resistance of the electrode and
83
long metallic wires (thermocouple) can be comparable to that of the highly conductive
84
melt (Pommier et al., 2010).
85
Conductivity measurements were conducted through several heating-cooling
86
cycles at 3 GPa in a Kawai-type multianvil press. The temperature was increased and
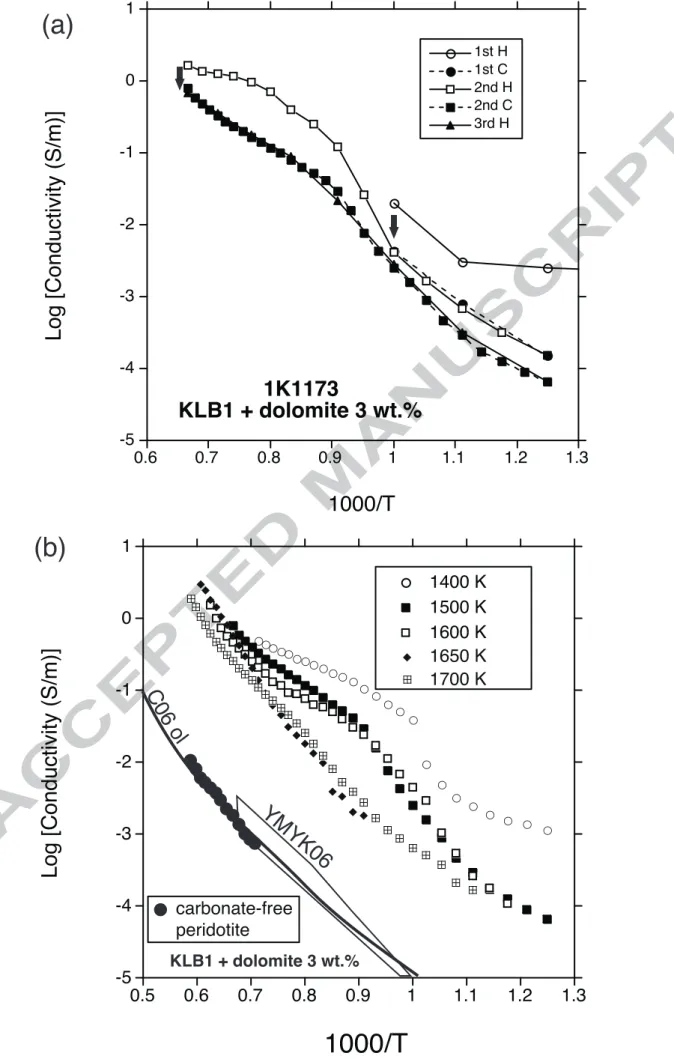
87
decreased in steps of 25-50 K to the desired temperature. Impedance spectra were
88
obtained at each temperature step. Firstly the sample was heated and held at 1000 K to
89
dehydrate the sample and the surrounding materials. Then the sample was heated to the
90
desired temperature, which is above the solidus of carbonate-bearing peridotite (~1350
91
K at 3 GPa: Dasgupta and Hirschmann, 2006). To achieve textural equilibrium of the
92
solid-liquid composites, the samples were annealed at the desired temperature, by
93
continuous monitoring of electrical conductivity, until the sample conductivity became
94
constant. After annealing, the sample was cooled to less than 1000 K. Subsequent
95
heating cycles using step-wise temperature increments were also conducted to confirm
96
reversibility. In order to retain the partial molten texture, the sample was quenched from
97
the highest temperature to ambient temperature.
Retrieved samples were mounted in epoxy and ground parallel to the axis of
99
the cylindrical heater. The chemical compositions of the carbonate and silicate phases in
100
the recovered sample were obtained using electron microprobe analyzer (EPMA). The
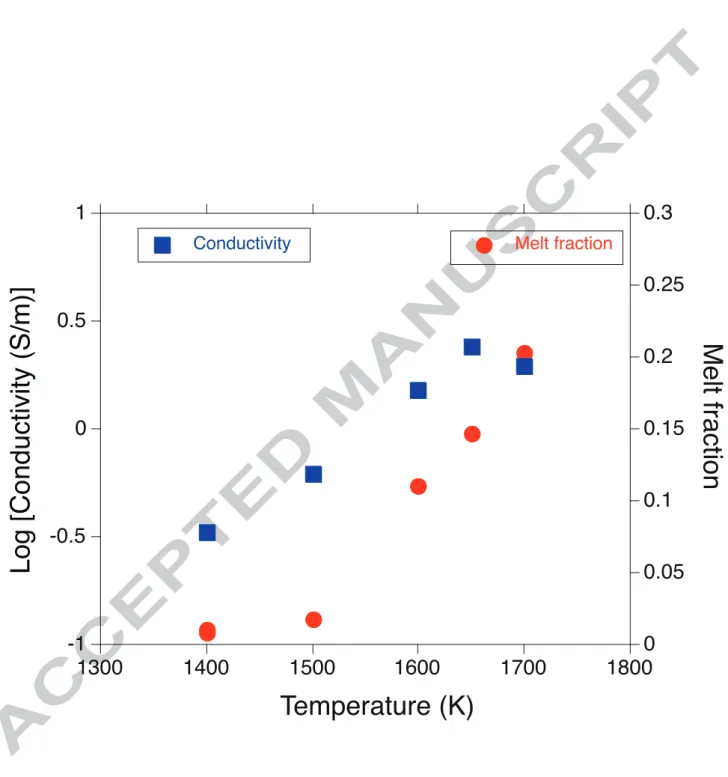
101
carbonate (CO2) concentration in the melt was predicted from the total weight deficit of 102
the EPMA data (Table 2). However, the near-solidus partial melt composition could not
103
be determined because of its small size (< 1µm). The microstructure on the polished
104
section of the run products was observed by secondary electron and back-scattered
105
electron images (BEI) using a field-emission scanning electron microscope (FE-SEM).
106
The melt fraction of the samples was determined from the image analysis after the
107
experiments (for detail, see Yoshino et al. (2005)).
108
3. Results
109
3.1. Texture and chemical composition
110
The melt fraction of carbonate-bearing peridotite increased with increasing the
111
annealing temperature (Table 1), whereas the carbonate-free peridotite annealed at 1700
112
K showed the absence of a melt phase. Microstructures on the polished section are
113
shown in Fig. 1. Carbonate-bearing melt was located at the triple junction of the olivine
114
and pyroxene crystals (Fig. 1a-c). As the melt fraction increased, the melt completely
115
surrounded the olivine crystals on the polished section (Fig. 1d). The apparent dihedral
116
angle was around 20˚, which implies a three-dimensional interconnection of the melt
117
network. Infiltration of the melt into the MgO capsule was not observed for all run
118
products. Partial melt was homogeneously distributed in the center of the sample,
119
whereas the melt-less olivine layer was also developed adjacent to the MgO container
120
with a thickness of less than 100 µm. Forsterite content (Fo96) in the olivine adjacent to 121
the MgO container was relatively higher because of iron loss from the sample to the
122
MgO capsule. The samples showed relatively homogeneous distribution of the melt, and
123
therefore we believe the measured conductivity values should represent the whole part
of the partially molten zone. As mentioned above, the outer part of the sample had less
125
iron contents. The sample conductivity of the uncontaminated part of the sample should
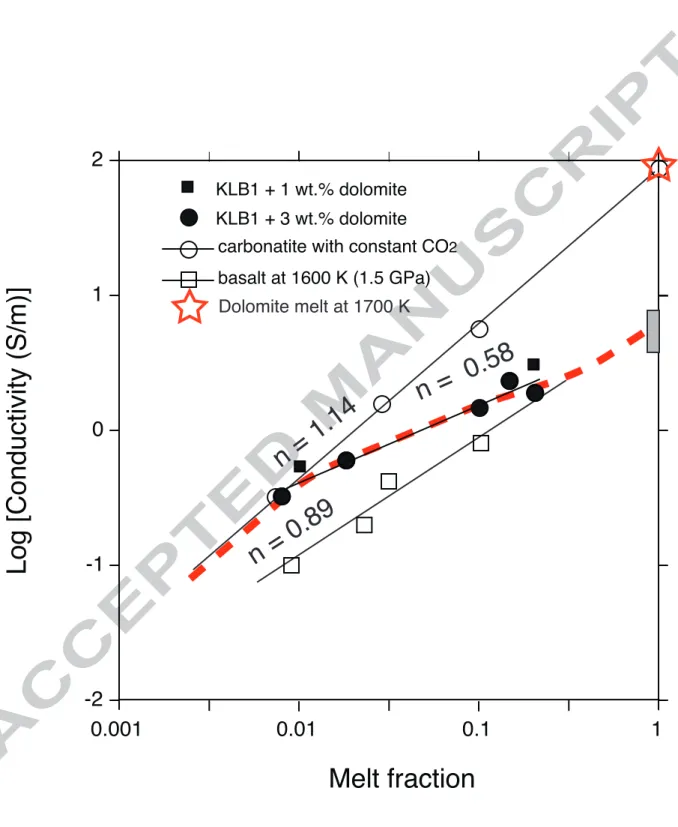
126
be slightly higher than the obtained value (less than 10 %).
127
For the 3 wt.% dolomite-bearing peridotite system, the dolomite completely
128
decomposed below 1600 K. Orthopyroxene disappeared because of a decarbonation
129
reaction such as MgSiO3 (in orthopyroxene) + MgCO3 (in dolomite) = Mg2SiO4 (in 130
olivine) + CO2. Clinopyroxene was present up to 1700 K, although by volume the 131
proportion of clinopyroxene decreased with increasing temperature. The carbonate
132
concentration (CO2) in the partial melt of the samples decreased from 45 to 13 wt.% 133
with increasing melt fraction from 0.02 to 0.2 (Tables 1 and 2). In the case of the KLB1
134
+ 1 wt.% dolomite system, the CO2 concentration in melt decreased to 5 wt.% when the 135
melt fraction was 0.20. We were not able to measure the melt composition accurately
136
for samples containing the lowest melt fraction (≤ 1 vol.%) using the electron
137
microprobe. However, the carbonate component of the sample is usually expected to be
138
40 wt.% just above the solidus (Dasgupta et al., 2007). Thus the CO2 concentration in 139
the partial melt largely decreased with increasing annealing temperature and melt
140
fraction. The CO2 concentrations in the melt estimated by EPMA were slightly higher 141
than those expected from the bulk composition. For example, when we assume that all
142
carbons partition into the melt phase, and the densities of the carbonate and basaltic
143
melt range from 2 to 2.7 g/cm3 (e.g., Dobson et al., 1996; Rigden et al., 1986), the
144
KLB1 + dolomite 3 wt.% system with 20 vol.% melting requires around 10 wt.% CO2 145
concentration in the partial melt. The CO2 concentrations in the melt were increased by 146
partial solidification of the melt due to reaction with the MgO capsule.
147
3.2. Electrical conductivity
148
The impedance spectra generally show one arc at higher frequencies and an
149
additional part appearing at lower frequencies (Fig. 2). If the melt phase is
interconnected in a solid matrix, it forms an electrical pathway in parallel to the solid
151
matrix (Roberts and Tyburczy, 2000). Thus the high-frequency arc reflects the sample
152
properties, and the low frequency tail is accordingly interpreted as an effect of the
153
electrodes. Therefore, only the first arc was used to determine the conductivity of the
154
sample. As shown in Fig. 2b, the impedance spectra were sometimes observed to
155
contain a predominantly inductive reactance (inductive loop) possibly due to the mass
156
transport and electrochemical reaction at the electrode interface (Hampton et al., 1980;
157
van Hassel et al., 1991). However, errors in conductivity values created by the induction
158
component are small (less than 10 %), and therefore we reserve a detailed argument on
159
the inductive component.
160
Fig. 3 shows the conductivity of dolomite up to 1800 K in Arrhenian plot. In the
161
first heating, the conductivity largely increased by nearly two orders of magnitude at
162
1300 K and then increased by one order of magnitude at 1500 K. Above 1600 K, an
163
increase of conductivity with temperature became small. After annealing at 1800 K, the
164
conductivity slightly decreased with decreasing temperature. The high conductivity
165
values (10 S/m) were retained even after cooling below the melting temperature. Above
166
1500 K the good linear relation in Arrhenius plot was observed.
Conductivity-167
temperature relationships were determined from Arrhenian fits to the data for each
168 sample 169 σ =σ0exp − H kT ⎛ ⎝ ⎜ ⎞ ⎠ ⎟ (1) 170
where k is the Boltzmann constant and T is temperature in K. Activation enthalpies (H)
171
and pre-exponential terms (σ0) resulting from fitting Eq. (1) to the data are listed in 172
Table 1. The calculated activation enthalpy for electrical conduction in dolomite melt is
173
38 kJ/mol, which is slightly higher than the values (30–35 kJ/mol) reported from
174
Gaillard et al. (2008). The pre-exponential factor (σ0) for electrical conduction in 175
dolomite melt is 1343 S/m, which is lower than the values (3440 S/m) reported from
176
Gaillard et al. (2008). Therefore, the absolute conductivity value of the dolomite melt
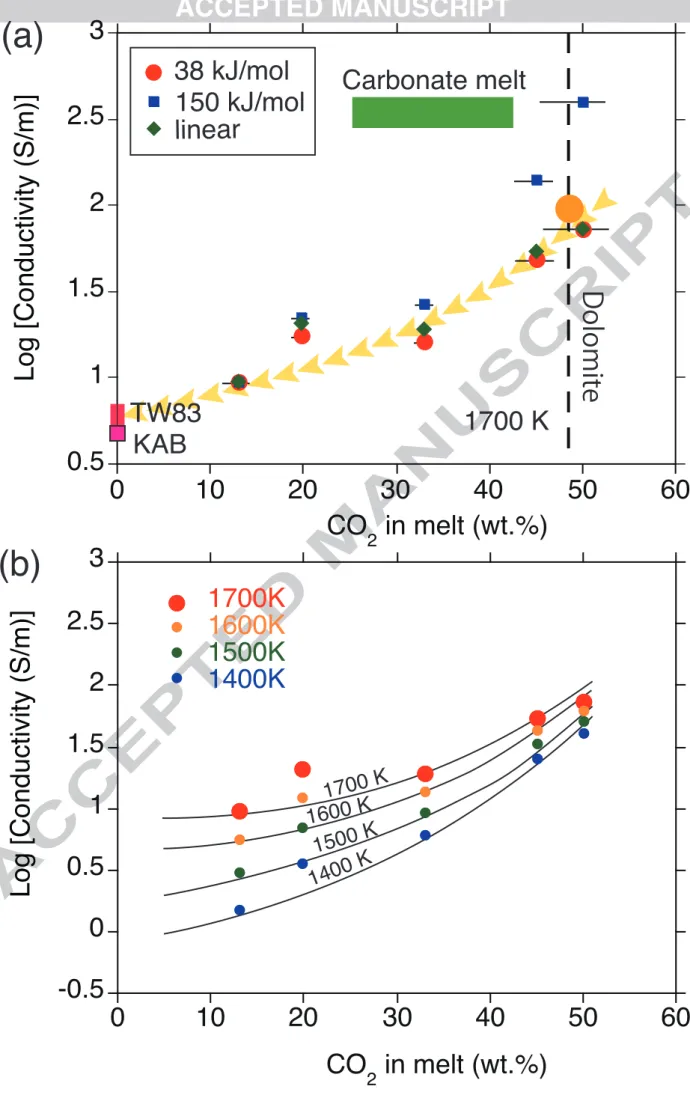
177
was slightly lower than those of alkali carbonate melt [KCa0.5]2(CO3)2, 178
(NaKCa0.5)2(CO3)3, (NaKCa)(CO3)2, (NaK)2(CO3)2, and (LiNaK)2(CO3)3] reported by 179
Gaillard et al. (2008).
180
An example of the conductivity measurements for the partial molten system is
181
shown in Fig. 4a. The conductivity values were initially high and rapidly decreased
182
during annealing at 1000 K because of the dehydration of surrounding materials. In the
183
second heating, the conductivity largely increased by nearly two orders of magnitude up
184
to 1100 K. This temperature is consistent with the temperature at which the conductivity
185
of Ca-rich carbonate abruptly increases during heating (e.g. Gaillard et al., 2008).
186
Above 1200 K, the conductivity slightly increased with increasing temperature up to
187
1500 K. At the beginning of annealing at 1500 K, the sample conductivity rapidly
188
decreased and then became constant within 2 hours, similar to our previous studies
189
(Yoshino et al., 2010). At the beginning of partial melting, the powder with large
190
porosity was instantaneously filled with melt. Therefore, the conductivity was initially
191
high. As the system established textural equilibrium during annealing, some pores were
192
closed to minimize the total interfacial energy in the system. This process led to the
193
reduction of the bulk conductivity of the sample. The impedance spectra showed part of
194
a semicircular shape at higher frequencies, suggesting that the conductive phase forms
195
an electrical pathway parallel to the solid matrix, and an additional part derived from
196
electrode reaction at the interface between the sample and electrode at lower
197
frequencies (Fig. 2). In the cooling path, the electrical conductivity decreased with
198
decreasing temperature. The temperature-conductivity path in the Arrhenius plot
199
showed linear trends with some different slopes, suggesting the conduction mechanism
200
changes in a certain temperature range. In the subsequent heating path, the
201
reproducibility was confirmed.
In the third heating, the conductivity values at the highest temperature were
203
identical to those just after the annealing for a few hours at the same temperature in the
204
second heating (Fig. 4a). The samples were quenched from the highest temperature to
205
obtain the partial molten texture of the final state. The conductivity values shown in
206
Table 1 were obtained just before quenching. Therefore, the sample texture and the
207
conductivity values represent the same condition as the second heating. Fig. 5 shows a
208
plot of the conductivity values at the maximum temperature and melt fraction against
209
the highest temperature experienced for each sample. The electrical conductivity of the
210
partial molten sample generally increased with increasing temperature. The melt
211
fraction increased from 0.01 to 0.20 in the investigated temperature range from 1400 to
212
1700 K.
213
Fig. 4b shows the logarithmic plot of conductivity versus reciprocal temperature
214
for the KLB1 + dolomite 3 wt.% system in the second cooling path. The electrical
215
conductivity of the carbonate-bearing peridotite is distinctly higher than that of
216
carbonate- and melt-free peridotite, which is similar to that of olivine (Constable 2006;
217
Yoshino et al., 2006; 2009). The samples annealed at higher temperatures showed lower
218
conductivity values at the same temperature, and larger temperature dependence
219
compared with the sample annealed at lower temperatures. Although samples have the
220
same bulk composition, the fact that the cooling paths in the Arrhenius plot are largely
221
different suggests that the chemical composition of the melt phase did not change
222
significantly during cooling. In other words, chemical equilibrium in the system was
223
established at the highest temperature, but not held during cooling. The activation
224
enthalpy for electrical conductivity of carbonate melt is smaller than those of silicate
225
melts (e.g., Presnall et al., 1972; Gaillard et al., 2008). A small temperature dependence
226
on the conductivity of samples annealed at lower temperature was quite similar to that
227
of dolomite end member, suggesting that carbonate concentration in the melt was
228
relatively high. This trend is consistent with a variation of the carbonate concentration
in the partial melt determined by the weight deficiency of the microprobe analysis
230
(Table 2).
231
4. Discussion
232
4.1. Relationship between conductivity and melt fraction
233
Carbonate-bearing melts have high wetting properties (e.g., Hunter and
234
McKenzie, 1989; Minarik and Watson, 1995; Hammouda and Laporte, 2000). The
235
previous works which determined dihedral angle of basalt and
olivine-236
carbonatite systems have shown similar values (20~30˚), which is much less than a
237
critical value (60˚) for interconnection (Hunter and McKenzie, 1989; Waff and Bulau,
238
1979; Yoshino et al., 2009b). Partial melt should form interconnected liquid networks at
239
olivine grain boundaries even at very low-volume fractions and should therefore
240
contribute to the bulk rock conductivity. Thus, a large change of melt connectivity with
241
melt fraction is not expected in the present system. If there was no threshold for the
242
interconnection, a relationship between conductivity (σbulk) and melt fraction (φ) can be 243
expressed by mixing models such as Hashin-Shtrikman upper bound. The previous
244
studies of the partial molten system with the constant melt composition demonstrated a
245
linear relationship in the log σ - log φ plot, which is known as the Archie's law (Archie,
246
1942). Archie's relationship can be expressed as follows:
247
σbulk= Cφ
nσ
m (2)
248
where C and n are constants (e.g., Watanabe and Kurita, 1993). The power exponent in
249
Archie’s relation should be close to unity for partial molten rocks with
well-250
interconnected melt geometry and the constant melt composition (Watanabe and Kurita,
251
1993; ten Grotenhuis et al., 2005; Yoshino et al., 2010). The exponent close to unity is
also valid for the other mixing models in the system containing the well-interconnected
253
phase.
254
In this study, the melt fraction in the sample changes with temperature under the
255
constant bulk CO2 composition (Fig. 6). The conductivity of the bulk rock increases 256
with increasing melt fraction in this study, which is in the same tendency with that in
257
the previous study, where CO2 concentration is constant not in the bulk rock but in the 258
melt (Yoshino et al., 2010). However, an increase of conductivity values with melt
259
fraction in this study is smaller than that in the previous study. The present system
260
yields much smaller exponent for Eq. (2), namely n = 0.58. In addition, the conductivity
261
values of dolomite melt, which is an end member of this system, does not agree with the
262
extrapolated trend (Fig. 6).
263
The Archie’s law is only applicable to the system with constant melt
264
conductivity. Thus, the “apparent” low power exponent (n = 0.58) obtained in this study
265
contains information about variation in melt conductivity with melt fraction. There are
266
two factors to vary the melt conductivity. One is temperature and the other is the CO2 267
concentration in the partial melt. First we consider thermal effect. The melt conductivity
268
generally increases with increasing temperature followed by Arrhenian relation. If we
269
consider the sample conductivity at 1700 K in order to directly compare the results of
270
our previous study (Yoshino et al., 2010), the power exponent would be much smaller
271
than 0.58, because the conductivity measured at lower temperature is relatively higher
272
than that determined at higher temperature. Such a low exponent value (< 0.58) further
273
increases the deviation from that (~1) expected from the partial molten rocks with a
274
constant melt composition. Therefore, temperature is not controlling factor.
275
Next we consider the effect of melt composition on the “apparent” low power
276
exponent. Gaillard et al. (2008) reported that carbonate melt has a distinctly higher
277
electrical conductivity than silicate melt. In the carbonate-bearing peridotite system, the
conductivity of the partial melt is expected to be controlled by the CO2 content in the 279
partial melt. In general, carbonatitic partial melts containing ~40 wt.% CO2 are stable 280
only in a limited temperature range above the solidus (Dalton and Presnall, 1998;
281
Gudfinnsson and Presnall, 2005; Dasgupta and Hirschmann, 2006; 2007; Dasgupta et
282
al., 2007). As the temperature approaches to the carbonate-free dry peridotite solidus
283
temperature, the reaction of carbonatite melts with silicate minerals in peridotite
284
produces carbonated silicate melts with a lower CO2 concentration (Moore and Wood, 285
1998; Dalton and Presnall, 1998; Gudfinnsson and Presnall, 2005; Dasgupta et al.,
286
2007). For example, Dasgupta et al. (2007) showed that the transition from carbonatite
287
(40 wt.% CO2) to carbonated silicate melt (≤ 25 wt.% CO2) in carbonate-bearing 288
peridotiteat 3 GPa occurs abruptly at 1623 K. This study also showed that the CO2 289
content in the partial melt is even lower at higher temperatures (~13 wt.% CO2 at 1700 290
K). Our measurement demonstrated that, at low melt fraction (~1 vol. %), the
291
conductivity values are similar to those of the olivine-carbonatite system (at 1650 K),
292
whereas at higher melt fraction (> 10 vol.%), the conductivity values are rather closer to
293
those of the olivine-basalt system measured at 1.5 GPa (Yoshino et al., 2010). Thus the
294
expected trend of the conductivity-melt fraction of the present system approaches to that
295
of the olivine-carbonatite (40 wt.% CO2) and the olivine-basalt trends at lower (< 0.3 296
vol.%) and higher (> 10 vol.%) melt fractions, respectively. As a result the small n
297
value obtained in the investigated range of melt fraction can be attributed to the
298
decrease of conductivity with carbonate content in the melt by increasing the annealing
299
temperature.
300
4.2. Estimation of liquid conductivity as a function of carbonate content
301
We next estimate the electrical conductivity of the carbonate-bearing melt itself
302
as a function of the CO2 concentration in the melt to compare it directly with melts with 303
various CO2 concentrations at constant temperature (1700 K). To do this, we made the 304
following two simple assumptions:
305
1) Electrical conductivity of the partial melt is proportional to the melt fraction.
306
For example, when the bulk conductivity of the sample with 10 vol.% melt fraction is
307
10 S/m, the melt conductivity can be calculated as 100 S/m. This assumption can be
308
justified since the power exponent n in Eq. (2) for partially molten rocks has a value
309
close to unity (Watanabe and Kurita, 1993; Roberts and Tyburczy, 2000; ten Grotenhuis
310
et al., 2005; Yoshino et al., 2010). In addition, if a difference between solid and melt
311
conductivities exceeds 3 orders of magnitude, the exponent estimated from the
Hashin-312
Shtrikman upper bound, which is frequently used for the melt-bearing system, yields
313
approximately unity for a case that melt fraction is above 0.01.
314
2) The effect of temperature on the conductivity of the melt is controlled by the
315
activation enthalpy for electrical conductivity of the melts. The activation enthalpy of
316
dolomite melts was 38 kJ/mol at 3 GPa. On the other hand, the average activation
317
enthalpies of basaltic melt are more than three times higher (110-150 kJ/mol) (Tyburczy
318
and Waff, 1983; Gaillard and Marziano, 2005). Thus, the temperature dependence of
319
the conductivity of the carbonate melts is much smaller than that of silicate melts. Since
320
silicate melts are likely to polymerize as the SiO2 component in the melt increases, its 321
activation enthalpy would increase with the increasing SiO2 component in the carbonate 322
melt. In the present study, the CO2 concentration in the melt varies considerably. 323
Therefore, the activation enthalpy is expected to gradually increase with decreasing CO2 324
concentration in the melt, because there is a negative-correlation between the SiO2 and 325
CO2 concentrations in the carbonate melt (Table 2). 326
The calculation scheme was as follows. First of all, the absolute conductivity
327
values of melt at temperature we measured were calculated based on the first
328
assumption that conductivity is proportional to melt fraction. To compare the
conductivity for each carbonate melt at constant temperature, the Arrhenian relation (Eq.
330
1) was used. The pre-exponential factors (σ0) for each carbonate melt were calculated 331
from the present data for two fixed activation enthalpies (38 and 150 kJ/mol), because
332
once the activation enthalpy is assumed, the unknown parameter in Eq. (1) is only σ0. 333
The calculated parameters are shown in Table 3. The σ0 calculated using high activation 334
energy (150 kJ/mol) yields higher values. Indeed, the activation enthalpy should change
335
with the carbonate component in the melt. To estimate more realistic melt conductivity,
336
the activation enthalpy was assumed to be a linear relation between pure carbonate (38
337
kJ/mol) and pure silicate melts (150 kJ/mol). Further calculation scheme was the same
338
as those presented earlier. The used parameters are also shown in Table 3. The
339
conductivities at 1700 K were calculated from Eq. (1) using the σ0 determined by this 340
study.
341
Fig. 7a shows the logarithmic plot of the electrical conductivity of the partial
342
melt in the KLB1 + dolomite 3 wt.% system as a function of the CO2 concentration in 343
the melt at 1700 K. Although the log of electrical conductivity was calculated using a
344
possible range of activation enthalpies, the activation enthalpy for the melt conductivity
345
with higher CO2 concentration (> 40 wt. %) should be low and close to that of dolomite 346
melt (38 kJ/mol), whereas that with lower CO2 concentration should be higher and 347
approach that of silicate melt (110-150 kJ/mol). Considering the effect of the CO2 348
concentration on activation enthalpy for the melt conductivity, the expected trend of the
349
electrical conductivity of the carbonate-bearing melt, which is in equilibrium with
350
peridotite, shows a large decrease of the electrical conductivity below 40 wt.% of CO2 351
(yellow arrows in Fig. 7a). The extrapolation of the melt conductivity to zero CO2 352
agrees well with the basaltic melt conductivity (TW83: Tyburczy and Waff, 1983;
353
KAB: Pommier et al., 2010). A variation of the estimated melt conductivity as a
354
function of CO2 concentration shows a plateau between 33 and 20 wt.% CO2. If there 355
exists a threshold for interconnection of chains of silicate tetrahedral in melt, an abrupt
change of melt conductivity and its activation enthalpy might be present. On the other
357
hand, the conductivity of the melt with higher CO2 concentration is quite consistent 358
with that of dolomite melt measured at 3 GPa, which is lower than those of the alkali
359
carbonate melt determined at atmospheric pressure (Gaillard et al., 2008). One
360
explanation for this discrepancy between dolomite and alkali carbonate melt is a
361
negative pressure dependence on the melt conductivity. Although Tyburczy and Waff
362
(1983) reported a negative pressure effect on silicate melts, which are highly
363
polymerized, there has been no relevant conductivity data for carbonate melts as a
364
function of pressure. According to Gaillard et al. (2008), there is a strong correlation
365
between viscosity and conductivity. However, the viscosity of carbonate melts has little
366
pressure effect (Dobson et al., 1996). Another explanation is that the carbonatite melt
367
has a relatively lower conductivity than the carbonate compound composed of alkali
368
elements such as Na and K measured by Gaillard et al. (2008).
369
Fig. 7b shows the conductivity enhancement by the carbonate component in the
370
melt as a function of temperature. The conductivity of carbonate-bearing melt increases
371
more than an order of magnitude with increasing CO2 concentration in the melt from 13 372
to 45 wt.%. The effect of the carbonate component in the partial melt becomes
373
significantly larger with increasing CO2 concentration, especially for higher than 40 374
wt.% of CO2. As the temperature increases, the conductivity dependence on CO2 375
becomes smaller because of the much lower activation enthalpies for melts with higher
376
CO2. It is concluded that the effect of the carbonate melt on the bulk rock conductivity 377
is larger at relatively lower temperatures.
378
4.3. Geophysical implications
379
The present study showed that electrical conductivity in carbonate-bearing
380
peridotite increases by a limited magnitude with increasing temperature. Only at very
381
low melt fractions and low temperatures just above the carbonate-bearing peridotite
solidus, the partial melting is very effective in raising the electrical conductivity of the
383
upper mantle. Therefore, in this section, we discuss only geological settings in which
384
the carbonate melt has very high CO2 concentration (> 40 vol. %). Fig. 8 shows the 385
conductivity-depth profile as a function of the melt fraction of carbonatite based on the
386
extrapolation of the trend in Fig. 6. In this figure, the temperature and pressure effects
387
on the conductivity were ignored, because activation enthalpy and volume for electrical
388
conductivity of carbonate melt are very small (Gaillard et al., 2008).
389
Dasgupta and Hirschmann (2006) experimentally demonstrated that the solidus
390
temperature of carbonate peridotite is lower than the upper mantle adiabatic geotherm
391
below the depth of 330 km. In addition, Hirschmann (2010) predicted that carbonatite
392
melt can exist below 150 km depth beneath the oceanic lithosphere based on the
393
thermodynamic model assuming the typical volatile contents (100 wt. ppm for H2O and 394
60 wt. ppm for CO2). Thus the conductivity anomaly in such a depth region (150~330 395
km) can be explained by the presence of very small amount of carbonate melt in
396
peridotite. The deep electrical conductivity profile beneath the northwestern Pacific
397
from Hawaii to North America, showed a conductivity anomaly of 10-1 S/m at a depth 398
of 200–250 km (Lizarralde et al., 1995). The conductivity of the partial molten
399
peridotite with a trace amount of carbonatitic melt should be similar to that of the
400
olivine-carbonatite system, because the carbonate concentration in the partial melt of
401
the carbonate peridotite is significantly high when the degree of melting is very low. If
402
this anomaly originates from the presence of carbonatite melt, the melt fraction can be
403
estimated to be less than 0.5 vol.% at that depth (Fig. 8). However, only peridotite with
404
at least 3000 ppm of CO2 could achieve this value from a carbonatite melt with high 405
CO2 concentration. 406
A recent one-dimensional (1-D) electrical conductivity model beneath the
407
Philippine Sea revealed an abrupt increase in the conductivity at around 75 km of the
upper mantle depths and a constant conductivity at a depth of 75–300km with
409
approximately 0.03 S/m (Baba et al., 2010). The seismic tomography indicates cold
410
slabs currently stagnant beneath the region around the Philippine Sea (Fukao et al.,
411
1992). The subducted slab can add carbonate materials through degassing or melting to
412
the above mantle wedge. The added CO2 or carbonate melt can raise the conductivity in 413
this region even if the temperature in this region is significantly lower than that in the
414
surrounding mantle. The conductivity value 0.03 S/m can be explained by a presence of
415
0.1 vol.% of carbonatitic melt (Fig. 8). Note that the depth of the abrupt increase in the
416
conductivity (75 km depth) is close to the lower bound of the stabilization of the
417
carbonate melt (e.g., Dalton and Presnall, 1998). We suggest that the large decrease in
418
conductivity above this depth should be attributed to the release of CO2 from the 419
carbonate melt because of its strong pressure dependence. Seismic evidence for a sharp
420
lithosphere–asthenosphere boundary beneath the Philippine Sea (Kawakatsu et al.,
421
2009) could also imply the presence of carbonate melt in the upper part of the
422
asthenosphere.
423
5. Conclusion
424
We performed electrical conductivity measurement at 3 GPa to elucidate the
425
changes in the electrical conductivity of partially molten carbonate-bearing peridotite as
426
functions of the melt fraction and CO2 concentration in the melt. When degree of 427
melting is low (< a few volume %), the conductivity of the carbonatitic melt is distinctly
428
higher than that of carbon-free silicate melt. Although the conductivity of the partial
429
molten peridotite increases with increasing temperature, the degree of the increase in
430
the electrical conductivity is obviously small compared with a case in which the melt
431
composition is constant. We identified that the conductivity changes as a consequence
432
of both an increase in the melt fraction and a decrease in the correlated carbonate
433
concentration in the partial melt with increasing temperature. Carbonate is identified as
the dominant charge carrier and the conductivity changes of the partial molten rocks are
435
attributed to change in the carbonate mobility controlled by the chemical composition of
436
the melt. When CO2 concentration in the melt decreases to 0 wt.%, the estimated melt 437
conductivity approaches to that of basaltic melt. Although the partial melt with 10 wt.%
438
CO2 at higher temperatures has slightly higher conductivity than basaltic melt, the 439
enhancement of electrical conductivity by the carbonate melt is the most effective in a
440
temperature range just above the carbonate peridotite solidus temperature. The electrical
441
conductivity of the partially molten region with carbonate in the upper mantle would
442
increase significantly for the case where the degree of melting is very small (< 1 vol.%).
443
Petrological knowledge of carbonate concentration in the partial molten rocks is needed
444
to estimate the melt fraction from the geophysical signature of the upper mantle.
445
Acknowledgements
446
The authors are grateful to E. Ito, D. Yamazaki, N. Tomioka, H. Utada, K. Baba,
447
K. Fuji-ta, M. Ichiki, and E. Takahashi for beneficial discussions and to C. Oka for
448
technical assistance. Comments by two anonymous reviewers were useful in improving
449
this paper. This work was supported by a Grant-in-Aids for Scientific Research, No.
450
20340120 to TY from the Japan Society for Promotion of Science. It was also supported
451
by the internship program (MISIP09) of the Institute for Study of the Earth’s Interior,
452
Okayama University.
453
References
454
Archie, G.E., 1942. Electrical resistivity log as an aid determining some reservoir
455
characteristics. Trans. Am. Inst. Min. Metall. Pet. Eng. 146, 54-62.
456
Baba, K., Chave, A.D., Evans, R.L., Hirth, G., Mackie, R.L., 2006. Mantle dynamics
457
beneath the East Pacific Rise at 17 S: Insights from the Mantle Electromagnetic and
Tomography (MELT) experiment. J. Geophys. Res. 111, B02101,
459
doi:10.1029/2004JB003598.
460
Baba, K., Utada, H., Goto, T., Kasaya, T., Shimizu, H., Tada, N., 2010. Electrical
461
conductivity imaging of the Philippine Sea upper mantle using seafloor magnetotelluric
462
data. Phys. Earth Planet. Int. 183, 44-62.
463
Constable, S., 2006. SEO3: A new model of electrical conductivity. Geophys. J. Int. 166,
464
435-437.
465
Dalton, J.A., Presnall, D.C., 1998. Carbonatitic melts along the solidus of model
466
lhelzolite in the system CaO-MgO-Al2O3-SiO2-CO2 from 3 to 7 GPa. Contrib. Mineral. 467
Petrol. 131, 123-135.
468
Dasgupta, R., Hirschmann, M.M., 2006. Melting in the Earth’s deep upper mantle
469
caused by carbon dioxide. Nature 440, 659–662.
470
Dasgupta, R., Hirschmann, M.M., 2007. A modified iterative sandwich method for
471
determination of near-solidus partial melt compositions. II. Application to
472
determination of near-solidus melt compositions of carbonated peridotite. Contrib.
473
Mineral. Petrol. 154, 647–661.
474
Dasgupta, R., Hirschmann, M.M., Smith, N.D., 2007. High pressure partial melting
475
experiments of peridotite + CO2 and genesis of alkalic ocean island basalts. J. Petrol. 48, 476
2093–2124.
477
Dobson, D.P., Jones, A.P., Rabe, R., Sekine, T., Kurita, K., Taniguchi, T., Kondo, T.,
478
Kato, T., Shimomura, O., Urakawa, S., 1996. In situ measurement of viscosity and
479
density of carbonate melts at high pressure. Earth Planet. Sci. Lett. 143, 207-215.
Evans, R.L., Hirth, G., Baba, K., Forsyth, D., Chave, A., Mackie, R., 2005. Geophysical
481
evidence from the MELT area for compositional controls on oceanic plates. Nature 437,
482
249–252.
483
Falloon, T.J., Green, D.H., 1989. The solidus of carbonated, fertile peridotite. Earth
484
Planet. Sci. Lett. 94, 364-370.
485
Fukao, Y., Obayashi, M., Inoue, H., Nenbai, M., 1992. Subducting slabs stagnant in the
486
mantle transition zone. J. Geophys. Res. 97, 4809-4822.
487
Gaillard, F., Iacono-Marziano, G., 2005. Electrical conductivity of magma in the course
488
of crystallization controlled by their residual liquid composition. J. Geophys. Res. 110,
489
B06204, doi:10.1029/2004JB003282.
490
Gaillard, F., Marki, M., Iacono-Marziano, G., Pichavant, M., Scaillet, B., 2008.
491
Carbonatite melts and electrical conductivity in the asthenosphere. Science 322,
1363-492
1365.
493
Gudfinnsson, G.H., Presnall, D.C., 2005. Continuous gradations among primary
494
carbonatitic, kimberlitic, melilititic, basaltic, picritic, and komatiitic melts in
495
equilibrium with garnet lherzolite at 3–8 GPa. J. Petrol. 46, 1645–1659.s
496
Hammouda, T., Laporte, D., 2000. Ultrafast mantle impregnation by carbonatite melt.
497
Geology 28, 283-285.
498
Hampton, N.A., Karunathilaka, S.A.G.R., Leek, R., 1980. Impedance of electrical
499
storage-cells. J. Appl. Electrochem. 10, 3-11.
500
Hirschmann, M.M., 2010. Partial melt in the oceanic low velocity zone. Phys. Earth
501
Planet. Int. 179, 60-71.
Hunter, R.H., McKenzie, D., 1989. The equilibrium geometry of carbonate melts in
503
rocks of mantle composition. Earth Planet. Sci. Lett., 92, 347-356.
504
Jegen, M., Edwards, R.N., 1998. Electrical properties of a 2D conductive zone under
505
the Juan de Fuca ridge. Geophys. Res. Lett. 25, 3647-3650.
506
Kawakatsu, H., Kumar, P., Takei, Y., Shinohara, M., Kanazawa, T., Araki, E., Suyehiro,
507
K., 2009. Seismic evidence for sharp lithosphere-asthenosphere boundaries of oceanic
508
plates. Science 324, 499–502
509
Lizarralde, D., Chave, A.D., Hirth, G., Schultz, A., 1995. A Northern Pacific mantle
510
conductivity profile from long-period magnetotelluric sounding using Hawaii to
511
California submarine cable data. J. Geophys. Res. 100, 17837-17854.
512
Minarik, W.G., Watson, E.B., 1995. Interconnectivity of carbonate melt at low melt
513
fraction. Earth Planet. Sci. Lett. 133, 423-437.
514
Moore, K.R., Wood, B.J., 1998. The transition from carbonate to silicate melts in the
515
CaO–MgO–SiO2–CO2 system. J. Petrol. 39, 1943–1951. 516
Pommier, A., Gaillard, F., Malki, M., Pichavant, M, 2010. Methodological
re-517
evaluation of the electrical conductivity of silicate melts. Am. Mineral. 95, 284-291.
518
Presnall, D.C., Simmons, C.L., Porath, H., 1972. Change of electrical conductivity of a
519
synthetic basalt during melting. J. Geophys. Res. 77, 5665-5672.
520
Rigden, S.M., Ahrens, T.J., Stolper, E.M., 1984. Densities of liquid silicates at high
521
pressures. Science 226, 1071-1074.
522
Roberts, J.J., Tyburczy, J.A., 2000. Partial-melt conductivity: Influence of melt
523
composition. J. Geophys. Res. 104, 7055-7065.
Shankland, T.J., Waff, H.S., 1977. Partial melting and electrical conductivity anomalies
525
in the upper mantle. J. Geophys. Res. 82, 5409-5417.
526
ten Grotenhuis, S.M., Drury, M.R., Spiers, C.J., Peach, C.J., 2005. Melt distribution in
527
olivine rocks based on electrical conductivity measurement. J. Geophys. Res. 110,
528
B12201, doi:10.1029/2004JB003462.
529
Tyburczy, J.A., Waff, H.S., 1983. Electrical conductivity of molten basalt and andesite
530
to 25 kilobars pressure: geophysical significance and implications for charge transport
531
and melt structure. J. Geophys. Res. 88, 2413-2430.
532
van Hassel, B.A., Boukamp, B.A., Burggraaf, A.J., 1991. Electrode polarization at the
533
Au, O2 (g) /yttria stabilized zirconia interface. Part I: Theoretical considerations of
534
reaction model. Solid State Ionics, 48, 139-154.
535
Waff, H.S., Bulau, J.R., 1979. Equilibrium fluid distribution in an ultramafic partial
536
melt under hydrostatic stress conditions. J. Geophys. Res. 84, 6109–6114.
537
Watanabe, T., Kurita, K., 1993. The relationship between electrical conductivity and
538
melt fraction in a partially molten simple system. Phys. Earth Planet. Int. 78, 9-17.
539
Yoshino, T., Takei, Y., Wark, D.A., Watson, E.B., 2005. Grain boundary wetness of
540
texturally equilibrated rocks, with implications for seismic properties of the upper
541
mantle. J. Geophys. Res., 110, B08205, doi:10.1029/2004JB003544.
542
Yoshino, T., Matsuzaki, T., Yamashita, S., Katsura, T., 2006. Hydrous olivine unable to
543
account for conductivity anomaly at the top of the asthenosphere. Nature, 443, 973-976.
Yoshino, T., Matsuzaki, T., Shatzkiy, A., Katsura, T., 2009a. The effect of water on the
545
electrical conductivity of olivine aggregates and its implications for the electrical
546
structure in the upper mantle. Earth Planet. Sci. Lett. 288, 291-300.
547
Yoshino, T., Yamazaki, D., Mibe, K., 2009b. Well-wetted olivine grain boundaries in
548
partial molten peridotites in the asthenosphere. Earth Planet. Sci. Lett. 283, 167-173.
549
Yoshino, T., Laumonier, M., McIsaac, E., Katsura, T., 2010. Electrical conductivity of
550
basaltic and carbonatite melt-bearing peridotites at high pressures: implications for melt
551
distribution and melt fraction in the upper mantle. Earth Planet. Sci. Lett. 295, 593-602.
Figure captions
553
Fig. 1. Back-scattered electron images (BEI) of polished samples with a chemical
554
composition of KLB1 + dolomite 3 wt.% and with various proportions of
carbonate-555
bearing melt. (a) Run# 1K1364, annealed at 1400 K. (b) Run# 1K1173, annealed at
556
1500 K. (c) Run# 1K1174, annealed at 1600 K. (d) Run# 1K1361, annealed at 1700 K.
557
White bars correspond to 10 µm.
558
Fig. 2. Impedance spectra of carbonate-bearing peridotite samples obtained during
559
cooling as a function of temperature. All samples have a bulk composition of the KLB1
560
+ dolomite 3 wt.%. Samples were annealed at 1500 K (a), 1600 K (b), and 1700 K (c).
561
Note the first semicircular arc at high frequencies followed by a pseudo-inductive part
562
and an additional tail derived from electrode reaction at low frequencies.
563
Fig. 3. Electrical conductivity of (Ca,Mg)CO3 as a function of reciprocal temperature. 564
Note that the conductivity after melting is much higher than that before melting.
565
Fig. 4. Electrical conductivity of the peridotite-dolomite system as a function of
566
reciprocal temperature. (a) Run# 1K1173, peridotite with 3 wt.% carbonatite during the
567
heating (open symbols)-cooling (closed symbols) cycles. (b) All samples for peridotite
568
with and without 3 wt.% dolomite. The symbols indicate raw data of the cooling path
569
after annealing at the maximum temperature for each sample with different melt
570
fractions. Abbreviations; C06: the latest model of olivine electrical conductivity at 0.1
571
MPa under IW (iron-wüstite) buffers from Constable (2006). YMYK06: a conductivity
572
range of electrical conductivity of olivine single crystal at 3 GPa under Ni-NiO buffer
573
from Yoshino et al. (2006).
574
Fig. 5. Electrical conductivity and melt fraction versus temperature for the system with
575
KLB1 + 3 wt.% dolomite.
Fig. 6. Relationship between the melt fractions and electrical conductivities for the
577
carbonate-bearing partial molten peridotite. Data of the olivine + carbonatitic melts
578
(1650 K and 3 GPa) with constant CO2 concentration in the melt, and the olivine + 579
basalt melts (1.5 GPa and 1600 K; i.e. no CO2) are also plotted (Yoshino et al., 2010). 580
The shaded region indicates a typical range of conductivity values of basaltic melt (e.g.,
581
Presnell et al., 1972). The thick dashed line indicates an expected conductivity-melt
582
fraction relation for the carbonate-bearing peridotite system. Star symbol denotes
583
conductivity of dolomite melt, which is an end member of the system used for the
584
present study at 1700 K. Note that the trend of the carbonate-bearing partial molten
585
peridotite (KLB1 + dolomite 3 wt.%) is inconsistent with the conductivity value of
586
dolomite melt.
587
Fig. 7. Log electrical conductivity σ of melt in the KLB1 + dolomite 3 wt.% system as a
588
function of CO2 concentration in the melt. (a) Symbols represent the log σ of the 589
carbonate-bearing melt calculated at 1700 K assuming various activation enthalpies for
590
the electrical conductivity of the melt. Orange circle represents the conductivity value
591
of dolomite melt at 1700 K. The dashed line denotes the CO2 concentration in dolomite 592
(Ca,Mg)CO3. The red square symbols indicate the conductivity values of silicate melt 593
(TW83: Tyburczy and Waff, 1983; KAB, Kilauea alkali basalt: Pommier et al., 2010).
594
The green area indicates the conductivity range of the carbonate melt determined at
595
atmospheric pressure (Gaillard et al., 2008). Note that as CO2 concentration in the melt 596
increases, the conductivity of the partial melt in carbonate-bearing peridotite increases
597
by nearly an order of magnitude. The yellow dashed arrows denote a predicted trend of
598
the melt conductivity. (b) The log σ of the carbonate-bearing melt as a function of CO2 599
concentration in the melt for different temperatures based on a case for variable
600
activation enthalpy (Table 3). Note that as temperature decreases, the conductivity
601
depends more strongly on the CO2 concentration in the melt. 602
Fig. 8. Melt fraction of carbonatite melt with a high CO2 concentration (> 40 wt. %) 603
estimated from the reference one-dimensional (1-D) conductivity models obtained by
604
geophysical observations. The yellow colored area denotes the reference 1-D models for
605
the north Pacific obtained by Lizarralde et al. (1995). The red line indicates the 1-D
606
model for the Philippine Sea mantle (Baba et al., 2010).
Table 1. Summary of runs
608
Run No. vol.%a T
max (K) logσmax (S/m) b CO2 (wt.%) c Phase assemblage d Remarks
609 KLB1 610 1K1178 0 1700 -1.87 0 ol(Fo90)-opx-cpx-grt 611 KLB1 + Dolomite 1 wt.% 612 1K1161 1.0 1400 -0.25 n.d. ol(Fo90)-opx-cpx-grt-melt 613
1K1158 20 - 0.50 5(1) ol(Fo93)-melt Incorrect T reading
614 KLB1 + Dolomite 3 wt.% 615 1K1364 0.5 1400 -0.48 ~50 ol(Fo90)-opx-cpx-grt-dol-melt 616 1K1173 1.8 1500 -0.21 45(3) ol(Fo91)-opx-cpx-grt-dol-melt 617 1K1174 11 1600 0.18 33(2) ol(Fo93)-cpx-melt 618 1K1363 14.7 1650 0.49 20(1) ol(Fo93)-cpx-melt 619 1K1361 20.3 1700 0.29 13(3) ol(Fo92)-cpx-melt 620 Dolomite 621 S2367 100 1800 2.02 47.7 melt ∆H = 38 kJ/mol 622 σ0 = 1343 S/m 623
All experiments were conducted at 3 GPa.
624
a: Volume percent of melt phase in run products determined by image analysis.
625
b: Log conductivity measured at maximum temperature just before quenching.
626
c: CO2 concentration in melt estimated from the total weight deficit of the EPMA analysis. 627
d: Abbreviations: ol; olivine, opx; orthopyroxene, cpx; clinopyroxene, grt; garnet, dol; dolomite
628 629
Table 2. Melt composition of run products
630 1K1173 1K1174 1K1363 1K1361 631 1500 K 1600 K 1650 K 1700 K 632 SiO2 5.10(26) 18.90(89) 32.18(151) 38.94(93) 633 TiO2 0.42(10) 0.02(23) 0.55(12) 0.48(10) 634 Al2O3 2.03(62) 2.15(48) 12.18(53) 11.05(51) 635 FeO* 7.47(141) 4.52 (101) 3.57(102) 7.07(89) 636 NiO 0.02(2) 0.02(3) 0.06(6) 0.03(3) 637 MnO 0.17(5) 0.13(2) 0.18(1) 0.16(1) 638 MgO 13.58(491) 14.20(114) 7.26(115) 13.01(242) 639 CaO 24.99(225) 24.95(372) 24.05(134) 14.68(503) 640 Na2O 1.10(23) 1.57(23) 1.07(4) 1.54(34) 641 K2O 0.35(7) 0.58(5) 0.45(4) 0.14(7) 642 Total 55.24(269) 66.97(103) 81.55(128) 87.10(165) 643
The chemical compositions of melt were measured by the electron probe
644
microanalyzer under the operating condition of 15 kV and 12 nA.
645 646 647 648 649
Table 3. Parameters used for calculation of melt conductivity
650
1K1364 1K1173 1K1174 1K1363 1K1361 651
1400 K 1500 K 1600 K 1650 K 1700 K 652
Cases for the fixed activation enthalpy 653 150 kJ/mol 654 logσ0(S/m) 7.21 6.76 6.03 5.96 5.59 655 logσ1700K(S/m) 2.60 2.15 1.43 1.35 0.98 656 38 kJ/mol 657 logσ0(S/m) 3.03 2.86 2.38 2.41 2.15 658 logσ1700K(S/m) 1.87 1.69 1.21 1.25 0.98 659
A case for variable activation enthalpy 660
∆H (kJ/mol) 38 49 76 105 121
661
logσ0(S/m) 3.03 3.25 3.62 4.54 4.70
10 µm
ol
1400 K
1500 K
1700 K
1600 K
GRT OL CPX OPX OL OL CPX M M(a)
(b)
(c)
(d)
Fig. 1. Yoshino et al.
-6000
-4000
-2000
0
0
2000
4000
6000
8000
10000
12000
14000
1300 K
1400 K
1500 K
1600 K
1700 K
1200 K
1200 K
1250 K
1300 K
1350 K
1400 K
1500 K
1600 K
1250 K
1300 K
1350 K
1400 K
1500 K
Z'' (b)Z
real
(Ohm)
Z
img
(Ohm)
-2000
0
0
2000
4000
6000
8000
10000
-4000
-2000
0
0
2000
4000
6000
8000
10000
12000
T
max1600K
T
max1700K
0.1Hz
0.1MHz
10kHz
1 kHz
0.1MHz
10kHz
1 kHz
0.1Hz
0.1Hz
0.1MHz
10kHz
1 kHz
-4
-3
-2
-1
0
1
2
0.5
0.6
0.7
0.8
0.9
1
1.1
1000/T
Log
[Conductivity
(S/m)]
Dolomite
heating
cooling
-5
-4
-3
-2
-1
0
1
0.5
0.6
0.7
0.8
0.9
1
1.1
1.2
1.3
1400 K
1500 K
1600 K
Log
[Conductivity
(S/m)]
1000/T
KLB1 + dolomite 3 wt.% -5 -4 -3 -2 -1 0 0.6 0.7 0.8 0.9 1 1.1 1.2 1.31K1173
KLB1 + dolomite 3 wt.%
1st C 2nd H 2nd C 3rd HLog
[Conductivity
(S/m)]
1000/T
(b)
C
06
o
l
YM
YK
06
1650 K
1700 K
carbonate-free
peridotite
-1
-0.5
0
0.5
0
0.05
0.1
0.15
0.2
0.25
1300
1400
1500
1600
1700
1800
Conductivity
Melt fraction
Log [Conductivity (S/m)]
Melt fraction
Temperature (K)
Melt fraction
Log
[Conductivity
(S/m)]
n =
1.14
n =
0.89
-2
-1
0
1
0.001
0.01
0.1
1
carbonatite with constant CO
2basalt at 1600 K (1.5 GPa)
Log
[Conductivity
(S/m)]
Melt fraction
n = 0.58
KLB1 + 3 wt.% dolomite
Fig. 6. Yoshino et al.
Dolomite melt at 1700 K
Fig. 7. Yoshino et al.
0
10
20
30
40
50
60
CO
2
in melt (wt.%)
38 kJ/mol
150 kJ/mol
0.5
1
1.5
2
2.5
linear
Dolomite
TW83
Log
[Conductivity
(S/m)]
1700 K
Carbonate melt
Log
[Conductivity
(S/m)]
1700 K
1600 K
1500 K
1400 K
KAB
-0.5
0
0.5
1
1.5
2
2.5
3
0
10
20
30
40
50
60
(b)
1700K
1600K
1500K
1400K
CO
2
in melt (wt.%)
0
50
100
150
200
250
300
350
400
-5
-4
-3
-2
-1
0
1
Log [Conductivity (S/m)]
Depth (km)
0.01 vol.%
0.1 vol.%
1 vol.%
Highlights
663
1. We investigated electrical conductivity of partially molten carbonate peridotite.
664
2. On the solidus, the conductivity was markedly higher than that of carbonate-free
665
peridotite.
666
3. Electrical conductivity is not markedly increased by higher melting degree. 667
4. The moderate increase is attributed to a decrease in carbonate content in the partial melt. 668
5. The conductivity in the upper mantle is enhanced by very small degree of melting.
669 670

![Antideuteron production in ϒ(nS) decays and in e[superscript +]e[superscript −] → q[bar over q] at √s ≈ 10.58 GeV](data:image/gif;base64,R0lGODlhAQABAIAAAP///wAAACH5BAEAAAAALAAAAAABAAEAAAICRAEAOw==)