HAL Id: hal-00297073
https://hal.archives-ouvertes.fr/hal-00297073
Submitted on 6 Mar 2008
HAL is a multi-disciplinary open access
archive for the deposit and dissemination of
sci-entific research documents, whether they are
pub-lished or not. The documents may come from
teaching and research institutions in France or
abroad, or from public or private research centers.
L’archive ouverte pluridisciplinaire HAL, est
destinée au dépôt et à la diffusion de documents
scientifiques de niveau recherche, publiés ou non,
émanant des établissements d’enseignement et de
recherche français ou étrangers, des laboratoires
publics ou privés.
Development of a daily gridded precipitation data set
for the Middle East
A. Yatagai, P. Xie, P. Alpert
To cite this version:
A. Yatagai, P. Xie, P. Alpert. Development of a daily gridded precipitation data set for the Middle
East. Advances in Geosciences, European Geosciences Union, 2008, 12, pp.165-170. �hal-00297073�
www.adv-geosci.net/12/165/2008/ © Author(s) 2008. This work is licensed under a Creative Commons License.
Advances in
Geosciences
Development of a daily gridded precipitation data set for
the Middle East
A. Yatagai1, P. Xie2, and P. Alpert3
1Research Institute for Humanity and Nature, Kyoto, Japan
2NOAA/NWS/NCEP Climate Prediction Center, USA
3Tel-Aviv University, Israel
Received: 11 March 2007 – Revised: 10 June 2007 – Accepted: 3 March 2008 – Published: 6 March 2008
Abstract. We show an algorithm to construct a
rain-gauge-based analysis of daily precipitation for the Middle East. One of the key points of our algorithm is to construct an accurate distribution of climatology. One possible advantage of this product is to validate high-resolution climate models and/or to diagnose the impact of climate changes on local hydrologi-cal resources. Many users are familiar with a monthly precip-itation dataset (New et al., 1999) and a satellite-based daily precipitation dataset (Huffman et al., 2001), yet our data set, unlike theirs, clearly shows the effect of orography on daily precipitation and other extreme events, especially over the Fertile Crescent region. Currently the Middle-East precipi-tation analysis product is consisting of a 25-year data set for 1979–2003 based on more than 1300 stations.
1 Introduction
The distribution of precipitation is important for water man-agement especially for the arid/semi-arid regions. Quanti-tative estimate of precipitation is critical in understanding the hydrological balance and for improving climate forecast models.
Recent climatological models project that the East Mediterranean/Mid-East will have less rainfall and lower river discharge owing to global warming (Milly et al., 2005; Nohara et al., 2006, Kitoh et al., 2008). Many attempts have been made to estimate the impact of global warming on hydrological resources and agricultural production systems over these regions (Kimura, 2005, Alpert et al., 2006) Cli-mate model resolution is improving, with the ultiCli-mate goal being to project the impact of global warming on local envi-ronments.
Correspondence to: A. Yatagai
However, reliable interpretation of the impact of global warming on local environments hinges on the availability of a high-resolution precipitation data set to use as a validation tool. In addition, accurate simulations of the frequency of extreme events are in great demand, also warranting a daily precipitation data set. A recent study (Alpert et al., 2002) of rainfall trends in the Mediterranean basin has shown a seem-ingly paradoxical increase in extreme rainfall events, despite a decrease in the total amount of rainfall. Therefore, quanti-tative estimates based on observed daily precipitation values and their time-space variability are essential for assessing the impacts of global warming on local hydrological resources.
In spite of their importance, current observed precipitation patterns, especially over the Middle East region, are not well reported because of a lack of progress in data compilation. In the last decades, some satellite-based fine (∼1.0 degree) grid precipitation data have become available (Huffmann et al, 2001) and used for validation of high resolution models. However, arid/semi-arid regions are one of the most difficult places for satellite-remote sensing technique to estimate pre-cipitation. Moreover, satellite products are not sufficient for evaluating extreme events, and they have not been archived for a long-term data yet.
For examining the impact of climate changes on terres-trial hydrological resources, rain-gauge based grid monthly precipitation data sets on 0.5 degree grid, such as New et al. (1999) and Chen et al. (2001) are widely used. However, daily grid precipitation data set have not been developed over the Middle-East region and are not at a resolution more use-ful for high impact studies.
Xie et al. (2007) recently developed a daily grid precipi-tation data set for East Asia on the basis of a new algorithm and rain gauge-based daily precipitation data. We use this al-gorithm as a basis for the analysis of daily precipitation over the Middle East region. In Sect. 2 we present the individ-ual gauge data sets and the objective interpolation technique used for our analysis and difference between this analysis
166 A. Yatagai et al.: A Middle Eastern daily grid precipitation data set and Xie et al. (2007) in terms of method. In Sect. 3 we
com-pare the results of our analysis with those of several other gauge-based analyses.
2 Rain gauge data and method of analysis
2.1 Algorithm steps
The algorithm steps are as follows.
1. Define monthly precipitation climatology from 30 years or longer data.
2. Interpolate (1) onto a 0.05 degree grid using the Shepard (1968) algorithm
3. Define daily precipitation climatology by averaging daily precipitation from 5–20 years of data and then truncating the averaged time series after the first six har-monics.
4. Interpolate (3) onto a 0.05 degree grid using the Shepard (1968) algorithm
5. Adjust daily precipitation climatology (4) by monthly precipitation climatology (2) (The idea behind this is explained later)
6. Compute analysis field of the ratio of daily observation to daily climatology (5) for the target day
7. Calculate the daily precipitation by multiplying the daily climatology (5) by the daily ratio (6).
The above algorithm steps differ from those of Xie et al. (2007) in the following two points. First, Xie et al. (2007) employed Parameter-elevation regressions on Independent Slopes Model (PRISM) monthly precipitation climatology created by Daly et al. (1994) for China and Mongolia in step 5. Second, we used the Shepard (1968) algorithm for interpolation in step 6, whereas Xie et al. (2007) used opti-mum interpolation (OI) technique (Gandin, 1965) in step 6.
We consider expressing the possible effects of orography on precipitation by interpolating the daily ratio field sepa-rately from the mean field. Dai et al. (1997) argued that defin-ing monthly precipitation by adddefin-ing the interpolated anomaly of monthly mean climatology to climatology is better than directly interpolating the total precipitation, because some of the spatial variation of total precipitation is associated with local topography and is thus steady. Hence it is said that the orographic effect is implicitly considered in such a method. Further, such a strategy to interpolate anomalies has an advantage that the climatological pattern is reproduced even when some of data is missing in each month. New et al. (1999) and Chen et al. (2002) chose the anomaly (or ratio) of monthly precipitation to the monthly climatology as their interpolation quantity.
Besides, we must consider that the gauge stations are sparsely distributed in higher elevation, which attributes to a possible underestimation of precipitation. The above implicit approach (interpolate of anomaly or ratio to the station clima-tology) will not correct such biases. PRISM defines monthly precipitation climatology through locally established empir-ical relationships between rainfall and elevation (Daly et al., 1994) and Xie et al. (2007) simply used PRISM (China and Mongolia) to reproduce orographic effect explicitly in step 2. However, PRISM or PRISM-type climatological dataset is not currently available for the Middle East, although a dy-namical 2-D model for orographic rainfall was proposed by Alpert and Shafir (1989).
Xie et al. (2007) used the monthly climatology of Chen et al. (2002) outside China and Mongolia where the PRISM is not available, because 1) interpolation of observations from a dense net-work yields spatial distributions that better rep-resent orographic effects even it is implicit way, and 2) the monthly precipitation data were more reliable because local meteorological agencies check them carefully. Sometimes we could not distinguish between missing data and 0 mm of rainfall in the daily precipitation data set, especially those are derived from global tele-communication system (GTS).
We took the same strategy in this Middle East analysis. We processed more rain gauge stations over Iran for monthly precipitation data set than that of daily precipitation data set as described in the next section. The original daily data from Turkey was recorded only the day of precipitation observed that means, we sometimes could not make out whether it was 0mm precipitation or missing of observation. Daily data outside of Turkey and Israel were from GTS, so that it was based on real-time archive data base. Hence, we performed step 5, and then adjusted the daily precipitation climatology by monthly precipitation climatology, so that the seasonal pattern of daily climatology is determined by (3) and total magnitude of monthly precipitation is retained with (1).
2.2 Gauge data
It is undoubtedly very important to collect rain gauge data from as many stations as possible to create a gauge-based analysis data set. To create the monthly precipitation clima-tology (step 1) and the daily precipitation climaclima-tology anal-ysis (step 3), we collected monthly and daily precipitation data using the following data sources in the domain 15◦E–
70◦E, 15◦N–55◦N to give an analysis (gridded data set) for
20◦E–65◦E, 20◦N–50◦N.
2.2.1 Monthly precipitation
We obtained monthly precipitation data from a total of 1222 stations.
1. Turkey
Monthly precipitation data from 225 stations for 1975– 2004 compiled by the Turkish State Meteorological
Service were used to compute the monthly precipitation climatology.
2. Israel
Monthly precipitation from 19 stations for the 1960s to the present from the Israel Meteorological Service were used to compute the monthly precipitation climatology. 3. Iran
We obtained two kinds of monthly precipitation data from the home page of the Islamic Republic of Iran Me-teorological Organization (http://www.irimet.net). We used data from 154 World Meteorological Organization (WMO) stations and from 183 non-WMO stations. The data coverage period differed among stations, with the longest period from the 1960s to the present. In this analysis, we used data from stations with at least 5 years of data to compute the monthly climatology.
4. Precipitation climatology by Chen et al. (2002) We used the same data base that was adopted for Chen et al. (2002) for countries other than the above three. It was created from the Global Historical Climatolog-ical Network (GHCN) version-2 (Peterson and Vose, 1997) data set and Climate Anomaly Monitoring Sys-tem (CAMS; Ropelewski et al., 1985) datasets. In their analysis, the climatology (climate normal) was com-puted from stations with at least 5 years of observation records within a 40-year data base for 1951–1990. 2.2.2 Daily precipitation
We used daily precipitation data from a total of 1394 stations. The total number is more than that of monthly precipitation data sets; because we used stations of GTS even when they have not relatively long records to define climatology.
1. Turkey
We used daily precipitation data from 338 stations with observation records covering at least 20 years, compiled by the Turkish State Meteorological Service.
2. Global Telecommunication System (GTS)
We used GTS data from stations with 5 or more years of records during 1978–2004 in the data domain (15◦E–
70◦E; 15◦N–55◦N), except Turkey.
3 Analysis and comparison with other data sets
As indicated in Sect. 2.1, we first defined the monthly cli-mate normal by using the data from 1222 stations. Then, we analyzed the climate normal using the algorithm of Shepard (1968) to interpolate the values into 0.05◦grid squares.
Figure 1 shows January precipitation climatology for a 0.5◦ grid. We defined monthly climatology in step 2) on
0.05◦grid, but for display purpose to make the lower panel of
Step 2
Fig. 1. (a) Monthly precipitation climatology (mm/day) for January in the Middle East. (b) Number of rain gauges in each 0.5◦×0.5◦ grid box.
Fig. 1 clear, here we show the re-gridded data for a 0.5◦grid.
The lower panel of Fig. 1 shows station availability. Com-pared with the previous analysis version (Yatagai, 2005), mountain precipitation over the western Zagros Mountains now appears as a result of the addition of the Iranian data. Figure 2 shows February precipitation climatology of this analysis (0.05 degree grid, step 2) and 10 minutes precipi-tation climatology by Climate Research Unit (CRU) of Uni-versity of East Anglia. The CRU precipitation climatology showed a similar pattern with that of ours, but precipitation along the western slop of Zagros Mountains in Iran is not clear compared to that of our analysis. Also, a precipitation zone south of the Caspian Sea can be clearly observed in our analysis.
As described in the previous section, we adjusted the monthly total amount of daily precipitation climatology (step 4) by the monthly precipitation climatology (step 2). An example of the adjusted daily precipitation climatology (step 5) as well as that of before adjustment (step 4) is shown
168 A. Yatagai et al.: A Middle Eastern daily grid precipitation data set
Step 2
Fig. 2. Upper panel: A monthly precipitation climatology analy-sis for February. Lower panel: Precipitation estimated by Climate Research Unit (CRU) data set for the same month.
in Fig. 3. The middle panel of Fig. 3 (step 4) shows daily cli-matology of day 306 (1 November for a leap year) and that of bottom panel shows the station availability of the daily data sets. By adjusting this daily climatology with monthly clima-tology with station network shown in Fig. 1 (step 2), the pat-tern adjusted precipitation climatology (top panel) shows en-hanced precipitation zones over the south of Caspian Sea and along the Zagros Mountains. The improvement of both re-gions in terms of expressing precipitation zones are attributed from dense network of Iranian monthly data.
Patterns of orographically induced precipitation over east-ern Anatolia and the coastal areas of Turkey and Israel are shown. October and November are important months for rain-fed agriculture in Turkey and Israel because they are the beginning of the rainy season. A crescent-shaped precipi-tation zone is observed along the Jordan Valley northward through northwestern Syria into southeastern Turkey (Anato-lia), then eastward through northern Iraq, and finally south-eastward along the western side of the Zagros Mountains in western Iran. The pattern is shifted a little northward into Anatolia and eastward into Iran compared with the ancient region known as the “Fertile Crescent” (Bellwood, 2004). In particular, the modern high-precipitation zone is at a higher elevation than the ancient ruins on the Fertile Crescent were.
Step 5
Step 4
Figure 3. A sample of daily precipitation climatology from late October (306 Julian day, Fig. 3. A sample of daily precipitation climatology from late Octo-ber (306 Julian day, 1 NovemOcto-ber). Top panel: adjusted daily precip-itation climatology by monthly climatology, middle panel: original daily precipitation climatology, lower panel: number of gauges of daily precipitation data set shown in 0.5 degree grid box.
Observations as well as models clearly show that orographi-cally induced precipitation in Anatolia and the Zagros Moun-tains is a very important water resource in the Fertile Cres-cent region.
After defining the daily climatology (step 5), we calcu-lated the ratio of the daily observed precipitation at each station to the corresponding daily grid climatology for the target day. Figure 4 shows an analysis (step 7) of the pre-cipitation on 21 January 2000. Since we used the original daily observation data, the time interval of a day may differ from country to country. For example, in case of Israel, a record of 21 January means precipitation observed between 02:00 UTC of 20 January to 02:00 UTC of 21 January. Com-pared with the Global Precipitation Climatology Project 1 de-gree daily (GPCP1DD) data (Huffman et al., 2001) (Fig. 4, middle and lower diagram), patterns of heavy precipitation along the eastern Mediterranean coast, the northern part of Turkey and in southeastern Anatolia are clearly displayed.
Step 7
Figure 4. Upper panel: A sample daily gauge-based analysis for 21 January 2000 (0200–0200 Fig. 4. Upper panel: A sample daily gauge-based analysis for 21 January 2000 (02:00–02:00 UTC, 20 January, 2000 for Israel). Mid-dle and Lower panel: Precipitation estimated using the GPCP1DD data set for the 20 and 21 January, 2000, respectively (00:00– 00:00 UTC).
The daily grid values represented extreme events better than that of satellite one. The GPCP1DD is made of Infrared (IR) satellite images, and precipitation is estimated from the cloud top temperature.
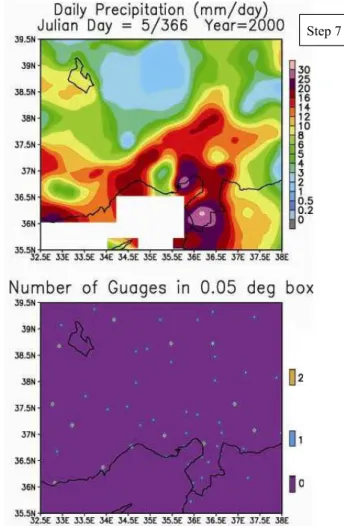
Since the analysis used a 0.05◦grid, a detailed pattern is
seen where rain gauge data are available. Figure 5 (step 7) shows an enlarged view of the Chukurova basin in south cen-tral Turkey. Although the monthly climatology aided the in-terpolation, in this analysis we could not reproduce an oro-graphic effect where no daily rain gauge data or climatolog-ical data were available. Only a few stations are situated in the upper reaches of the Ceyhan and Seyhan rivers, which flow into this basin.
Step 7
Fig. 5. A sample daily analysis for 5 January 2000 for the Chukurova basin, Turkey. The lower panel shows the number of gauges in each 0.05◦grid square.
4 Concluding remarks
We conducted a gauge-based analysis of daily precipita-tion for the East Mediterranean (data domain, 15◦E–70◦E;
15◦N–55◦N). Monthly long-term precipitation data from
1222 stations including 337 Iranian stations, and daily pre-cipitation data from 1394 stations within the domain were analyzed according to the method described by Xie et al. (2007). The rain gauge analysis showed the character-istics of the orographic precipitation pattern very well, and the daily grid values represented extreme events well.
Efforts to develop a PRISM-type monthly climatology data set by using Geographic Information System (GIS) data and satellite products are under way and results are expected in the near future. Here we showed an example of how our method works, especially for the technique to use monthly climatology to adjust daily climatology. The same improve-ments and performance were observed for other seasons over the same region. This was also true for the East Asia
170 A. Yatagai et al.: A Middle Eastern daily grid precipitation data set analysis (Xie et al., 2007) over South Asia as well as China
where PRISM was available. However, we need to further check the quality of the data and performance of our method when/where we have denser GTS data compared to off-line monthly precipitation data archive.
We have an advantage of making dataset on a 0.05◦grid
as an intermediate product. So that we can easily regrid from this fine-resolution interval to other grid intervals as needed. For example, we used our climatology product to validate the MRI’s 20-km mesh GCM simulation result by interpolating the product onto the model grid (Yatagai et al., 2005, 2006; Kitoh et al., 2008). Applications of this data set are reported in other places.
Recently, many retrieval algorithms using both IR and mi-crowave images have been proposed, however, precipitation retrieval over the arid/semi-arid regions is one of the most difficult places in the world. Hence, this rain-gauge-based grid precipitation dataset should be very important for vali-dating satellite products as well as for hydro-meteorological studies.
Acknowledgements. This research is being performed as a project on the “Asian Precipitation – Highly Resolved Observational Data Integration Towards the Evaluation of the water resources (APHRODITE’s water resources)”, and it is supported by the Global Environment Research Fund (GERF-FS051, B062) of the Ministry of Environment, Japan. This work was supported by Grants-in-Aid for Scientific Research (No. 10540467) from JSPS, and a research project on the “Impact of Climate Changes on Agricultural Production Systems in Arid Areas (ICCAP)”, administered by the Research Institute for Humanity and Nature (RIHN) and the Scientific and Technical Research Council of Turkey (T ¨UB ´YTAK). This research is part of the GLOWA - Jordan River Project funded by the German Ministry of Science and Education (BMBF), in collaboration with the Israeli Ministry of Science and Technology (MOST).
Edited by: P. Alpert, H. Saaroni, and E. Heifetz Reviewed by: two anonymous referees
References
Alpert, P. and Shafir, H.: Meso-ϒ scale distribution of orographic precipitation: numerical study and comparison with precipitation derived from radar measurements, J. Appl. Meteor., 28, 1105– 1117, 1989.
Alpert, P., Ben-Gai, T., Baharad, A., Benjamini, Y., Yekutieli, D., Colacino, M., Diodato, L., Ramis, C., Homar, V., Romero, R., Michaelides, S., and Manes, A.: The paradoxical increase of Mediterranean extreme daily rainfall in spite of decrease in to-tal values, Geophys. Res. Lett., 29, 11, 31-1–31-4, 2002. Alpert, P., Krichak, S. O., Dayan, M., and Shafir, H.: Climatic
trends over the Eastern Mediterranean: past and future projec-tions, CLIVAR Exchanges, 11, 2, 12–13 April 2006.
Bellwood, P. S.: The first farmers: origins of agricultural societies, Blackwell Publishing, 360 pp., 2004.
Chen, M., Xie P., Janowiak, J. E., and Arkin, P. A.: Global land precipitation: a 50-year monthly analysis based on gauge obser-vations, J. Hydrometeorol., 3, 249–266, 2002.
Daly, C., Neilson, R. P., and Phillips, D. L.: A statistical-topographic model for mapping climatological precipitation over mountainous terrain, J. Appl. Meteor., 33, 140–158, 1994. Dai, A., Fung, I. Y., and Del Genio, A. D.: Surface observed
global land precipitation variations during 1900–88, J. Climate, 10, 2943–1962, 1997.
Huffman, G. J., Adler, R. F., Morrissey, M. M., Bolvin, D. T., Cur-tis, S., Joyce, R., McGavock, B., and Susskind, J: Global precip-itation at one-degree daily resolution from multi-satellite obser-vations, J. Hydrometeor., 2(1), 36–50, 2001.
Kimura, F.: Trend in precipitation during the next 80 years in Turkey estimated by pseudo warming experiment, The progress report of ICCAP, ICCAP Publication 7, RIHN,11-12, 2005. Kitoh, A., Yatagai, A., and Alpert, P.: First super-high-resolution
model projection that the ancient “Fertile Crescent” will disap-pear in this century, Hydrol. Res. Lett., 2, 1–4, 2008.
Milly, P. C. D., Dunne, K. A., and Vecchia A. V.: Global pattern of trends in streamflow and water availability in a changing climate, Nature, 438, 347–350, 2005.
New, M. G., Hulme, M., and Jones, P. D.: Representing twentieth century space-time climate variability. Part I: Development of a 1961–90 mean monthly terrestrial climatology, J. Climate, 12, 829–856, 1999.
Nohara, D., Kitoh, A., Hosaka, M., and Oki, T: Impact of climate change on river discharge projected by multi-model ensemble, J. Hydrometeorol., 7, 1076–1089, 2006.
Peterson, T. C. and Vose, R. S.: An overview of the Global Histor-ical Climatology Network temperature database, B. Am. Meteo-rol. Soc., 78, 2837–2849, 1997.
Shepard, D.: A two-dimensional interpolation function for irreg-ularly spaced data, Proc. 23 ACM Nat’l Conf., Princeton, NJ, Brandon/Systems Press, 517–524, 1968.
Xie, P., Yatagai, A., Chen, M., Hayasaka, T., Fukushima, Y., Liu, C. and Song, Y: Daily precipitation analyses over East Asia: A gauge-based data set with orographic modification, J. Hydrome-teorol., 8, 607–626, 2007.
Yatagai, A., Xie, P., and Kitoh, A.: Utilization of a new gauge-based daily precipitation dataset over monsoon Asia for validation of the daily precipitation climatology simulated by the MRI/JMA 20-km-mesh AGCM, SOLA, 1, 193–196, doi:10.2151/sola.2005-050, 2005.
Yatagai, A.: Preliminary analysis of Turkish precipitation, ICCAP Publication 7, The progress report of ICCAP, RIHN, P13–18, 2005.
Yatagai, A., Kimura, F., Kitoh, A., and Watanabe, T.: Analyses of precipitation for assessing global warming impacts on hydro-logical regime in Adana, Turkey, Proceeding of the International Symposium on Water and Land Management for Sustainable Ir-rigated Agriculture, at Cukurova University, Adana-Turkey, 4–8 April 2006.