HAL Id: hal-00302899
https://hal.archives-ouvertes.fr/hal-00302899
Submitted on 28 Aug 2007
HAL is a multi-disciplinary open access
archive for the deposit and dissemination of
sci-entific research documents, whether they are
pub-lished or not. The documents may come from
teaching and research institutions in France or
abroad, or from public or private research centers.
L’archive ouverte pluridisciplinaire HAL, est
destinée au dépôt et à la diffusion de documents
scientifiques de niveau recherche, publiés ou non,
émanant des établissements d’enseignement et de
recherche français ou étrangers, des laboratoires
publics ou privés.
Rényi dimensions and pedodiversity indices of the earth
pedotaxa distribution
F. J. Caniego, J. J. Ibáñez, F. San José Martínez
To cite this version:
F. J. Caniego, J. J. Ibáñez, F. San José Martínez. Rényi dimensions and pedodiversity indices of the
earth pedotaxa distribution. Nonlinear Processes in Geophysics, European Geosciences Union (EGU),
2007, 14 (4), pp.547-555. �hal-00302899�
www.nonlin-processes-geophys.net/14/547/2007/ © Author(s) 2007. This work is licensed
under a Creative Commons License.
Nonlinear Processes
in Geophysics
R´enyi dimensions and pedodiversity indices of the earth pedotaxa
distribution
F. J. Caniego1, J. J. Ib´a ˜nez2, and F. San Jos´e Mart´ınez1
1Dept. Applied Mathematics to Agriculture Engineering, E.T.S.I Agr´onomos, Technical University of Madrid, 28040 Madrid,
Spain
2CIDE, CSIC-UV, Albal, 46470 Valencia, Spain
Received: 15 January 2007 – Revised: 20 August 2007 – Accepted: 20 August 2007 – Published: 28 August 2007
Abstract. Pedodiversity, the study and measurement of soil
diversity, may be considered as a framework to analyze spa-tial patterns. Recently, selfsimilar multifractal patterns have been recently reported in the pedotaxa-abundance distribu-tions at the planetary scale. This is the result to be expected from the complexity of earth soil systems. When the state of soil is understood as the outcome of nonlinear chaotic dy-namic, highly irregular patterns with so-called multifractal behavior should be common. This opens the opportunity to use parameters of fractal theory to characterize pedodi-versity. We compute R´enyi generalized dimensions for the abundance distribution of pedotaxa for the five landmasses and the whole World drawn from the most detailed available global dataset based on the second level of the FAO 1974 classification units. We explore the effective relationship be-tween diversity indices and R´enyi dimensions. We show how multifractal analysis unifies diversity indices and how they should be interpreted offering a coherent perspective with a single mathematical procedure to analyze spatial patterns of the pedosphere.
1 Introduction
Study and measurement of diversity of soils, or pedodiversity (Ib´a˜nez et al., 1995; Phillips, 1999, 2001; Guo et al., 2003), became an emerging topic of pedology during the last years. Pedodiversity, as well as biodiversity, may be considered as a framework to analyze spatial patterns, being recognized as a novel pedometric tool (McBratney et al., 2000). Currently, diversity can be characterized through distributions of taxa abundances and indices of diversity (Pielou, 1975).
Jenny (1941) was the first to assert that soil may be under-stood as a function of environmental variables or soil
form-Correspondence to: F. San Jos´e Mart´ınez
ing factors, i.e. climate, organisms (biosphere), relief (to-pography and drainage), parent material (geology) and time. Within this paradigm, the state of soil or the state of a par-ticular soil property may be represented as the outcome of a nonlinear dynamical system (Ib´a˜nez et al., 1990), and com-plexity and heterogeneity of earth soil systems can be placed within the framework of the theory of complex systems, non-linear dynamics and deterministic chaos. Therefore, highly irregular configurations and multifractal behaviors are likely to be encountered (Beck and Schl¨ogl, 1995). In this context, it can be expected that the pedotaxa-abundance distributions show complex behavior similar to multifractal patterns. Our previous study showed that the pedotaxa abundances at plan-etary scale (Caniego et al., 2006) exhibit multifractal scaling. Caniego et al. (2006) explored the multifractal structure of pedodiversity at global scale estimating the spectra of singu-larities and the spectra of generalized dimensions or R´enyi spectra (Grassberger, 1983) of the pedotaxa abundances of the five continental and island landmasses and the whole pe-dosphere. The mathematical relationship between diversity indices and R´enyi dimensions was suggested.
In this paper we focus primarily on the characterization of pedodiversity through indices in the realm of multifrac-tal theory through R´enyi dimensions and their empirical re-lationship with the diversity indices, i.e. richness, entropy, Simpson index, Berger-Parker index, and evenness. The in-terrelationships between pedodiversity indices, areal extend, and soil forming factors are also explored. In this way new tools will be at hand to analyze the pedodiversity of the mul-tifractal patterns of the earth’s soil systems at planetary scale.
2 Diversity indices versus R´enyi dimensions
A number of indices have been introduced in the literature on diversity. Margalef (1958) was the first to use information theory to study ecological diversity in the search for general
548 F. J. Caniego et al.: R´enyi dimensions and pedodiversity of earth pedotaxa laws that explain ecosystem structures. Since then the
mea-surement of variety in the natural world has become a scien-tific topic that has eventually moved beyond the boundaries of the biological sciences.
The R´enyi information theory (R´enyi, 1961) summarized a number of diversity indices in the following way. If pi (i=1 . . . N ) are the probabilities of a discrete random vari-able with possible outcomes xi obtained for example by
coarse graining a continuous variable, then the R´enyi infor-mation functions can be defined as Hq=[1/(1−q)]PNi=1p
q i
(q6=1), and H =−PNi=1pilog pi. Note that lim
q→1Hq=H is
the Shannon entropy. Now consider that pi (i=1, 2, . . ., N )
is the proportion of the area covered by the ith soil in the total sampled area (Ib´a˜nez et al., 1998). In this case Shan-non entropy has been found to be a useful index of diversity besides such indices as the richness, R=N , the Simpson in-dex, S =
r P i=1
pi2, the evenness, E=H /Hmax(Hmaxbeing the
maximal entropy) and the Berger-Parker index, B= max
i {pi}
(Magurran, 1988; Ib´a˜nez et al., 1998; Borda-de-Agua et al., 2002)
To introduce multifractal related indices of diversity, con-sider the pedotaxa-abundance distributions as mass distribu-tions and let µi(ε) be the measure or mass of the i-cell of
the partition with cell size equal to ε, thenPN (ε)i=1 µi(ε)=1,
where N (ε) is the number of cells of size ε (Everstz and Mandelbrot, 1992).
In order to characterize the multifractal scaling of the dis-tribution, the R´enyi or generalized dimensions can be com-puted using the expressions (Grassberger, 1983)
Dq∝ 1 q − 1 logPn(ε)i=1µi(ε)q log ε , (1) (q6=1) and D1∝ Pn(ε) i=1µi(ε) log µi(ε) log ε . (2)
Here, the symbol “∝” means scaling or asymptotic behavior as ε→0 and n(ε) stands for number of cells with non zero mass. Note that lim
q→1Dq=D1.
The entropy or Shannon index of a partition with a cell size equal to ε is given by H =−Pn(ε)i=1µi(ε) log µi(ε).
Therefore, the entropy dimension, D1(Eq. 2), provides the
growth rate of the Shannon index as the size of the parti-tion shrinks. The correlaparti-tion or Simpson index (Scheuring and Riedi, 1994; Borda-de-Agua et al., 2002) is defined as S=Pn(ε)i=1µi(ε)2. For multifractal measures, the growth of
the Simpson index with respect to the size partition follows a power law being the correlation dimension, D2, the exponent
of this scaling (Eq. 1 for q=2). The Berger-Parker index is introduced as a measure of dominance (Magurran, 1988) by the expression B= max
i {µi(ε)}. For large q, the right hand
side of Eq. (1) is dominated by the largest values. The di-mension D∞(= lim
q→∞Dq) characterizes the scaling property
of this index of dominating values.
Following Pielou (1975) the ratio D1/D0 can be
inter-preted as a measure of evenness in the context of multifrac-tals (Caniego et al., 2003, 2006). The entropy dimension D1
gauges the concentration degree of the distribution of abun-dances on the set supporting pedotaxa abunabun-dances whose ge-ometrical size is characterized by D0. In this way D0could
be interpreted as an indicator of richness of the pedotaxa dis-tribution. The value of D0 is the maximum value D1 may
attain. The closer to one the ratio D1/D0, the more even is
the pedotaxa distribution over the set of sizes or abundances. This suggests that D1/D0may be seen as a measure of the
evenness of the distribution.
3 Pedotaxa abundance distributions of the pedosphere:
dataset and parameter estimation
F. Nachtergaele (Land and Development Division, FAO, UN, Rome, Italy) provided us with the data on pedotaxa assem-blages of the pedosphere by countries of the world. They are obtained from the FAO Soil Database. As far as we know, this is the most detailed dataset at a global scale. This dataset contains 135 different soil pedotaxa units which correspond to the 1974 FAO keys at 2nd Level of the Soil Map of the World (FAO 1974, 1988). The geometric support is admin-istrative with 209 units that are mainly countries. For each administrative unit, the dataset contains the information of the areal extent of each pedotaxa in km2. The area of the smallest administrative unit considered is 22.9 km2(Golan) and 12 837 877.50 km2is the largest one (Asian part of the Russian Federation). The smallest area occupied by a pedo-taxa has an area of 71.74 km2and appears in Oceania, while the largest one has an area of 5 917 865.40 km2and belongs to Asia.
The administrative units were grouped by continents (Africa, America, Asia, Europe and Oceania) to obtain the total land area of each pedotaxa for each continent. Then, they were normalized by the total area of the corresponding continent. In addition, the pedotaxa assemblage composition for the entire land surface of the Earth was considered.
The probability measure or mass distribution µ is con-structed over the unit interval for each continent and the whole World. This was applied to Asia that was used as a case study to show how this interval was obtained (see Sect. 4). The size scales ε=2−k were considered as a par-tition of the unit interval; Ii(ε) (i=1, 2, . . ., N (ε)=2k) was
the i-cell or subinterval of the partition of characteristic size scale ε. The quantity µi(ε)=µ(Ii(ε)) was the measure or
mass proportion of Ii(ε): then µi(ε) corresponds to total
area fraction of pedotaxa with size fractions belonging to Ii(ε). Successive dyadic partitions of the unit interval were
used when analyzing the measure µ. The size of the finest
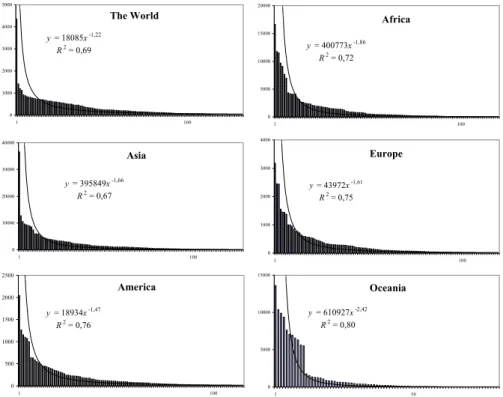
The World y = 18085x-1,22 R2 = 0,69 0 1000 2000 3000 4000 5000 1 100 Asia y = 395849x-1,66 R2 = 0,67 0 10000 20000 30000 40000 1 100 America y = 18934x-1,47 R2 = 0,76 0 500 1000 1500 2000 2500 1 100 Africa y = 400773x-1,86 R2 = 0,72 0 5000 10000 15000 20000 1 100 Europe y = 43972x-1,61 R2 = 0,75 0 1000 2000 3000 4000 1 100 Oceania y = 610927x-2,42 R2 = 0,80 0 5000 10000 15000 1 50
Fig. 1. Ranked abundance list of pedotaxa-abundance distributions.
partition was ε=2−6. The generalized R´enyi dimensions Dq
were estimated by the least-square fitting of the correspond-ing expressions (1) and (2) to data. The parameter q ranged from −4 to 4 in increments of 0.5; hence, we considered 17 possible scalings. The number of pairs included in the least-square fits was six which corresponded to the number of successive dyadic partitions considered. Coefficients of de-termination R2obtained from all the fittings were recorded. The number of dyadic partitions as well as the range of q’s retained is related to the quality of the fits as characterized by the corresponding coefficient of determination R2.
4 Results and discussion
The plots of the rank-abundance list for each continent land-mass and the whole World are shown in Fig. 1. They show lists ordered by extension of soil types, the soil with the largest extension is the first in list. The rank abundance de-pendencies followed the Zipf law: E(R)≈R−α where E(R) is the extension of the soil type that occupies the rank R in the classification of soil taxa by sizes. Values of α were about 1.7 (the greatest value was 2.4 for Oceania and the smallest value 1.2 was for the planet). Table 1 contains diversity indices (i.e. richness, Shannon entropy, Simpson index, Berger-Parker in-dex and evenness) for these distributions.
The number of soil types with extension greater or equal than a certain value N (E≥λ) follows the Pareto distribution
y = 0,24x + 0,38 R2 = 0,96 0 1 2 3 4 5 0 5 10 15 20 log A lo g R
Fig. 2. Richness-area relationships by countries for the whole word.
N (E≥λ)≈λ−zwith exponent z=1+(1/α). This is a pattern common to geometrical fractal objects (Mandelbrot, 1983). It has also been observed in various ecological contexts, and fractals have been applied to model spatial and temporal pat-terns of biodiversity (Hastings and Sugihara, 1993).
The pedorichness-area relationship for the whole world is shown in Fig. 2. It depicts the number of different soil types as a function of extent considering the richness of soil taxa in each of the 209 different units of the dataset. Area intervals were defined to form octaves (Preston, 1962a, b). This relationship can be approximated well with the power law relationship with the exponent close to 0.25. The same pattern has been observed in biodiversity studies for islands
550 F. J. Caniego et al.: R´enyi dimensions and pedodiversity of earth pedotaxa
Table 1. Diversity index for the different continents and the World: R, richness, H , entropy, S, Simpson index, B, Berger-Parker index and
E, evenness.
Diversity index Africa America Asia Europe Oceania World
R 107 108 110 108 69 128
H 4.05 4.12 4.21 4.12 3.47 4.43
S 0.02 0.02 0.02 0.02 0.04 0.02
B 0.05 0.05 0.04 0.04 0.08 0.03
E 0.87 0.89 0.9 0.88 0.82 0.91
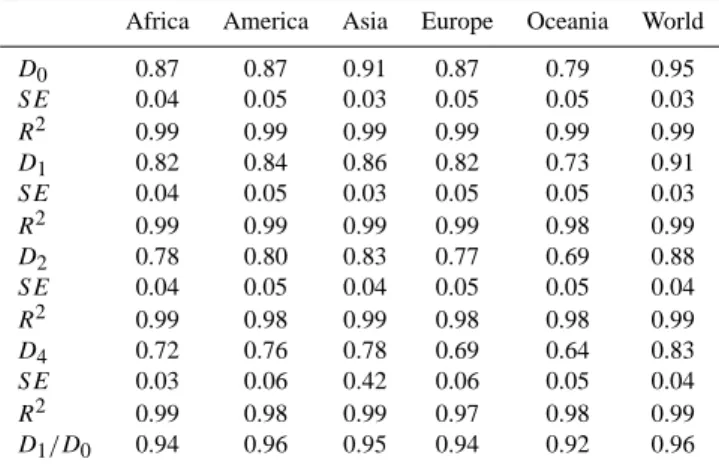
Table 2. Selected R´enyi dimensions for the different continents and the World, standard errors (SE) and R2. The values of R´enyi dimensions and R2were reported in Caniego et al. (2006).
Africa America Asia Europe Oceania World
D0 0.87 0.87 0.91 0.87 0.79 0.95 SE 0.04 0.05 0.03 0.05 0.05 0.03 R2 0.99 0.99 0.99 0.99 0.99 0.99 D1 0.82 0.84 0.86 0.82 0.73 0.91 SE 0.04 0.05 0.03 0.05 0.05 0.03 R2 0.99 0.99 0.99 0.99 0.98 0.99 D2 0.78 0.80 0.83 0.77 0.69 0.88 SE 0.04 0.05 0.04 0.05 0.05 0.04 R2 0.99 0.98 0.99 0.98 0.98 0.99 D4 0.72 0.76 0.78 0.69 0.64 0.83 SE 0.03 0.06 0.42 0.06 0.05 0.04 R2 0.99 0.98 0.99 0.97 0.98 0.99 D1/D0 0.94 0.96 0.95 0.94 0.92 0.96
(MacArthur and Wilson 1967; May, 1975). Power law scal-ings of pedorichness-area relationships were first conjectured by Ib´a˜nez and de Alba (2000) for earth soil systems and they have been reported for different soil classifications and geo-graphical units (Ib´a˜nez et al., 2005a; Caniego et al., 2005). They may be interpreted as indicators of the selfsimilarity of the pedorichness spatial distribution.
Table 2 contains dimensions D0, D1, D2 and D4, and
the ratio, D1/D0 with standard errors and coefficients of
determination. The multifractal behavior of the pedotaxa-abundance distributions is clearly expressed in the noticeable change of all the multifractal parameters with q (see Caniego et al. (2006) for further details).
The number of dyadic partitions used for the parameter estimation establishes an effective lower cut-off in the range of possible considered scales. Actually, this lower cut-off is related to the nature and accuracy of the dataset. The multi-fractal analysis determines also an upper cut-off in the range of scales where a nice fit is detected. In this way, a range of scales is selected where a scaling and a multifractal be-havior were evaluated. Let us consider Asia as a case study. The spectrum of R´enyi dimensions did not follow the pat-tern of multifractal measures when considering all the possi-ble soil types in this continent (Fig. 3a). The shape of the
Dq function changed dramatically when the soil with the
greatest areal extent was not included (Fig. 3b) and it kept changing when more soil types were excluded (Fig. 3c). This trend stabilized when the number of considered soils was 110 (there were 128 different soil types in Asia) (Fig. 3d) and it coincided with the best coefficient of determination of D0.
This gave the criterion used to determine an upper cut-off in the pedotaxa distribution of sizes to perform dimension estimates for the multifractal analysis of pedodiversity. In this way a characteristic scale could be selected in each case. About half of the taxa whose sizes were larger than the upper cut-off selected with this criterion corresponded to soil units of the major groups Regosols and Lithosols or to miscellanea units like Dunes and Shift Sand, Rock Debris and Glaciers (FAO, 1998). It has been suggested that the small number of soils units they have – Lithosols and above mentioned mis-cellanea units have no soil units – in comparison with the areal extend they cover could be explained by the fact that they do not present any agronomic interest (see Ib´a˜nez and Ruiz-Ramos (2006) and Ib´a˜nez et al. (2006) for a more de-tail discussion on the human bias of taxonomies). Ib´a˜nez et al. (2006) encountered similar discrepancies when dealing with the mathematical structure of biological and pedological taxonomies using a more profuse branching soil taxonomic system as the USDA Soil Taxonomy.
Similar effects have been reported when considering frac-tal patterns at incomparably larger scale for the distribution of galaxies (Gaite et al., 1999). In this context, the upper cut-off was interpreted as a transition to homogeneity. In a similar way, the break of the multifractal behavior of the pe-dotaxa abundance distribution might be interpreted as a tran-sition to a less complex pattern. In that respect, it is inter-esting to consider here the reflections of Mandelbrot (1983) on the effective dimension of an object. The mathematical theory provides a model where scaling behavior is valid for any scale, i.e. any real number, no matter how large or small it might be. When analyzing real objects we need to con-sider the resolution and the actual size of the representation of the object. They provide the minimum “available” size but also the maximum “possible” one. These could be seen as the boundaries of the scale range where the mathemati-cal model captures the multifractal pattern of the real object. These boundaries may be related to absence of detail. This
(a) 0,4 0,5 0,6 0,7 0,8 0,9 1 1,1 1,2 -4 -3 -2 -1 0 1 2 3 4 q D q (b) 0,4 0,5 0,6 0,7 0,8 0,9 1 1,1 1,2 -4 -3 -2 -1 0 1 2 3 4 q D q (c) 0,4 0,5 0,6 0,7 0,8 0,9 1 1,1 1,2 -4 -3 -2 -1 0 1 2 3 4 q D q (d) 0,4 0,5 0,6 0,7 0,8 0,9 1 1,1 1,2 -4 -3 -2 -1 0 1 2 3 4 q D q
Fig. 3. Dqfunctions with errors bars for Asia with different number of soils with indication of extension in km2of the largest soil considered:
A – 128 soils, 36 623 km2; B – 127 soils, 12 766 km2; C – 126 soils, 10 582 km2; D – 110 soils, 3868 km2.
y = 352,31x - 204,33 R2 = 0,93 50 80 110 140 0,6 0,7 0,8 0,9 1 D0 R y = 5,22x - 0,26 R2 = 0,95 3 3,5 4 4,5 5 0,6 0,7 0,8 0,9 1 D1 H y = 5,11x - 0,21 R2 = 0,94 0 1 2 3 4 5 0,6 0,7 0,8 0,9 1 D2 log S y = 5,01x - 0,53 R2 = 0,86 0 1 2 3 4 5 0,6 0,7 0,8 0,9 1 D4 log B y = 2,01x - 1,02 R2 = 0,77 0,6 0,7 0,8 0,9 1 0,8 0,9 1 D1/D0 E
Fig. 4. Correlations diversity indices-dimensions of the continents and the whole world. Richness (R), Entropy (H ), Simpson index (S), Berger-Parker index (B) and Evenness (E).
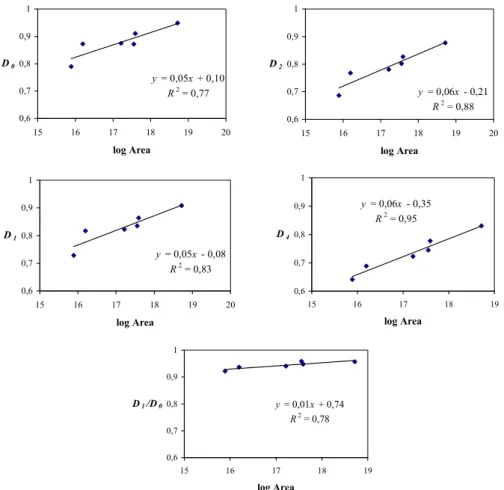
552 F. J. Caniego et al.: R´enyi dimensions and pedodiversity of earth pedotaxa y = 0,05x + 0,10 R2 = 0,77 0,6 0,7 0,8 0,9 1 15 16 17 18 19 20 log Area D0 y = 0,05x - 0,08 R2 = 0,83 0,6 0,7 0,8 0,9 1 15 16 17 18 19 20 log Area D1 y = 0,01x + 0,74 R2 = 0,78 0,6 0,7 0,8 0,9 1 15 16 17 18 19 log Area D1/D0 y = 0,06x - 0,21 R2 = 0,88 0,6 0,7 0,8 0,9 1 15 16 17 18 19 20 log Area D2 y = 0,06x - 0,35 R2 = 0,95 0,6 0,7 0,8 0,9 1 15 16 17 18 19 log Area D4
Fig. 5. Correlations R´enyi dimensions-area (km2) of the continents and the whole world. Caniego et al. (2006) reported a similar relationship
of D0, D1and D1/D0with the area.
might suggest an explanation of the lower cut-off in this case. One can imagine a finer dataset with more detailed informa-tion about smaller soil units. But, as pointed out by Mandel-brot (1983), the scale range boundaries may also be related to a transition between scales with well defined dimensions. In this way the upper cut-off might manifest the appearance of a different pedological pattern for objects larger than our planet.
Figure 4 shows the correlations of diversity indices and R´enyi dimensions. These correlations could be interpreted as an indirect indication of the suitability of this mathemati-cal tool for describing pedodiversity. In the context of com-plex and multifractal phenomena, these findings suggest that R´enyi dimensions D0, D1, D2and D4, and the ratio D1/D0
may serve as indicators of richness, heterogeneity, correla-tion, dominance and evenness, respectively.
R´enyi dimensions D0, D1, D2and D4, and ratio D1/D0
increased as the continent area increases (see Fig. 5). This suggests that area is the major driving force. The slope of the regression line for the ratio D1/D0is rather small as the
evenness for all of the continental landmasses is very close to the value obtained at the planetary scale. The similarity
in the increase of the capacity dimension D0and the entropy
dimension D1with respect to area may reflect the fact that
area affects both in a similarly way. Dimensions D2and D4
are the most affected by area. Similar results have been ob-tained by Ib´a˜nez et al. (1998) using major soil groups of the FAO (26 pedotaxa).
The fit of the logarithmic potential law (y= ln xa+b) to the dependencies of R´enyi dimensions on area (see Fig. 5) shows that an increment of the area for large values produces a very “small” impact in the increment of the dependent variable, i.e. the derivative of this function is similar to x−pwith pos-itive p. Therefore, when the area grows, new taxa are added, but the increment of the amount of taxa is smaller than the increased area, so that levels of complexity are similar for the large continents. Moreover, with the exception of Ocea-nia, all the landmasses have a large enough extent to include various environmental heterogeneities.
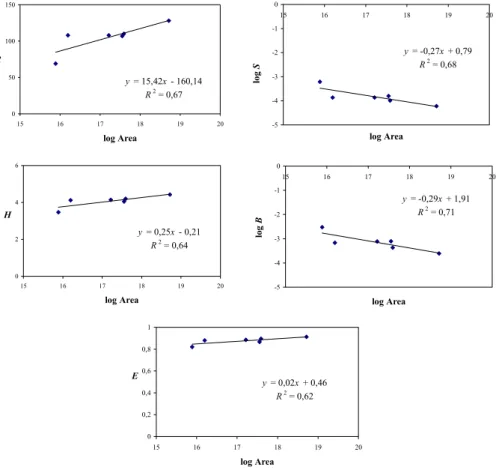
Figure 6 shows that the major diversity indices, i.e. rich-ness, entropy and evenrich-ness, increase with area. Ib´a˜nez et al. (1998) have reported similar results using more conven-tional diversity tools and major soil groups of the FAO (26 pedotaxa). Thus, the same conclusions may be drawn from
y = 15,42x - 160,14 R2 = 0,67 0 50 100 150 15 16 17 18 19 20 log Area R y = 0,25x - 0,21 R2 = 0,64 0 2 4 6 15 16 17 18 19 20 log Area H y = 0,02x + 0,46 R2 = 0,62 0 0,2 0,4 0,6 0,8 1 15 16 17 18 19 20 log Area E y = -0,27x + 0,79 R2 = 0,68 -5 -4 -3 -2 -1 0 15 16 17 18 19 20 log Area log S y = -0,29x + 1,91 R2 = 0,71 -5 -4 -3 -2 -1 0 15 16 17 18 19 20 log Area log B
Fig. 6. Correlations diversity indices-area (km2) for the continents and the whole world. Richness (R), Entropy (H ), Simpson index (S),
Berger-Parker index (B) and Evenness (E).
different taxonomic categories of the same classification. On the other hand the Simpson and Berger-Parker indices de-crease with area as it should be expected. Both indices rein-force the weight of dominance.
Even if we admit that it is not a simple task to determine the impact of soil forming factors on pedodiversity, some ob-servations can be made. On the one hand, all continents have similar levels of pedodiversity and extent, except for the case of Oceania. On the other hand, as far as we know, there are no global maps of soil forming factors. One possible ap-proximation would be (i) to consider maps of the biomes that provide information about vegetation and climate, and (ii) to use maps of tectonic plates including the differentiation of plate segments proposed by Paton et al. (1991) because they convey information about the richness or diversity of the substrates and/or the geo-environmental units. Figure 7 de-picts the positive correlation with areal extend of the biomes (FAO, 1993) and plate tectonic segments (Condie, 1989) for each continent and the whole World. The limited amount of available data and the fact that the continents have a similar area allow us to consider these findings only as a rough ap-proximation. Nevertheless, they suggest that the increase of diversity of the soil forming factors concurs with the increase
of pedodiversity. They also indicate the need in mapping soil forming factors suitable to for comparisons with areal soil distributions. As far as we know, at present such maps do not exist. In particular, no litological map has been found to work on scales comparable with soil map scales; there is not even an accepted standard classification of litological units. Similarly, all the classifications of the biomes are based on a small number of categories.
Two main hypotheses are used in theoretical ecology to understand pedodiversity-area relationships. These are the theory of island biogeography (MacArthur and Wilson, 1967) and the habitat heterogeneity hypothesis (Williamson, 1981). While the theory of island biogeography explains these relationships by biological factors (migrations, extinc-tions, latitude, etc.), the habitat heterogeneity hypothesis claims that larger areas embrace larger land surface hetero-geneity and habitats than the small ones and thus, areal ex-tent should be the main driving force of biodiversity patterns. Soil assemblages are non-biological natural bodies, which display structures similar to biocenoses. Our results seem to emphasize the role of the areal extent in the spatial pat-terns of diversity of both biotic and abiotic natural resources. It is also interesting to point out that in this study, R´enyi
554 F. J. Caniego et al.: R´enyi dimensions and pedodiversity of earth pedotaxa y = 1,42x - 14,99 R2 = 0,83 5 7 9 11 13 15 15 16 17 18 19 20 log Area P lat e t ec ton ic s egm en ts y = 0,77x - 6,34 R2 = 0,67 1 3 5 7 9 15 16 17 18 19 20 log Area Bi o m es
Fig. 7. Correlations of the number of plate tectonic segments and the number of biomes vs. area of the continents and the whole world.
dimensions are close to the maximum possible ones. Luri´e and Wagensberg (1983) and Luri´e et al. (1983) have reported similar trends for biodiversity in the framework on the non-linear systems. These findings suggest that diversity patterns of both, biological and pedological natural resources, should be explained as the outcome of complex non-linear dynamics with independence of their biotic or non biotic nature, as it has been proposed by the authors in previous works (Ib´a˜nez et al., 2005a, b).
The analysis of pedodiversity has taxonomic implications. Soil taxonomies are considered artificial constructs while bi-ological classifications are thought of as natural ones. Anal-ysis of the global pedodiversity shows that the fragmentation of the soil continuum into categories or taxa produces values of both, the classical – evenness – or its multifractal counter-part – D1/D0– that are close to the maximum possible one.
According to Mayr’s criteria (Mayr, 1969) this fact means that the FAO classification is an efficient soil information system. A similar conclusion may be drawn for biological classifications. This fact emphasizes the parallelism of both taxonomies suggested by Ib´a˜nez and Ruiz-Ramos (2006) and Ib´a˜nez et al. (2006) in their investigation of the mathematical similitude of these taxonomies.
5 Conclusions
We investigated how multifractal analysis provides diversity indices, and how they should be interpreted as pedodiversity indices. We demonstrated the empirical relationship between common, or classical, diversity indices and R´enyi dimen-sions. The classical indices were introduced on empirical grounds, mostly independently from one another. In contrast, multifractal analysis offered a coherent perspective with a single mathematical procedure. Finally, pedodiversity was examined through multifractals dimensions.
We showed that the R´enyi generalized dimensions D0, D1, D2and D4, and the ratio D1/D0are strongly correlated with
the classical and widely used diversity indices, i.e. the rich-ness, the entropy, Simpson and Berger-Parker indices, and the evenness, respectively. These indices cover the three clas-sical approaches to diversity analysis. The Shannon entropy characterizes the taxa richness, Simpson and Berger-Parker indices describe the shift to the dominance, and the evenness stresses the equitability among taxa in a given assemblage. Therefore, the multifractal approach offers a broad perspec-tive of the diversity in a new unifying way. In addition, mul-tifractal spectra offer additional information about the scale invariant structure in the diversity patterns.
The multifractal scaling is related to the corresponding scaling properties of the generalized dimensions. In this way, a range of scales was selected where a scaling and a multi-fractal behavior was observed. In our case, the lower bound-ary of this range of scales was dictated by the nature and precision of the dataset; the upper boundary was established using the coefficient of determination of the capacity dimen-sion D0and the shape of the R´enyi spectrum. In this context,
more detailed investigations should be carried out in order to better understand the meaning and implications of the up-per cut-off of the range of scales with multifractal scaling in connection with the homogeneity hypothesis.
The analysis of the available data seems to indicate that the increase of diversity of soil forming factors leads to an increase in pedodiversity. This finding should be considered as a first rough approximation mainly due to the limitations of the global scale dataset on hand at present.
Acknowledgements. We kindly appreciate the help of F.
Nachter-gaele (Land and Development Division, FAO, UN, Rome, Italy) who has provided us with the FAO Soil Database. J. Caniego and F. San Jos´e are partially supported by the Plan Nacional de Investigaci´on Cient´ıfica, Desarrollo e Investigaci´on Tecnol´ogica (I+D+I) under ref. AGL2004-04079 AGR. (Spain) and, DGUI (Comunidad de Madrid) and UPM (project ref.:R05/10784). Edited by: A. Tarquis
Reviewed by: three anonymous referees
References
Beck, C. and Schl¨ogl, F.: Thermodynamics of chaotic systems. An Introduction, Cambridge University Press, New York, 1995. Borda-de-Agua, L., Hubbell, S. P., and McAllister, M.:
Species-Area Curves, Diversity Indices, and Species Abundances Distri-butions: A Multifractal Analysis, The American Naturalist, 159, 138–155, 2002.
Caniego, F. J., Mart´ın, M. A., and San Jose, F.: R´enyi dimensions of soil pore size distribution, Geoderma, 112, 205–216, 2003. Caniego, F. J., Espejo, R., Mart´ın, M. A., and San Jos´e, F.:
Multi-fractal scaling of soil spatial variability, Ecol. Mod., 182, 291– 303, 2005.
Caniego, F. J., Ib´a˜nez, J. J., and San Jos´e, F.: Selfsimilarity of pedo-taxa distributions at the planetary scale: a multifractal approach, Geoderma, 134, 306–317, 2006.
Condie, K. C.: Plate Tectonics and Crustal Evolution, 3rd edition, Pergamon Press, UK, 1989.
Everstz, C. J. G. and Mandelbrot, B. B.: Multifractal measures, in: Chaos and Fractals, edited by: Peitgen, H., J¨urgens, H., and Saupe, D., Springer, Berlin, 921–953, 1992.
FAO: FAO-UNESCO Soil Map of the World, Vol. I. Legend. UN-ESCO, Paris, 1974.
FAO: World Soil Resources. An Explanatory Note on the FAO World Soil Resources Map at 1:25,000,000 scale, FAO World Soil Resources Reports 66, Rev. I, Rome, 64 pp., 1993. FAO: World reference base for soil resources, 84 World Soil
Re-sources Reports. FAO-UN, Rome (http://www.fao.org/docrep/ W8594E/W8594E00.HTM), 1998.
Gaite, J., Dom´ınguez, A., and P´erez-Mercader, J.: The fractal dis-tribution of galaxies and the transition to homogeneity, The As-trophysical Journal, 522, L5–L8, 1999.
Grassberger, P.: Generalized dimensions of strange attractors, Phys. Lett., 97A, 227–230, 1983.
Guo, Y., Gong, P., and Amundson, R.: Pedodiversity in the United States of America, Geoderma, 117, 99–115, 2003.
Hastings, H. M. and Sugihara, G.: Fractals. A user’s guide for nat-ural science, Oxford University Press, Oxford, 1993.
Ib´a˜nez, J. J., Jim´enez-Ballesta, R., and Garc´ıa- ´Alvarez, A.: Soil Landscapes and drainage basins in Mediterranean mountain ar-eas, Catena, 17, 573–583, 1990.
Ib´a˜nez, J. J., De-Alba, S., Berm´udez, F. F., and Garc´ıa- ´Alvarez, A.: Pedodiversity concepts and tools, Catena, 24, 215–232, 1995. Ib´a˜nez, J. J., De-Alba, S., Lobo, A., and Zucarello, V.:
Pedodiver-sity and global soil patterns at coarser scales (with Discussion), Geoderma, 83, 199–201, 1998.
Ib´a˜nez, J. J. and De Alba, S.: Pedodiversity and scaling laws: shar-ing Mart´ın and Rey’s opinion on the role of the Shannon index as a measure of diversity, Geoderma, 98, 5–9 (Discussion Paper), 2000.
Ib´a˜nez, J. J., Caniego, J., San Jos´e, F., and Carrera, C.: Pedodiversity-area relationships for islands, Ecol. Mod., 182, 257–269, 2005a.
Ib´a˜nez, J. J., Caniego, J., and Garc´ıa- ´Alvarez, A.: Nested subset analysis and taxa-range size distributions of pedological assem-blages: implications for biodiversity studies, Ecol. Mod., 182, 239–256, 2005b.
Ib´a˜nez, J. J. and Ruiz-Ramos, M.: Biological and pedological clas-sifications: a mathematical comparison, Eurasian Soil Sci., 39, 712–719, 2006.
Ib´a˜nez, J. J., Ruiz-Ramos, M., and Tarquis, A. M.: Mathematical structures of biological and pedological taxonomies, Geoderma, 134, 360–372, 2006.
Jenny, H.: Factors of soil formation: a system of quantitative pedol-ogy, McGraw-Hill, New York, 1941.
Luri´e, D. and Wagensberg, J.: On biomass diversity in ecology, B. Math. Biol., 4, 287–293, 1983.
Luri´e, D., Valls, J., and Wagensberg, J.: Thermodynamic approach to biomass diversity, B. Math. Biol., 45, 869–872, 1983. MacArthur, R. H. and Wilson, E. O.: The Theory of Island
Bio-geography, Princeton Univ. Press, Princeton, 1967.
Magurran, A. E.: Ecological diversity and its measurement, Croom Helm, London, 1988.
Mandelbrot, B.: The Fractal Geometry of Nature, W. H. Freeman and Company, New York, 1983.
Margalef, D. R.: Information theory in ecology, General Systems, 3, 36–71, 1958.
May, R. M.: Patterns of species abundance and diversity, in: Ecol-ogy and evolution of communities, edited by: Cody, M. L. and Diamond, J. M., Harvard Univ. Press, Cambridge, MA., 81–120, 1975.
Mayr, E.: Principles of Systematic Zoology, McGraw-Hill, New York, 1969.
McBratney, A. B., Odeh, I. O. A., Bishop, T. F. A., Dunbar, M. S., and Shatar, T. M.: An overview of pedometric techniques for use in soil survey, Geoderma, 97, 293–327, 2000.
Paton, T. R., Humphreys, G. S. and Mitchell, P. B.: Soils: A New Global View, UCL Press, London, 1985.
Phillips, J. D.: Earth surface systems: complexity, order and scale. Blackwell, Massachusetts, 1999.
Phillips, J. D.: Divergent evolution and the spatial structure of soil landscape variability, Catena, 43, 101–113, 2001.
Pielou, E. C.: Ecological Diversity, John Wiley and Sons, New York, 1975.
Preston, F. W.: The Canonical Distribution of Commonness and Rarity. Part I. Ecology, 43, 185–215, 1962a.
Preston, F. W.: The Canonical Distribution of Commonness and Rarity. Part II. Ecology, 43, 410–432, 1962b.
R´enyi, A.: On measures of entropy and information. Proc. 4th Berkely Symposium on Math. Stat. and Prob. 1960, 1, 547–561, 1961.
Scheuring, I. and Riedi, R.: Applications of multifractals to the analysis of vegetation pattern, J. Veg. Sci., 5, 489–496, 1994. Williamson, M. H.: Island Populations, Oxford Univ. Press,