Causality and Sensitivity Analysis in Distributed Design
Simulation
by Jaehyun Kim
Bachelor of Science, Naval Architecture and Ocean Engineering, Seoul National University, Seoul, Aug 1994
Master of Science, Mechanical Engineering Massachusetts Institute of Technology, June 1998
Submitted to the Department of Mechanical Engineering in Partial Fulfillment of the Requirements for the Degree of
Doctor of Philosophy in Mechanical Engineering at the
MASSACHUSETTS INSTITUTE OF TECHNOLOGY February, 2002
BARKER
MASSACHUSETTS INSTITUTE OF TECHNOLOGYARS
9 2002
L LIBRAR IES-
..
@ Massachusetts Institute of Technology, 2001All Rights Reserved
Signature of Author
Certified by
Accepted by
Department of Mechanical Engip ring
a , f~)n Octoberl5h001
Professor David R. Wallace '---- esis Supervisor
- Frotessor Am
A
SonnThanks God,
You sent me to the place where I do not deserve to be And gave me a chance to enjoy this long journey
Above all,
Thanks for giving me a family (my father, mother, brother in law and sister) To whom I can dedicate this dissertation
Causality and Sensitivity Analysis in Distributed Design
Simulation
byJaehyun Kim
Submitted to the Department of Mechanical Engineering on October, 2001 in Partial Fulfillment of the Requirements for the
Requirements for the Degree of Doctoral of Philosophy in Mechanical Engineering
Abstract
Numerous collaborative design frameworks have been developed to accelerate the product development, and recently environments for building distributed simulations have been proposed. For example, a simulation framework called DOME (Distributed Object-oriented Modeling and Evaluation) has been developed in MIT CADlab.
DOME is unique in its decentralized structure that allows heterogeneous simulations to be stitched together while allowing proprietary information an simulation models to remain secure with each participant. While
such an approach offers many advantages, it also hides causality and sensitivity information, making it difficult for designers to understand problem structure and verify solutions.The purpose of this research is to analyze the relationships between design parameters (causality) and the strength of the relationships
(sensitivity) in decentralized web-based design simulation. Algorithms and implementations for the causality and sensitivity analysis are introduced.
Causality is determined using Granger's definition of causality, which is to distinguish causation from association using conditional variance of the suspected output variable. Sensitivity is estimated by linear regression analysis and a perturbation method, which transfers the problem into a frequency domain by generating periodic perturbations. Varying Internet latency and disturbances are issues with these methods. Thus, algorithms are developed and tested to overcome these problems
Thesis Supervisor: David R. Wallace Title Professor of Mechanical Engineering
Acknowledgments
I still remember the day when Prof David gave me his offer, which was June 2 4h 1998. That was one of the
happiest days of my life. I really appreciate his great guidance and generous funding. Working with him is a great privilege not only because of his ingenuity and creativity, but also his enormous capacity of joy and great sense of humor.
I am deeply grateful about the fact that I could have Prof. Seth Lloyd and Prof. Kamal Youcef-toumi as my committee members. They have given me an invaluable guideline for this thesis.
One of my greatest thanks goes to Prof. Sanjay Sarma. I learned a lot from him though the period of working with him.
I really appreciate Kathy Wang at CIPD for her help and encouragement for the final part of this job. People at MIT CADlab have been excellent colleagues for me. Thanks for their support and friendship. Especially I want to give my special gratitude to Elaine Yang.
Last five years could have been more difficult without the friends here. I could enjoy my days at MIT thanks to Pyeongwon, Byeonghyuk, Sangbeom, Cheolmin, Joonil, Junho, Jeesung, Heejae, Yoonkyu, Kyujin, Jongyoon Jincheol, Sunwoong, Jungwook, Sangjun, Taesik, Yongsuk. Hyunkyu, Jinwoo, Sunjoon, Jinwook, Joon, Hyuksang, Jinpyeong, Seungkil, Hyungsoo, Jitae, Kihyun and Kiseog.
I also appreciate my friends back there in Seoul for their friendship and encouragements. Thanks Jinwon, Sangseo, Woochang, Seokwon, Sangkyun, Pilsang, Taejoon, Bumwoo, HyungKwan, Jaeyeol, Chanki, Yoojong, Jinwook, Yongjoon, Gene-Oh, Dohoon, Yangso, ByeonKyu, Keunwook, Dongbeom, Donggun, Sungsoo, Dongsik, Keunbae, Wonseok, Kwansoo, Heungjoo and Jaesung. Especially, I want to share this honor with my best friend Jaeha.
I am deeply grateful to Prof. Key-Pyo Rhee, Kwang June Bai, JongGae Shin, Hang S Choi, Hyochul Kim and JongNam Joo at Seoul National University.
YeDarm family, especially pastor Hosik Kim and ChangJoo Kim, deserves more than just thanks from me for their prayer.
Most precious thanks of mine goes to my family (Mom, Dad, Brother in law and Sister). They have given me love and faith I do not deserve. Maehyung, thanks for having been such a great mentor to me. I think I am privileged with your thoughtful advice. Noona, without your warm care and deep understanding on me, I couldn't come to this point. Mom, thanks for always putting some faith on me (even though the history does not allow you to do that). I can stand against all the hardships due to your belief in me. Dad, your sincere prayer and moving letters have given me the courage to finish this journey. I believe God granted the wish you made in your New Rochelle days.
Table of Contents
I
IN TRO D U CTIO N ... 171.1 M otivation...17
1.1.1 Regression analysis... 18
1.1.2 Perturbation M ethod... 19
1.2 Goal of the research ... 19
1.2.1 Importance of the importance of causal information in conceptual design stage ... 20
1.2.2 Properties of the decentralized distributed design environment ... 20
1.2.3 Study on regression analysis and perturbation m ethod ... 21
1.2.4 Characterization of Internet latency depending on packet size and protocols...21
1.2.5 Im plem entation of algorithm s... 21
1.3 Problem statem ent...21
1.3.1 Unknown varying Internet latency... 21
1.3.2 N onlinearity...22 1.3.3 Effect differentiation... 22 1.4 Organization of thesis ... 22 2 BA CK G RO U N D ... 24 2.1 Product D esign...24 2.1.1 French's M odel...25
2.1.2 Pahl and Beitz M odel... 25
2.2 Constraint M anagem ent ... 26
2.2.1 Constraint representation... 28
2.2.2 Constraint generation... 29
2.2.3 Goal of constraint m anagem ent ... 29
2.2.4 D etection of com pleteness and consistency ... 30
2.3.1 Communication and collaboration in product design problem ... 31
2.3.2 Object-oriented Modeling and Evaluation (OME) framework... 32
2.4 Causality...33
2.4.1 Causality in local scope... 33
2.4.2 Causality in D O M E fram ework... 36
2.5 Sensitivity...36
2.5.1 Exam ple-M otor D esign... 36
2.5.2 Sensitivity in a local scope... 37
2.5.3 Sensitivity in the D OM E fram ework ... 38
2.6 Circular D ependency...39
3 RELA TED W O RK ... 40
3.1 Constraint M anagem ent... 40
3.2 D esign Com plier ... 41
3.3 Previous work on causality in CADlab... 42
3.4 Causality and Sensitivity in Econom etrics... 42
3.4.1 D etection of causality ... 43
3.4.2 Circular dependency ... 43
3.4.3 M easuring sensitivity ... 44
3.4.4 Bias...44
3.4.5 Latent V ariable M odel... 45
3.5 Artificial neural network (ANN ) approach... 45
4 INTERNET LATENCY, PROTOCOLS AND NODE STRUCTURE... 47
4.1 Latency Problem with Regression Analysis and Perturbation Method ... 47
4.2 Packet Sw itched N etwork... 48
4.2.1 M ultiplexing: STD M , FD M and SM ... 48
4.2.2 Packet...49
4.3.1 Bandwidth...50
4.3.2 Latency...50
4.4 The Internet Layers an Protocols... 51
4.4.1 Application layer...52 4.4.2 Presentation layer... 52 4.4.3 Session layer ... 52 4.4.4 Transport layer...52 4.4.5 Network layer...53 4.4.6 Link layer ... 53 4.4.7 Physical layer ... 53
4.5 TCP (Transm ission Control Protocol)... 53
4.5.1 Acknowledgem ent and retransm ission ... 53
4.5.2 Flow control...53
4.5.3 Congestion control... 54
4.6 UDP (U ser Datagram Protocol)...54
4.6.1 End to end delay of packet using UDP... 54
5 CAUSALITY AND SENSITIVITY ANALYSIS USING REGRESSION METHOD...55
5.1 Regression Analysis...55
5.1.1 Linear regression analysis... 55
5.1.2 Linear population regression... 55
5.1.3 Linear sam ple regression... 56
5.1.4 Linear in variable and linear in param eter ... 57
5.1.5 Types of data...57
5.2 Estim ation ... 58
5.2.1 Determ ining SRF ... ... ... ... 58
5.2.2 Significance of regression coefficients... 59
5.2.4 Tim e lagged m odel... 59
5.3 Causality... 60
5.3.1 Regression V S. Correlation and Causation ... 60
5.3.2 Granger causality ... 61 5.4 Sensitivity...67 5.4.1 M atching ... 67 5.5 Periodic Inputs ... 68 5.5.1 M atching by interval... 69 5.5.2 M atching by value-cross-correlation ... 69
5.5.3 Sample selection: statistic significance of sliding window method... 69
5.5.4 Conditions for period selection... 70
5.6 Im plem entation...71
5.6.1 A lgorithm ... 71
5.7 Experim ental Results ... 72
5.7.1 Experim ent-1: Linear and independent sensitivity ... 73
5.7.2 Experim ent-2: Second Order independent case ... 75
5.7.3 Experim ent-3: Exponential independent case... 76
5.7.4 Experim ent-4: N onlinear dependent case... 78
5.8 Result Analysis...79
5.8.1 Robustness to non-linearity... 79
5.8.2 Robustness to interruption... 80
5.8.3 Robustness to arrival tim e variance... 81
5.8.4 Independent and D ependent Sensitivity ... 82
5.8.5 Sum m ary ... 82
6 CAUSALITY AND SENSITIVITY ANALYSIS USING PERTURBATION METHOD...84
6.1 Frequency D om ain...84
6.1.2 Fourier Series...85
6.1.3 DFT (discrete Fourier transform )... 86
6.2 Causality and Sensitivity... 86
6.2.1 Causality...87 6.2.2 Sensitivity...88 6.3 Im plem entation...88 6.3.1 Algorithm ... 88 6.3.2 Frequency coincidence... 89 6.3.3 Interpolation...89 6.4 Results...90
6.4.1 Experim ent-1: linear and independent sensitivity... 90
6.4.2 Experim ent-2: second order and independent sensitivity... 93
6.4.3 Experim ent-3: exponential and independent sensitivity... 95
6.4.4 Experim ent-4: nonlinear and dependent sensitivity... 97
6.5 Results Analysis ... 100
6.5.1 Robustness to non-linearity...100
6.5.2 Robustness to interruption...100
6.5.3 Robustness to latency variation ... 101
6.5.4 Independent and dependent sensitivity...102
6.6 Com parison with Regression Analysis ... 102
6.7 Sum m ary ... 104
7 CON CLU SION ... 105
7.1 Sum m ary ... 105
7.2 Future W ork ... 107
7.2.1 Constraint m anagem ent ... 107
7.2.2 M ulti-path causality ... 107
7.2.4 Avoid coincident frequency...108 7.2.5 Interm ediate nodes with long execution tim es ... 108
List of Figures
Figure 1-1 Design Simulation in a Distributed Design Framework... 18
Figure 2-1 Pahl and Beitz's model of design process... 27
Figure 2-2. Graph Representation of structure constraints... 29
Figure 2-3 Design Problem Model... 32
Figure 2-4 Graph Representation of Local Causality (Serrano and Gossard 1992)... 34
Figure 2-5 Design goal and parameters ... 35
Figure 2-6 Causality (Dependency) shown by topologically sorted DAG (Serrano and Gossard 1992) ... 35
Figure 2-7 Torque and Angular Velocity... 37
Figure 3-1 Design Compiler (Boettner and Ward 1992)... 41
Figure 3-2 Visualization of the Causal Information (Alny 1998) ... 42
Figure 3-3 Causation and Correlation... 43
Figure 4-1 M ultiplexing ... 48
Figure 4-2 Latency statistics (http://ipnetwork.bgtmo.ip.att.net/currentnetworkperformance.shtml)...51
Figure 4-3 OSI Definition of Internet Layers ... 52
Figure 5-1 R egression A nalysis ... 56
Figure 5-2 Influence of Sample size to Power and Alpha [J.R. Bult, et al., 1997]... 66
F igure 5-3 B lack B o x ... 67
F igure 5-4 M atching ... 68
Figure 5-5 Cases covered by Experiments...Error! Bookmark not defined. Figure 5-6 Degradation by interruption and latency variation... 81
Figure 6-1 Causality and Sensitivity by the Perturbation Method... 87
Figure 6-2 Zero Order Interpolation... 90
Figure 6-3 First Order Interpolation... 90
Figure 6-4 Process to Generate Spectrum... 92
Figure 6-6 Process to Generate Spectrum ... 97 Figure 6-7 Process to Generate Spectrum ... 99
1
Introduction
1.1 Motivation
As a result of rapid progress in communication technology, numerous Internet-based design frameworks have been developed to accelerate the product development and improve product quality. However many of these applications focus on a specific design stage or domain rather than the integration of simulations from a wide variety of design perspectives.
A design framework DOME (Distributed Object-oriented Modeling and Evaluation) has been developed by MIT CADlab to streamline designer-mediated integration of unstructured design simulations as illustrated by Figure 1-1. DOME is unique in its decentralized peer-to-peer simulation architectures, which allows heterogeneity of design simulations and protects proprietary information of participants. However, this decentralized approach also results in hidden simulation causality and sensitivity. Causality and sensitivity information is needed to support decision-making, to provide designers with a sense of the system structure and to ensure robust and efficient computation.
The purpose of this thesis is to analyze efficiently (in terms of time and memory) the relationships between design parameters (causality) and the strength of their relationships (sensitivity) when a model or simulation structure is not visible directly.
In this work, algorithms and implementations for the causality and sensitivity analysis are introduced. Token (message) passing, Bayesian network approach, regression analysis and perturbation method are considered
and applied to analyze hidden causality, emphasizing time efficiency and precision. Sensitivity analysis is performed using the inferred causal structure. First, linear regression methods were tried, and issues in matching input changes with outputs are discovered due to the varying latency of the Internet. To overcome this problem, linear interpolation and cross-correlation were used to find a precise match. Second, a perturbation method combined with theories from signal processing is developed. The method takes advantage of the relatively large time-scale of change in Internet traffic to overcome varying latency and latent structure problems.
Original Equipment
Manufacturer
Design Option
Figure 1-1 Design Simulation in a Distributed Design Framework
1.1.1 Regression analysis
Regression analysis is a methodology to determine the dependency of a variable (dependent variable) on another variable (explanatory variable) using distributions of the variables. Sensitivity can be directly
determined by regression analysis, but a statistical measure' is needed to supplement the regression analysis to figure out causality.
In estimating regression coefficients, distribution of an explanatory variable, conditional upon a dependent variable, is needed to be known. Simulation modules in the DOME are MIMO (multiple input multiple output) systems. Thus, output values corresponding to the changes of an input must be selected to estimate the conditional distribution.2. However, there is an unknown delay between changes of an input and an
output, because the DOME is using the Internet as a communication channel. As a result, the matching needs to be determined statistically.
In this thesis, using a periodic (frequency) perturbation is suggested as a solution for the matching problem. An interval of time between changes of an input and an output is estimated using the frequency information, and a series of corresponding output values are selected by its deviation from an expected interval3. In employing the periodic perturbation, maintaining the frequency is a primary issue, which is affected by the Internet latency. Thus, characteristics of the Internet latency depending on a time scale and protocols are studied in chapter 4.
1.1.2 Perturbation Method
Perturbation method is using periodic perturbation to transfer the problem from a time domain to a frequency domain. An input value is periodically perturbed and a response of an output is represented in the frequency domain. Sensitivity and causality is detected using an amplitude and existence of a frequency component respectively.
Maintaining an original perturbation frequency, during propagation through a design network is a primary issue. Thus, characteristics (especially a time-scale) of the Internet latency are studied to minimize the latency variation. Also, statistical methods are adopted to refine the results.
1.2 Goal of the research
The goal of this research is to develop and implement new algorithms for causality and sensitivity analysis in a distributed design simulation environment. Decentralized distributed design frameworks with a flat hierarchy have many advantages, such as scalability, heterogeneity between design objects and hiding proprietary information. However, it also has the problem of hidden causal information, which makes decision-making and system diagnostics difficult. The focus of the work is to overcome the hidden causal information problem with minimum computation time and a reasonable degree of precision. Internet latency
1 Granger causality
2 The selection of output values corresponding to an input will be referred as a matching problem.
characteristics will be addressed as a corner stone for resolving the unknown varying latency, which complicates cause-effect matching problems in regression analysis, and a non-uniform interval problem when using perturbation methods. Approximation algorithms will be presented to match regression analysis inputs to their corresponding outputs. To differentiate the effects when using perturbation methods, the problem is transferred to the frequency domain by generating periodic perturbation. Effects can thus be distinguished by the frequency of the perturbation. Algorithms to resolve the problem of non-uniform interval due to the varying latency are elaborated.
1.2.1 Importance of the importance of causal information in conceptual design stage
In the conceptual design stage, the knowledge on causality and sensitivity is essential for the designers to efficiently manage constraints and to achieve designs that are robust to the manufacturing tolerances or noise from aging or the working environment.
Constraint management
Design processes are constraint oriented, meaning that the goal is to satisfy relationships between various design parameters and performance goals. Constraints come from physical laws, performance, geometric and topological requirements or aesthetic considerations, etc. Constraint management includes maintaining consistency (no conflict or redundancy) and completeness (no unconstrained degrees of freedom) of the constraint set, achieving efficient constraint evaluation by selecting the relevant subset of constraints to be managed, and supporting decision-making through qualitative analysis (Serrano and Gossard 1992).
Robust design
The distribution of values associated with a given design parameters arises from manufacturing variations, product aging or noises from the environment. Such distributions can be reduced either by tightening manufacturing processes or by changing the design so that the parameters become less sensitive to the noise. Generally the former is expensive or sometimes even impossible to achieve. The latter is called robust design or Taguchi's method. The goal of Taguchi's method is to achieve the easy to manufacture design and best performance in operation (David 1992).
1.2.2 Properties of the decentralized distributed design environment
A decentralized distributed design environment is advantageous in its ability to accommodate heterogeneity (interoperability and accessibility), complexity (scalability and flexibility) and proprietary knowledge. However, it has the disadvantage of hiding causal information, which is needed for efficient constraint management and robust design.
1.2.3 Study on regression analysis and perturbation method
Regression analysis is a methodology to infer the dependency of one variable, the dependent variable on other variables, explanatory variables. The main purpose of the analysis is to estimate and predict the distribution of the dependent variable when that of explanatory variables is given. However, regression by itself cannot verify the causality, it can only show the strength of dependency. Statistical measures, such as Granger causality, are required to prove causality (Pearl 1988). In the context of distributed design framework, some conditions needed for the validity of the regression analysis, such as normality and independence between noise sources, are not satisfied and results in bias.
Thus, another approach, called the perturbation method, is proposed. The main issue in this approach is that the effects from multiple inputs cannot be differentiated simply from the perturbation values. To resolve this limitation, the problem is transferred into frequency domain by using a periodic perturbation. However, non-uniform delay of data delivery through Internet can still be an issue. Characteristics of Internet latency are studied and approximation algorithms are developed to resolve this problem.
1.2.4 Characterization of Internet latency depending on packet size and protocols
The RTT (round trip time) delay of packets delivery in the Internet will be characterized on the time scale of several milliseconds to minutes. RTT depends on packet size, involved protocols and traffic situation of the Internet (Bolot 1993). Properties of TCP (transmission control protocol) and UDP (user datagram protocol) will be explained and the effect of those properties on the RTT will be shown. Both protocols have pros and cons. The relatively long time scale of traffic situation variation of Internet relative to UDP communication will be used to overcome unknown and varying latency.
1.2.5 Implementation of algorithms
Based on the knowledge and techniques proposed in the thesis, an appropriate architecture for a computer-assisted design system, building upon the DOME framework is proposed and is implemented to explore the merits of the new algorithms. The framework and its implementation are also validated with an engineering design problem.
1.3 Problem statement
In this work, algorithms for causality sensitivity analysis are developed. Issues such as unknown varying Internet latency, nonlinearity and effect differentiation are considered and resolved.
1.3.1 Unknown varying Internet latency
Internet latency depends on protocols, the size of the packet, and network traffic. The unknown and varying latency of packet delivery through Internet causes difficulty in both regression analysis and perturbation
methods. Several approximate algorithms and their implementation, based on statistical methods, will be presented.
1.3.2 Nonlinearity
In this work only quantitative constraints between design parameters are considered, which can be either linear or nonlinear. This thesis emphasizes regression analysis and perturbation methods, both of which have problems in approximating sensitivity for nonlinear cases. Algorithms to improve the robustness to nonlinearity are presented and the evaluated. Also the possibility of applying Bayesian network is introduced.
1.3.3 Effect differentiation
Each design object (relationship) is MIMO (multiple inputs and multiple outputs) system. As a result, the behavior of the output is likely to be a combination of the effects from multiple inputs. Especially when the connections between inputs and outputs are hidden effect differentiation becomes more difficult. This work will present methods to differentiate effect from specific input from mixture of effects.
1.4 Organization of thesis
In chapter 2, the background for this research is presented. First, general product design procedures including constraint management are studied. Second, the characteristics of DOME are reviewed. The unique properties of DOME and the pros and cons resulting from these properties are discussed. Third, the role and definition of causal information is presented. The difficulty in determining causality and sensitivity under the presence of proprietary information is elaborated. The problem of circular dependency is also addressed.
Chapter 3 reviews previous and on-going causality and sensitivity analysis research. General aspects of constraint management are illustrated, emphasizing the properties that should be satisfied for a constraint set to be valid. Previous causality work in CADlab implemented by Tom Almy is discussed. He suggested the perturbation method, and also pointed out the problem with effect differentiation (Almy 1998). Approaches used in econometrics are introduced, including regression analysis and Granger causality.
In chapter 4, Internet latency (the time taken for the packet to be delivered) is studied. Unknown and varying latency for packet delivery causes difficulty in implementing both the regression analysis and perturbation method. To overcome problems caused by latency variance, a different transport layer protocol is used, and filtering algorithms for approximation are devised.
Chapter 5 provides implementation results for regression analysis. Issues, such as matching and bias, are discussed and the solutions for these problems are suggested. The regression analysis cannot prove causality because it is based on the assumption that there is a causal relationship between explanatory variable and
dependent variable. For this reason, Granger causality is introduced, which can statistically prove the causality between two variables. Experiments are performed and the results are presented, emphasizing robustness to nonlinearity, interruption from other inputs and latency variance.
In chapter 6, the perturbation method is explained and the implementation results are discussed. Periodic perturbation is used to differentiate the effects from multiple inputs by transferring the problem domain from time to frequency. The robustness of the method to nonlinearity, interruption from other inputs, and latency variation is compared with those of regression method.
2
Background
The vision of this research is to provide the causality and sensitivity information to the product designers in
a computer network-centric distributed design environment.
In this chapter the vision of this research is described from the context of the DOME environment.
Existing models of the product design process are illustrated to emphasize the importance of constraint management. Characteristics of DOME, a decentralized network-centric design framework, are discussed. Finally the contribution of causality and sensitivity information' to the design process itself and the product quality is elaborated.
2.1 Product Design
Product design is the process to achieve an acceptable realization (or implementation) from the set of functional (behavioral), performance and external appearance specifications for an artifact (Subrahmanyam 1992). Functional and performance requirements come from customer needs. The basic design activities are the exploration of customer needs, generation of new ideas, evaluation of the generated ideas, and communication between designers (Nigel 2000).
4 In the following chapters, the term causal information will be used to represent both causality and sensitivity information
Several designers such as French, Archer and Pahl and Beitz have developed their own models of design process (David 1992). Iteration between the generation of new designs and the evaluation of ideas is common factor in all of these models.
2.1.1 French's Model
According to the French's model, the design process consists of the following stages (Nigel 2000).
1. Problem analysis: The problem definition for designing the product is made. Also the limitations are placed on the product and the criteria for performance is established. The outputs of this stage are the goals, constraints and criteria.
2. Conceptual Design: In this stage, broad and abstract solutions are generated based on the problem definition and criteria that were generated in the previous stage. Conceptual design consists of the generation and evaluation of the concepts. Numerous concepts are generated as candidate solutions for the design problem (concept generation) and their feasibility are evaluated through the comparison with existing concepts for similar problems (concept evaluation). For the comparison, concepts must have the same level of abstraction. This is the most demanding stage of the design process because the most important decisions, such as functional decomposition, are made in this stage. The role of communication is highly important because many different kinds of domain knowledge relevant to the product development, such as, engineering science, practical knowledge, production method and also commercial aspects need to be integrated. This stage possesses the greatest potential for the product quality improvement. Also, the time to develop and the overall quality of the final embodiment design is very dependent upon the concepts. Effective design simulation environment can be valuable for this stage and following stages because the numerous trade-offs are made during the decision-makings process.
3. Embodiment of schemes: A concrete detailed design is the result of this stage. Choices are made if there are multiple candidates of schemes. Usually the outputs of this phase are a set of layout or assembly drawings.
4. Detailing: Large numbers of decisions for the individual details of every aspect of the design are made in this stage. Careful consideration must be given to prevent the errors and failure, because this is the final stage of the design process and the outcomes are given to manufacturers.
2.1.2 Pahl and Beitz Model
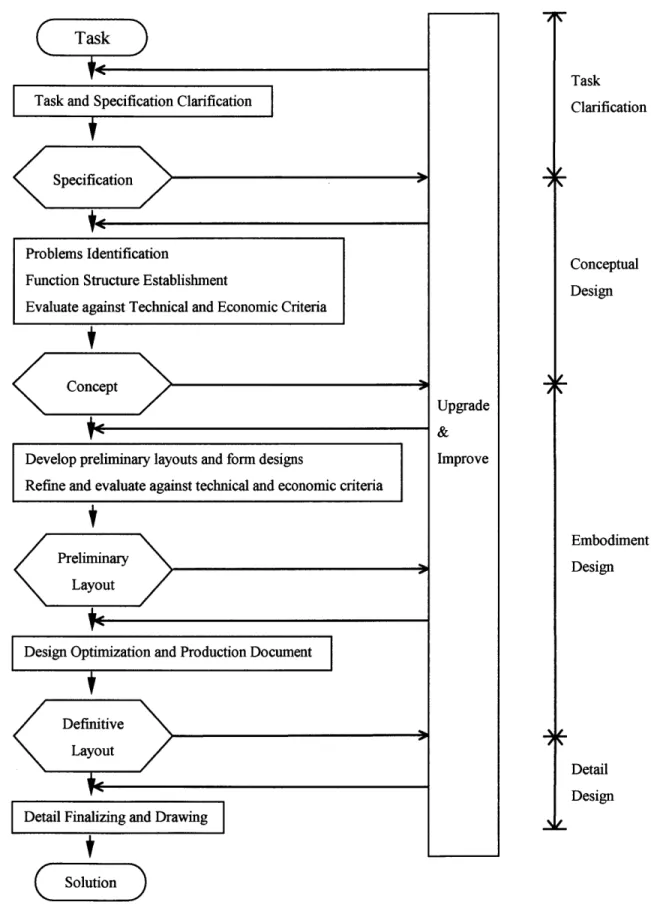
Pahl and Beitz's model of design process consists of four steps: task clarification, conceptual design, embodiment design and detail design (Nigel 2000).
1. Clarification of the task: Gathering the information about the requirement for the product. The product requirements are stated in terms of performance, cost and time. The collected information will be embodied by solution and design constraints.
2. Conceptual design: A function structure5 is established in this stage. Principles relevant to the
solution of the problem are sought and embedded in the concept variants.
3. Embodiment design: Layouts and forms for the product are determined based on the concepts generated in the previous stage. Technical and economical aspects of the design problem are considered.
4. Detail design: Attributes such as arrangement, form, dimension and surface properties of all individual parts are made. Material selection, drawing and production notes are the outputs of this stage.
2.2 Constraint Management
As is illustrated by the design process model by Pahl and Beitz, the initial step of product development is the identification of a task (functional requirement of the product), and the progression from task to product is punctuated by design decisions. Design decisions change the design state, which is a snapshot of the information about the product being designed. There are two different views on the progress of the design process. One view is that the design progresses by the comparison between design states and requirements for the product (David 1992). This view is based on the assumption that the requirements for the product are already known from the beginning stage, and that the difference between requirements and design states is recognizable. In this view, the difference between requirements and design states governs the process. However, the design problems are often ill-defined and the full requirements are hard to be provided at the onset. A second view is that the design progresses as requirements constrain solutions to a subset of all possible design solution candidates. As the design progresses, new constraints are added to further reduce the solution spaces until finally only one solution is left. "Design is the successive
development and application of constraints until unique solution is achieved." (David 1992).
5 The function of the product and mathematical function are similar in that both are generating output from
Task
Task
Task and Specification Clarification Clarification
Specification
Problems Identification Conceptual
Function Structure Establishment Design
Evaluate against Technical and Economic Criteria
Concept
Upgrade & Develop preliminary layouts and form designs Improve Refine and evaluate against technical and economic criteria
Embodiment Design LayoutD
Design Optimization and Production Document
< :Definitive
Layout
Detail Design Detail Finalizing and Drawing
Solution
The engineering design process- especially during conceptual design- is mostly focused on the recognition, formulation, and satisfaction of constraints. Constraints basically define the functional relations-, which need to be maintained between design parameters. Through the constraints, design parameters are related to desired performance, physical laws to be obeyed and geometric properties (Serrano and Gossard 1992). Also, constraints are used to represent domain knowledge relevant to the design problem (Baykan and Fox 1992).
The primary concern of this work is evaluation of constraints by tracking the causal chains. Causal information (causality and sensitivity between parameters) plays an important guiding role in the design decision-making process. When there are conflicts or under or over-constraint problems, causal information can be used to identify the specific aspects that need to be dealt with.
2.2.1 Constraint representation
The design task can be represented by constraints, with or without the objective function. Equation 2-1 is an example of constraints with an objective function.
Min f(x, y,.:)
x,y,z s.t. x2 +y 2 =25 x3 +y 3 +Z3 < 289 x,y,z> 0 Equation 2-1Constraints with an objective function can be solved using general programming (optimization) methods. Tasks represented by constraints without an objective function can be solved using the constraint satisfaction methods6.
Constraint structure (topology of the relation between variables) can be represented with a directed graph called constraint graph.
6
Dechter, R., "Enhancement Schemes for Constraint Processing: Back-jumping, Learning, and Cutset Decomposition," Artificial Intelligence, Vol. 41, pp. 273-312, January 1990
IN
6 P O Graph Representation Gear Designer ' I GearbA esigner Motor Designer Drill' esigher *ameter iate arameter Z3 Function StructureFigure 2-2. Graph Representation of structure constraints
As is illustrated in the Figure 2-2, the node pointed to by an arrow depends on the node on the other side of the arrow for its value. The direction of the arrow is reversed when the arrow indicates the dependency
instead of causality.
2.2.2 Constraint generation
Design constraints are generated from two sources. First, constraints are formed by the designer's knowledge of mechanical devices or the specific problem being considered. In this case, the uniqueness of the solution comes from the uniqueness of the designer's knowledge. Second, constraints are added during the design process as a result of making design decisions. When adding such constraints, designers should be well informed about the characteristics of their solution.
2.2.3 Goal of constraint management
Consistency
There should not be any conflict or redundancy between constraints. This property guarantees the existence of the solution. nput Par ntermed aramet tput P
34
x3=2.1x,
y
1=9.81x3
0 5 31.
- 1.732 ProductCompleteness
There should not be unconstrained degrees of freedom left in a complete design. Uniqueness of the solution comes from this property of constraints.
Efficient evaluation of constraint network
In checking a validity (completeness and consistency) of a constraint set, relevant subset of constraints needs to be selected to reduce a problem complexity.
Providing guideline for the decision-making
Through qualitative analysis, such as causality analysis, a constraint set need to be characterized to support the decision-making (Serrano and Gossard 1992).
2.2.4 Detection of completeness and consistency
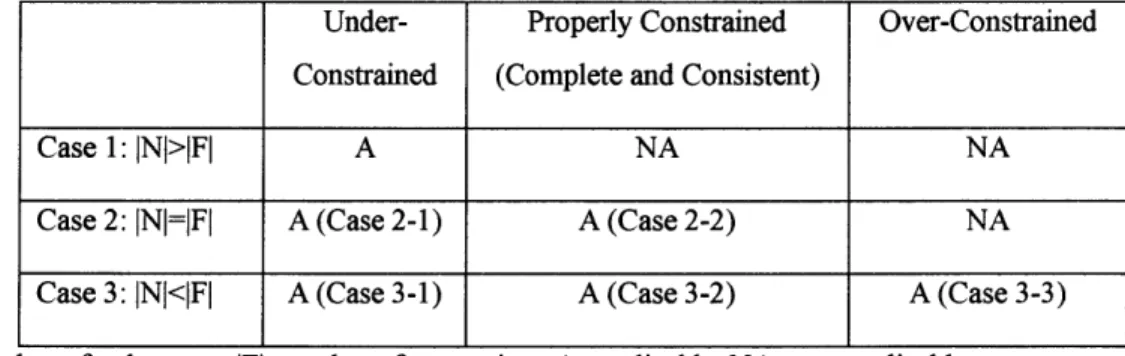
Table 2-1 Possible states7 of a constraint set depending on the number of constraints
Under- Properly Constrained Over-Constrained Constrained (Complete and Consistent)
Case 1: INI>IFI A NA NA
Case 2: INI=iFI A (Case 2-1) A (Case 2-2) NA
Case 3: INI<IFI A (Case 3-1) A (Case 3-2) A (Case 3-3) INI: number of unknowns, IFl: number of constraints, A: applicable, NA: non-applicable
As illustrated in Table 2-1, when the number of unknown variables is larger than that of constraints (Case 1), the constraint set is under-constrained. However, in Case 2 and Case 3, states of the constraint set cannot be distinguished by the numbers of the unknown variables and the constraints, because there can be redundant constraints. Case 2-1, 3-1 and 3-2 result from the redundant constraints. Redundant constraints are troublesome when they are in a strong component, because they cause singularity in Jacobean matrix. Case 2-1, 2-2, 1 and 2 can be distinguished by matching the unknown variables to the constraints. In Case 3-3, if unmatched constraints are consistent with the rest of successfully matched constraints, the unmatched constraints are redundant. Otherwise there is a confliction between the constraints, which requires a modification (Serrano and Gossard 1992).
2.3 DOME
2.3.1 Communication and collaboration in product design problem
The product design problem can be regarded as a set of decisions to be made, which could be either qualitative or quantitative. Examples of qualitative decisions are selecting the color or material of a product, and examples of quantitative decisions include determining the dimension or the cost of the product. Design decisions are made considering competing design objectives, which arise from the tasks or specifications that the product is expected to satisfy. As a result, decision-making has to deal with trade-offs in most cases, which necessitates efficient communication and collaboration between designers possessing different kinds of domain knowledge.
The DOME (Pahng, et al., 1998), which is an Internet based distributed design framework developed by MIT CADlab, provides a design environment enabling the real time collaboration between designers and simulations. DOME overcomes geographical barriers using the Internet as its communication channel8. As a result, wider variety of design simulations can interact in the design process, thus generating a larger solution search space.
Through real-time simulation of product characteristics, each designer can receive immediate feedback regarding his or her decision to facilitate the understanding of trade-offs involved with the decision. These advantages increase the chances for the various kinds of domain knowledge to be integrated into the design, which can be highly effective in improving the product quality. Additionally, the required period for the product development can be reduced dramatically9
.
Also DOME's object-oriented decentralized architecturel4 has the following characteristics.
1. Flexibility: Object-oriented decentralized characteristic of DOME allows both top-down and bottom-up approaches to the problem modeling.
2. Scalability: The DOME can adjust the size and complexity of the simulation depending on those of a design problem.
3. Heterogeneity: Each designer can participate in the design process focusing on their own competency, and exchange services with others in the design network. Services are exchanged as simulation inputs and outputs.
8 However, using the Internet as communication channel causes the problems of asynchrony and difficulty for chronological tracking of the decisions. The asynchrony problem is caused by unknown and varying Internet latency, which is discussed in chapter 4.
9 The advantage has been proved through the pilot project with Polaroid and Ford.
4. Proprietary information: In DOME environment, designers do not have to reveal their own know-how because there is no central server managing the whole information involved with the design problem. Protecting proprietary information leads to the participation and sharing of services between a wider variety of designers. However, this feature causes difficulties in providing designers with knowledge of the problem structure. Problem structure can be well defined by the topology of the relations (constraints) between design parameters. For these reasons, providing an idea on problem structure through problem model will lead to a better set of decisions.
Product =0000. Product Model Problem Model
Pillar Height Design Objective
E-Consumption Decision Criteria
Motor Power
Figure 2-3 Design Problem Model
2.3.2 Object-oriented Modeling and Evaluation (OME) framework
Modeling and evaluating a design problem requires that a large number of aspects be considered. As a result, problems are often solved in a divide and conquer manner, dividing the problem into many problems and solving each with designers from appropriate disciplines. Eventually solutions to the sub-problems are integrated and evaluated to form the complete solution for the whole problem. A divide and conquer approach can reduce the problem complexity and makes the problem easier to solve. However, it becomes more difficult for each designer to see the whole product, and understand global trade-offs. As a result, iteration is likely to be required which can be expensive in time and computation. The purpose of OME is to structure the decomposed problems in a systematic way to identify interactions between sub-problems. Interactions provide designers involved in sub-problems with the knowledge needed to interact with the problem structure as a whole.
2.4 Causality
The direction and topology of the information flow in the design problem is called causality. The causal information defines the dependency between parameters by identifying the function structure of the design problem.
Causality information is important in estimating the expected performance of the product. Also, the feasibility of the design can be verified by tracking the causal chain. In terms of the constraint management problem, knowing causality information can narrow down the search space when trying to resolve conflicts.
2.4.1 Causality in local scope
Causality in a local scope can be determined manually by designers, or it can be automatically generated since complete knowledge of the sub-problem is available. Serrano and Gossard (Serrano and Gossard 1992) suggested a systematic method for automatic causal chain tracking.
1. Match unknown parameters (outputs) to the corresponding constraints.
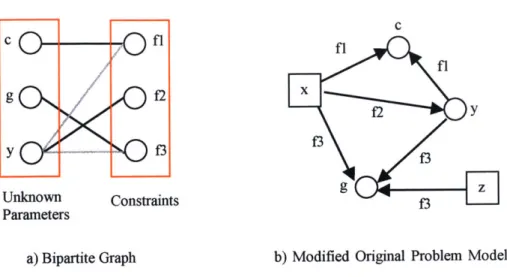
2. Build bipartite graph. The nodes are divided into two sets: unknown parameters (N = (n1,..,n,}) and constraints (F = {fj,..f,}). The edges (E = (el,..,ed) are connecting members of N to those of F only. No member of N is connected to another member of N and no member of F is connected to another member of F.
3. Therefore each edge in E indicates the unknowns and the constraints with which the unknowns are involved. As a result, there is no direct relation between constraints or unknown parameters: all the relations between unknown parameters are made through constraints and vice versa.
4. Find the maximum matching between N and F, which is to find the largest subset of E where no two pairs have the n or f in common. Maximum matching is complete when the number of matchings (cardinality) is same with INI or |F1. Here, the number of unknowns and that of constraints must be the same, which is one of the necessary conditions for the existence of the solution.
5. Once the matching is finished, the result can be applied to the original problem model network, which represents the topology of the constraints. In original problem model network, couple of parameters (nodes) are connected by an undirected edge representing the constraint in which both parameters are included. In this configuration, status of a parameter: whether it is an input or an output is not recognizable (Serrano and Gossard 1992). Steps 1 through 5 are based on the assumption that known parameters (inputs) and unknown parameters (outputs) are distinguishable and each constraint is MISO (multiple inputs and single outputs) system.
c c . ..
fl
g f2 1 f2 y y - f3 f 9 z Unknown Constraints Dn Parametersa) Bipartite Graph b) Modified Original Problem Model
Figure 2-4 Graph Representation of Local Causality (Serrano and Gossard 1992)
In Figure 2-4, the squares are inputs and the circles are outputs. Input nodes do not have an incoming edge, indicating they do not depend on other variables. Gray links means that the corresponding unknown parameter is involved in a relation as an input. In Figure 2-4 the direction of the arrow indicates the causality. The direction of the arrow is reversed, when the arrow represents the dependency.
Constraint network evaluation
After matching is finished and the modified problem model is built, a constraint network can be evaluated. Properties such as consistency, completeness and existence of cyclic dependency are checked to ensure a valid constraint set. When there is a conflict between the constraints, backtracking is required, and the amount (number of steps) of backtracking depends on a tightness of coupling between the constraints (Sanjay and Agustin 1992). Cyclic dependencies are not allowable in some situations, like modeling manufacturing processes, because it means an inconsistency. However, in other situations, cyclic dependency means that the involved parameters need to be solved simultaneously (Serrano and Gossard
1992). The solution for the cyclic dependency problem will be suggested latter part of this chapter.
.1 Conflict resolution and feasibility checking
Decisions of design parameters need to be organized to satisfy a set of design goals as illustrated in Figure
2-5 (Sanjay and Agustin 1992). When there is a conflict between constraints, backtracking determines a
design goal that requires modification. Also, a feasibility of a design goal can be verified by checking the feasibilities of design parameters that depend on the design goal.
-- : Causality
--- l: Backtracking
Figure 2-5 Design goal and parameters
Topological sorting
Under the assumption that the constraint network is a DAG (Directed Acyclic Graph), the constraint network behaves very similar to a tree. Topological sorting on a DAG is a process to sort the nodes of a graph so that no node is preceding the node from which the incoming edge is coming. In general, multiple solutions can exist for topological sorting, because many parameters could exist on a same layer. However, once the topological ordering is finished, the solution sequence and the causal chains are directly recognizable from the sorted graph.
a) Original Constraint Network
b
a d g
c6
e
b) Tree-resembling Sorted Graph
-- * Dependency with Hierarchy --, Dependency within the same level
Figure 2-6 Causality (Dependency) shown by topologically sorted DAG (Serrano and Gossard 1992)
Dp4 DP5 a b c d f e f
2.4.2 Causality in DOME framework
The object-oriented characteristic of DOME allows heterogeneity between design objects and protects embedded proprietary information. Thanks to the ability to include heterogeneous design objects, each designer can participate in design process with his own competency only by defining the service interface with the problem model. By protecting proprietary information, designers can hide core capabilities, including the structure of their models, during the integration process. However, this prevents other designers understanding the relationships between parameters, which is very important information in understanding the problem characteristics and trade-offs related to decisions. Causality information is valuable not only because it helps in decision-making, but also because it can be used to diagnose problems or solve problems efficiently.
2.5 Sensitivity
Quantitative aspects of causal information can be defined through the sensitivity, which is the strength of the relationships between parameters. With the sensitivity information, the designer can see the degree of impact of one parameter on another.
Sensitivity information is very important to product quality, because it directly indicates the robustness of the design to manufacturing variation, aging effects and environmental changes. In this work, sensitivity will be addressed from two different scopes: local and global.
Sensitivity information is also very important in specifying the tolerance of a feature. Rough tolerance can be given to a feature, to which the performance'1 is less sensitive.
2.5.1 Example-Motor Design
Suppose a designer participates in developing a motor, and his responsibility is to determine the torque and the angular velocity, given the predetermined user requirement for power.
The relation between the torque and the angular velocity is shown in Figure 2-7.
0 0 100 75 50 25
Power
=
Torque x Angular Velocity
500 1000 1500
Angular Velocity (RPM)
Figure 2-7 Torque and Angular Velocity
All values of torque and angular velocity on the line satisfy the power requirement. However, as illustrated in Figure 2-7, the sensitivity of power to torque and angular velocity varies along the line. For example, as
aPower
the angular velocity increases the sensitivity of power to angular velocity ( . ) becomes
aAngular Velocity
smaller and the opposite is true for torque.
In this situation if the motor manufacturer desires a motor to maintain a constant torque over angular velocity, determining the value of the torque in sensitive region and angular velocity in a robust (insensitive region) leads to a better design. Larger angular velocities will give a better design.
2.5.2 Sensitivity in a local scope
In this work, the local12 scope of sensitivity is defined as the sensitivity between the parameters within the same design object. In local scope, there is no hidden causal information involved in determining sensitivity.
Single constraint case
Constraint: f(xI,.., x,) = 0
afdx++...X+
dx
ax,
axn
=0Equation 2-2
af
Sensitivity of x, toxj: x1:
---dx,
af
axm
Equation 2-3
Multiple constraint case
Constraint:
fm
(x1,.., x) = 0, m = 0,.., (Equation 2-4) Of1 Of Oft dx1~8x
18x
2 aX af2 8f 2 f2ix,
2 .x. X -=0
ax
...
...
dxxL~
Ix x,_ n-(Equation 2-5) Sensitivity of x. to x: --x
, dxk=
O,fork
l,m
m=1 axm (Equation 2-6)2.5.3 Sensitivity in the DOME framework
In the DOME framework, not only local but also global sensitivity information are required. In figuring out the global sensitivity, an analytic expression of constraints, such as (Equation 2-4), cannot be expected because of the existence of the proprietary information". As a result, empirical or statistical methods may
provide a solution to the problem. However, in many cases, a designer cannot control all the parameters included in a constraint of interest. That is, a designer cannot make dxk = 0 for all k except k=l, m in (Equation 2-6). As a result, there is a difficulty with sensitivity analysis in effect differentiation.
2.6 Circular Dependency
In the design problem model, circular dependency between parameters represents the need for the simultaneous solving of constraints or relationships. When a perturbation is made to the set of relations within the circular dependency, the effect can either converge or diverge. Divergence means there is conflict between the requirements.
Granger's statistical method for detecting circular dependency from the behavior of the involved variables, and Serrano and Gossard's solution plan for the circular dependency are detailed in chapter 5.
3
Related Work
In this chapter, research relevant to this thesis is presented. Work on general constraint management in the area of computer network-centric design environment will be reviewed. Next, previous work in CADlab by Tom Almy (Almy 1998) will presented with his suggestion for perturbation and the effect differentiation method. Finally, causality analysis in econometrics is elaborated.
3.1 Constraint Management
Constraint management is intended to maintain
1. Consistency
2. Completeness
3. Efficient evaluation.
Various approaches have been developed to reduce complexity and computational effort by decomposing constraint sets in an appropriate way. Harary and Steward dealt with the consistent constraint set problem without consideration of inequality constraints (Harary 1962 and Steward 1962). Light suggested a way to check for completeness and consistency from Jacobian matrix of the constraint set, as illustrated in (Equation 2-2) (Light 1980). Chyz fabricated a two-dimensional geometric constraint manager to maintain consistency. Garret developed a methodology to select an applicable constraints set for a specific design problem. His approach used optimization to find a solution for the set of constraints. However, the approach did not deal with causality modification (Garret and Fenves 1986). Serrano developed a software package
named MATHPAK, which has a reversing causality feature. MATHPAK can handle both geometric and non-geometric constraints (Serrano and Gossard 1986).
3.2 Design Complier
Daisie Boettner and Alen Ward developed a tool called the design compiler to convert the description of the product from a high-level (abstract) language to a detailed implementable (concrete) one.
MOTOR PUMP CYLINDER
(Design Schematic)1 CAUSALITY ANALYSIS (Variable Connection) INTERVAL CALCULUS SET OF SUB-OPTIMAL SOLUTIONS
Figure 3-1 Design Compiler (Boettner and Ward 1992)
The idea was to propagate sets of values (intervals) instead of single values, for the purpose of providing a tool for elaborating solution spaces. Boettner and Ward focused on the fact that, in mechanical design, the relations between components are as important as formation of each component. The inputs for the compiler
-oqu~a xs~ol ow=<Sped x risplae>ew/31
, e or oerreru
("P
HP (Flow x Presgire)/1714
wLet-out =Power-in x F fic ir
HPe3600 in-Ih in "- Premsre= Force/Area
K
Velocity =11ow/(3.117 Area)
PIPE "4 Graf 231 in 4 QW A "R reo Vol CU W) fork q". I Arm x Distance > k Ia r cle x INN min 60 see swce ki) ........ ... ... C ity DistanKmAuiffre it 12 inowt ' A-4
are specifications and utility functions, and the outputs are possible implementations. The compiler has an ability to find an optimal solution using a novel interval calculus mathematical scheme. Figure 3-1 is an example of the use of the design compiler.
3.3 Previous work on causality in CADlab
Previous research on causality and sensitivity analysis was done by Tom Almy in MIT CADIab (Almy 1998). The focus of his research was on ordering the variables and visualization of acquired causal information. He also suggested a perturbation method to find hidden causality and sensitivity information. The basic idea of perturbation method is to give a small variation to the input variable and observe the resulting change-in target (output) variables. The ratio of output change to the input variation is equivalent to the partial derivative of output to input, based on the assumption that the related constraint can be regarded as linear in the range of variation. >
Powe v it i xOlumi W in E Cos
nterm able A
34 a at a Custmer Co
Gs Ma CManufactrCostr
.som.s Hous*
U
am
C
_T
Haut
Caualiandsestiiy analysis hasC nsuidwdl i h il feooetis ayapoce
Inp
o si a wc wpEPS CAInpcow
EP lr LCA C ne di n M inC-e Coste P c s i
I coast rasel cs
EPost Rea ald Cs Cost
EPS-Non- aswq Enmsg
Figure 3-2 Visualization of the Causal Information (Almy 1998)
However it is explained in the work that the perturbation method had a problem with identifying the source of effects causing change in the output variable. As can be seen from Figure 3-2, it is not directly recognizable which input is connected to the output. Also, it is hard to track the intermediate variables through which the effect is propagated. Thus, the perturbation method by itself cannot directly determine the topology and the strengh qf relationhis
3.4 Causality and Sensitivity in Econometrics
Causality and sensitivity analysis has been studied widely in the field of econometrics. Many approaches have been based on regression analysis, which will be explained in detail in the later chapter. The focus of
the research is whether the relation between two parameters is a mere ionAtiQorhqtat. For example, if the sugar price of Mexico is observed to change after the price of milk in the United States changes, two different scenarios can arise from the same observation: 1) the sugar price of Mexico causes the change in milk price within the United States, or 2) there is a third factor, such as coffee price in Brazil, that affects both prices with a different time lag. Figure 3-3 shows two different configuration of causal chain with same phenomenon
A Tj
A TB C
T2
A: sugar price in Mexico B
B: milk price in US C: coffee price in Brazil
T: time lag between cause and effect
1) Causation (A and B) 2) Mere Correlation between A and B without Causation
Figure 3-3 Causation and Correlation
When a time lag between Cnd A (T1) is smaller than that between C and B (T2) the difference between 1) causation and 2) mere correlation is difficult to distinguish.
3.4.1 Detection of causality
Distinguishing causation from correlation has been an important issue in econometrics. Regression analysis is based on an assumption that there is a causal relation between parameters, so regression cannot be used as verification for causality-it can only provide an approximation for sensitivity. Granger (Granger 1969) suggested a way to detect causality from the time series. The basic idea behind Granger causality is that if the variance of ong -yariab@,ay , is larger than its variance conditional upon past value of the other
variable, say X, then we can conclude that X causes Y. Granger Causality: .2(Y,
A,)<
o(Y
jA, -X,)Equation 3-1
3.4.2 Circular dependency
Granger also suggested the method to detect circular dependency between variables by checking the following equations.