HAL Id: inserm-00679274
https://www.hal.inserm.fr/inserm-00679274
Submitted on 7 Oct 2013
HAL is a multi-disciplinary open access
archive for the deposit and dissemination of
sci-entific research documents, whether they are
pub-lished or not. The documents may come from
teaching and research institutions in France or
abroad, or from public or private research centers.
L’archive ouverte pluridisciplinaire HAL, est
destinée au dépôt et à la diffusion de documents
scientifiques de niveau recherche, publiés ou non,
émanant des établissements d’enseignement et de
recherche français ou étrangers, des laboratoires
publics ou privés.
Epstein-Barr virus nuclear antigen 1 and cellular
chromatin during interphase and mitosis.
Nathalie Jourdan, Aude Jobart-Malfait, Gabriel dos Reis, Frédérique
Quignon, Tristan Piolot, Christophe Klein, Marc Tramier, Maïté Coppey,
Vincent Marechal
To cite this version:
Nathalie Jourdan, Aude Jobart-Malfait, Gabriel dos Reis, Frédérique Quignon, Tristan Piolot, et al..
Live-cell imaging reveals multiple interactions between Epstein-Barr virus nuclear antigen 1 and
cellu-lar chromatin during interphase and mitosis.. Journal of Virology, American Society for Microbiology,
2012, 86 (9), pp.5314-29. �10.1128/JVI.06303-11�. �inserm-00679274�
Published Ahead of Print 15 February 2012.
2012, 86(9):5314. DOI: 10.1128/JVI.06303-11.
J. Virol.
Tramier, Maïté Coppey-Moisan and Vincent Marechal
Frédérique Quignon, Tristan Piolot, Christophe Klein, Marc
Nathalie Jourdan, Aude Jobart-Malfait, Gabriel Dos Reis,
during Interphase and Mitosis
Nuclear Antigen 1 and Cellular Chromatin
Interactions between Epstein-Barr Virus
Live-Cell Imaging Reveals Multiple
Updated information and services can be found at:
http://jvi.asm.org/content/86/9/5314
These include:
REFERENCES
http://jvi.asm.org/content/86/9/5314#ref-list-1
at:
This article cites 75 articles, 38 of which can be accessed free
CONTENT ALERTS
more»
articles cite this article),
Receive: RSS Feeds, eTOCs, free email alerts (when new
http://journals.asm.org/site/misc/reprints.xhtml
Information about commercial reprint orders:
http://journals.asm.org/site/subscriptions/
Virus Nuclear Antigen 1 and Cellular Chromatin during Interphase
and Mitosis
Nathalie Jourdan,a,b,c* Aude Jobart-Malfait,d,e* Gabriel Dos Reis,a,b,cFrédérique Quignon,a,b,cTristan Piolot,d,e* Christophe Klein,a,b,c
Marc Tramier,d,e* Maïté Coppey-Moisan,d,eand Vincent Marechala,b,c
UPMC Université Paris 6, UMRS 872, Paris, Francea; INSERM, UMRS 872, Paris, Franceb; Université Paris Descartes, UMRS 872, Paris, Francec; CNRS, Institut Jacques Monod,
UMRS 7592, Paris, Franced; and Université Paris-Diderot, Institut Jacques Monod, UMRS 7592, Paris, Francee
Epstein-Barr virus (EBV) establishes a life-long latent infection in humans. In proliferating latently infected cells, EBV genomes
persist as multiple episomes that undergo one DNA replication event per cell cycle and remain attached to the mitotic
chromo-somes. EBV nuclear antigen 1 (EBNA-1) binding to the episome and cellular genome is essential to ensure proper episome
repli-cation and segregation. However, the nature and regulation of EBNA-1 interaction with chromatin has not been clearly
eluci-dated. This activity has been suggested to involve EBNA-1 binding to DNA, duplex RNA, and/or proteins. EBNA-1 binding
protein 2 (EBP2), a nucleolar protein, has been proposed to act as a docking protein for EBNA-1 on mitotic chromosomes.
How-ever, there is no direct evidence thus far for EBP2 being associated with EBNA-1 during mitosis. By combining video microscopy
and Förster resonance energy transfer (FRET) microscopy, we demonstrate here for the first time that EBNA-1 and EBP2 interact
in the nucleoplasm, as well as in the nucleoli during interphase. However, in strong contrast to the current proposed model, we
were unable to observe any interaction between EBNA-1 and EBP2 on mitotic chromosomes. We also performed a yeast
double-hybrid screening, followed by a FRET analysis, that led us to identify HMGB2 (high-mobility group box 2), a well-known
chro-matin component, as a new partner for EBNA-1 on chrochro-matin during interphase and mitosis. Although the depletion of HMGB2
partly altered EBNA-1 association with chromatin in HeLa cells during interphase and mitosis, it did not significantly impact the
maintenance of EBV episomes in Raji cells.
E
pstein-Barr virus (EBV) is a lymphocryptovirus member of the
Gammaherpesvirinae subfamily that infects
⬎90% adults
worldwide. Paradoxically, EBV has been associated with
numer-ous tumors whose incidence increases in immunosuppressed
pa-tients (55). Although primary EBV infection usually occurs at an
early age in an asymptomatic form, it can also result in infectious
mononucleosis when it occurs during adolescence or later in life
(43). The virus is mainly transmitted by saliva, and primary
infec-tion occurs in oropharyngeal cells. Then, EBV establishes a
persis-tent lapersis-tent infection mainly in the memory B-cell compartment
(39). Latent EBV infection has been associated with several
malig-nancies, including Burkitt’s lymphoma, nasopharyngeal
carci-noma, Hodgkin’s lymphomas, T-cell lymphomas, gastric
adeno-carcinoma, and others (62, 73).
In latently infected B cells EBV genomes persist as multicopy
covalently closed double-stranded circular episomes (28, 34). In
proliferating cells these episomes undergo one DNA replication
event per cycle and are efficiently partitioned during cell division,
enabling the viral genomes to be maintained at a constant average
copy number per cell (1, 70). Two viral components only, the
latent origin of DNA replication, oriP, and the EBNA-1 protein,
are required for episome maintenance in proliferating cells (32,
69, 71). oriP is composed of two elements: a dyad symmetry (DS)
element that contains four EBNA-1 binding sites and a family of
repeats (FR) containing 20 EBNA-1 recognition sites (4, 50).
EBNA-1 is a 641-amino-acid (aa) protein in the B95.8 strain. Two
functions of EBNA-1 are required for episome maintenance. First,
by concomitantly binding to DS (19, 57), to replication cellular
factors (13), and to cellular chromatin (24), EBNA-1 activates
episome replication during the S phase. Second, EBNA-1
simul-taneously associates with the FR element and cellular
chromo-somes during mitosis, therefore ensuring an efficient coupling
between cellular and viral genome segregation (29, 38, 41). In
addition, EBNA-1 modulates the expression of several viral (3, 52,
69) and numerous cellular promoters (10, 14, 35). Thus, EBNA-1
activities are intimately associated with its ability to interact with
chromatin throughout the cell cycle. EBNA-1 interaction with
chromatin during interphase has been evaluated by various
bio-chemical fractionations procedures with controversial
conclu-sions. Indeed, while Kanda et al. showed that EBNA-1 copurified
with the chromatin, Daikoku et al. and Ritzi et al. found only
minor amounts of EBNA-1 in the chromosomal pellet from
inter-phase cells (12, 24, 51). During mitosis EBNA-1 binding to
chro-mosomes is linked to the presence of three independent
chromo-some-binding sites (CBS), namely, CBS-1 (aa 72 to 84), CBS-2 (aa
328 to 365), and CBS-3 (aa 8 to 54) (16, 18, 36). However, the
molecular mechanism responsible for EBNA-1 interaction with
mitotic chromosomes has been much debated, and several
non-mutually-exclusive hypotheses have been proposed. Sears et al.
Received 15 September 2011 Accepted 31 January 2012 Published ahead of print 15 February 2012
Address correspondence to Nathalie Jourdan, nathalie.jourdan@upmc.fr. * Present address: N. Jourdan, UPMC-FRE 3402 CNRS, Paris, France; T. Piolot, Institut Curie, UMR 3215 CNRS / U934 INSERM, Paris, France, and M. Tramier, IGDR UMR 6061, Université de Rennes 1, Rennes, France.
Copyright © 2012, American Society for Microbiology. All Rights Reserved. doi:10.1128/JVI.06303-11
identified an AT-hook structure in the N terminus of EBNA-1 that
could bind to AT-rich DNA (54). CBS-2 and CBS-3 also contain
RGG motifs that have been identified within several RNA-binding
proteins. Since Braco-19, a molecule that disrupts G-quadruplex
RNA, also disrupted EBNA-1 interaction with metaphase
chro-mosomes, it was suggested that EBNA-1 binding to RNA may be
required to load EBNA-1 on chromosomes or to stabilize this
interaction during mitosis (44). Finally, EBNA-1 may interact
with chromatin through direct protein-protein interactions. Thus
far, EBNA-1 binding protein 2 (EBP2) is the only cellular protein
that has been shown to be required for EBNA-1 binding on
mi-totic chromosomes. EBP2 was initially isolated from a
double-hybrid screen with EBNA-1 (58). EBP2 and EBNA-1 were further
shown to copurify from insect cells coexpressing both proteins
(58). EBP2 binds to a Gly/Arg-rich region of EBNA-1 that has
been mapped between aa 325 and 376 (58), which closely mapped
to CBS2. A truncation form of EBNA-1 mutant lacking EBP2
binding site (EBNA-1⌬325-376) was shown to promote the
rep-lication of oriP containing plasmids but was defective in
support-ing their long-term maintenance in human cells (58), as well as in
yeast cells (27). EBNA-1⌬325-376 is still nuclear but fails to attach
to the cellular chromosomes in cells artificially blocked in
meta-phase (67). Moreover, the apparent colocalization of EBNA-1 and
EBP2 on mitotic chromosomes (42, 67) and the loss of EBNA-1
localization onto chromosome in cells where EBP2 expression has
been silenced or where EBP2 has been dissociated from
chromo-some by an Aurora kinase (26) suggested that EBP2 could act as an
docking protein for EBNA-1 on mitotic chromosomes.
Surprisingly, there is still no evidence for a direct interaction
between EBNA-1 and EBP2 in living mitotic cells. In the present
study, we reexamined the dynamics of interaction between
EBNA-1 and EBP2 in living cells, using a combination of live-cell
imaging approaches. This study led us to conclude that EBP2
in-teracted with EBNA-1 during interphase but not during mitosis.
Subsequent experiments identified HMGB2 (high-mobility group
box 2), a well-characterized chromatin-bound protein, as a new
partner for EBNA-1 on chromatin both during interphase and
mitosis.
MATERIALS AND METHODS
Recombinant plasmids. Plasmids pEGFP-N1, pEGFP-C1, pDsRed1-N1,
and pDsRed1-C1 (BD Biosciences Clontech, Palo Alto, CA) encoded ei-ther a variant of the green fluorescent protein with enhanced fluorescence (EGFP) or a red fluorescence protein (DsRed).
Human EBP2 was expressed as a fusion protein to the N and C termini of EGFP and the N and C termini of DsRed, respectively, in pEBP2-EGFP, pEGFP-EBP2, pEBP2-DsRed, and pDsRed-EBP2. EBP2 cDNA was cloned from HeLa cells. For this purpose, total RNA was extracted with a High-Pure RNA isolation kit (Roche Diagnostics, Mannheim, Germany) and subjected to a reverse transcription by using a Ready-to-Go You Prime First-Strand Beads kit according to the manufacturer’s recommen-dations (Amersham Biosciences UK, Little Chalfont, Buckinghamshire, United Kingdom). The region encoding human EBP2 was subsequently amplified from the cDNA by PCR with the EBP2 upstream primer (5=-C CCAAGCTTGGGCCACCATGGACACTCCCCCGCTCTCG-3=) and the EBP2 downstream primer 5=-CGCGGATCCCGGTGTGTTCTGTTCTT CATCTTCTC-3=. The resulting PCR product was digested by HindIII and BamHI, gel purified, and cloned into pEGFP-N1, pEGFP-C1, pDsRed1-N1, and pDsRed1-C1.
pDsRed-N1-EBP2-oriP was obtained by inserting oriP sequence up-stream of the cytomegalovirus (CMV) promoter into pDsRed-N1-EBP2. The region containing oriP was amplified from pCEP4 (Invitrogen) by
PCR with the oriP upstream primer 5=-CGCCATGCATTAGTTATTAA
TGCCTTTATGTGTAACTCTTG-3= and the oriP downstream primer
5=-CCGTAATTGATTACTATTAATAGTAATCAATTACGG-3=. Upstream
and downstream primers were designed to have 21 bases (boldface letters) with homology to the linear ends of AseI-cleaved pDsRed-N1-EBP2 plas-mid. The resulting PCR product was purified by affinity chromatography and cloned into pDsRed-N1-EBP2 by using a cold fusion cloning kit (SBI, Mountain View, CA).
The EBNA-1⌬GlyAla deletion construct was obtained by using the
pEGFP-C1-EBNA-1 plasmid containing the entire EBNA-1 coding se-quence (aa 8 to 641) described previously (36), from which the central Gly-Ala repeated region (aa 93 to 325) was removed by using a two-step PCR overlapping procedure. Briefly, the DNA sequence encoding EBNA-1 N-terminal part (aa 8 to 90) (part A) was fused in frame to DNA encoding the EBNA-1 C-terminal part (aa 326 to 641) that we can separate into two parts (aa 326 to 486 for part B and aa 487 to 641 for part C). In the first PCR step, primers 1 and 2 (described below) were used to amplify part A, whereas primers 3 and 4 were used to amplify part B of EBNA-1. Primer 2 was designed to overlap part B, and primer 3 was designed to overlap part A. The partly overlapping PCR products from the two sepa-rate reactions were gel purified and mixed together with primers 1 and 4 in a second PCR in order to produce DNA encoding part A fused to part B (A-B) of EBNA-1. These primers were as follows: primer 1 (5=-GCCCGG
AATTCTGCAGATACAGGAC-3=), primer 2 (5=-GGCCTCCACCTCCT
GCTCCTGTTCC-3=), primer 3
(5=-AGGAGCAGGAGGTGGAGGCCG-3=), and primer 4 (5=-TCATCTGCGGGGCCCTGCTC-3=). Boldface letters indicate the part A sequence, and the part B sequence is underlined. Italics indicate restriction sites (EcoRI for primer 1 and ApaI for primer 2). The PCR product from the second reaction (A-B sequence) was di-gested with EcoRI and ApaI and cloned into pEGFP-C1-EBNA-1 plasmid in place of A-GlyAla-B sequence to generate the pEGFP-C1-EBNA-1 ⌬GlyAla deletion construct. The region encoding EBNA-1 ⌬GlyAla was digested with EcoRI and BamHI and cloned into pDsRed1-C1 plasmid to
generate the pDsREd1-C1-EBNA-1 ⌬GlyAla plasmid.
pEGFP-N1-EBNA-1⌬GlyAla and pDsRed1-N1-EBNA-1 ⌬GlyAla were obtained as
follows. The region encoding EBNA-1⌬GlyAla was generated by PCR
from pEGFP-C1-EBNA-1⌬GlyAla with the EBNA-1 upstream primer
5=-AGCCGGAATTCCCACCATGACAGGACCT-3= and the EBNA-1 downstream primer 5=-CGGGATCCTTCTCCTGCCCTTCCTC-3=. The EBNA-1 upstream primer has been designed for inserting an EcoRI re-striction site, a Kozak sequence, and a translation initiation codon
up-stream of EBNA-1⌬GlyAla. The EBNA-1 downstream primer has been
designed for suppressing the stop codon at the 3=-terminal sequence of
EBNA-1⌬GlyAla and for inserting a BamHI restriction site. The resulting
PCR product was digested by HindIII and BamHI, gel purified, and cloned into pEGFP-N1 and pDsRed1-N1.
The EBNA-1⌬90-376 deletion construct was obtained by using the
pEGFP-C1-EBNA-1 from which the central GlyAla repeated region (aa 90 to 325) and the EBP2 binding region (aa 325 to 376) were removed by two-step PCR. Briefly, EB1 upstream primer (5=-GGAATTCCTCTGAC GAGGGGCCAGGTAC-3=) and EB2 downstream primer (5=-TGTTCCA CCGTGGGTCCCTTTGC-3=) were used to amplify the 8-89 EBNA-1 re-gion, whereas EB3 upstream primer (5=-GGAGAAAAGAGGCCCAGGA GT-3=) and EB4 downstream primer (5=-CGGGATCCCGTCACTCCTG CCCTTCCTCACCCTC-3=) were used to amplify the 377-641 EBNA-1 region. Primers EB2 and EB3 were drawn in order to generate blunted end. Both regions were then fused by a ligation reaction; the resulting product was amplified by primers EB1 and EB4 in a second PCR to pro-duce DNA encoding the EBNA-1 sequence deleted from the aa 90 to 376. The PCR product from the second reaction was digested with EcoRI and BamHI and cloned into pEGFP-C1 plasmid to generate the
pEGFP-C1-EBNA-1⌬90-376 construct.
The cDNAs encoding human HMGB1and HMGB2 were cloned from HeLa cells. Both proteins were expressed as fusion proteins to the N and C
termini of EGFP or the N and C termini of DsRed, as described previously (46).
Cell culture, DNA transfection, and cell cycle synchronization.
Hu-man HeLa cells (ATCC CCL-2) were grown in Dulbecco modified Eagle medium (DMEM) supplemented with 10% fetal calf serum (FCS) and 2
mML-glutamine in a 95% air–5% CO2incubator at 37°C. Raji cells
(ATCC CCL-86) were grown in advanced RPMI medium supplemented
with 10% FCS and 2 mML-glutamine in a 95% air–5% CO2incubator at
37°C. For transfection experiments, HeLa cells were grown on glass cov-erslips in six-well plates until they reached ca. 80% confluence. Plasmids were transfected with the Lipofectamine 2000 reagent (Invitrogen) ac-cording to the manufacturer’s recommendations. For cell cycle synchro-nization at M phase, the cells were treated at 44 h posttransfection with nocodazole (40 ng/ml) for 4 h. After two washes with DMEM/F-12 to eliminate nocodazole, mitotic cells were observed by fluorescence micros-copy.
Time-lapse microscopy. Cells grown on glass coverslips were
mounted in a cell observation chamber filled with complete medium without phenol red. The microscope chamber was kept at 37°C in a 95%
air–5% CO2atmosphere. Images were acquired with a Leica DMI6000
microscope (100⫻ oil PlanApo, NA 1.4), a Piezo electric translator (Physik Instrument, Karlsruhe, Germany), a lambda DG-4 illuminator (Sutter Instrument, Novato, CA), and a CoolSnapHQ2 (10 MHz, binning of 2, mode Alt-Normal; Roper Scientific, Evry, France) driven by Meta-morph7.3. The dichroic sets 470AF20/500DRLP/535AF35 and 525AF45/ 560DRLP/595AF60 were, respectively, used for collecting GFP and mRFP fluorescence. Time-lapse imaging was done by acquiring images every minute, at 10 different positions. A 0.3-m z-step and a range of 20 m were used in each position. Images were deconvoluted using Huygens Software Pr (SVI, Hilversum, Netherlands). Colocalization analyses were performed using ImageJ software (W. S. Rasband, ImageJ [U.S. National
Institutes of Health, Bethesda, MD; http://rsb.info.nih.gov/ij,
1997-2009]).
Confocal microscopy. For confocal analysis, a Leica Sp5 microscope
equipped with a 63⫻ oil PlanApo (NA 1.4) was used. Cells were scanned
at 400 Hz with a resolution of 1,024⫻ 512 pixels and a voxel size of 107 by
107 by 300 nm. The pinhole was adjusted so as to fit the airy disc. DAPI (4=,6=-diamidino-2-phenylindole), green fluorescent protein (GFP), and red fluorescent protein (RFP) were, respectively, excited at a 405-, 488-, and 561-nm wavelengths, and the emission fluorescence levels were de-tected by using a photo-multiplicator at, respectively, between 410 and 480 nm, 495 and 550 nm, and 590 and 670 nm. Three channels were recorded sequentially at each z-step.
Photobleaching. Cells were kept at 37°C in a 5% CO2atmosphere,
and FRAP (fluorescence recovery after photobleaching) was performed on a confocal Zeiss LSM 710 microscope. A 488-nm laser and a
C-Apo-chromat lens (⫻63, 1.2 NA) was used in the photobleaching experiments.
A circular region of interest 3 m in diameter was bleached with the 488-nm laser at full power, and subsequent scans were taken at 0.5% of full power. Five images were taken before bleaching, and then images were acquired every 1.15 s for 96 s. An average of eight data sets were analyzed for each result. Images of each data set were normalized and corrected for acquisitional photobleaching (47), plotted with time, and fitted individ-ually with a diffusion model (59) to determine the characteristic diffusion
time (D).
FRET determination by tdFLIM measurement. Two systems were
used for FRET determination by time domain fluorescence lifetime im-aging microscopy (tdFLIM) using the time- and space-correlated single-photon counting method (63). This method provides in picoseconds (ps) the time-resolved fluorescence decay for every pixel by counting and sam-pling single emitted photons according to (i) the time delay between pho-ton arrival and laser pulse (ps time scale, 4,096 channels) and (ii) their xy
coordinate (256⫻ 256 pixel image).
(i) A quadrant anode system was used for the FRET experiments per-formed in the absence of oriP region. It is based on a titanium sapphire
laser (Millennia 5W/Tsunami 3960-M3BB-UPG kit; Spectra-Physics, Evry, France) that delivers ps pulses was tuned at 960 nm to obtain an excitation wavelength at 480 nm after frequency doubling. The repetition rate was 4 MHz after pulse-picker (Spectra-Physics, catalog no. 3980-35). The laser beam was expanded and inserted into an inverted epifluores-cence microscope (DM IRBE; Leica, France) for wide-field illumination (a
few mW/cm2). The microscope stage was equipped with an incubator
system for temperature and CO2regulation (37°C, 5% CO2). Green
flu-orescence decay images were obtained using a Leica Plan-Apochromat oil
lens (⫻100, 1.3 NA), a dichroic beam splitter (505DRLP, Omega;
Opto-photonics, Eaubonne, France), an emission filter (535DF35, Omega; Op-tophotonics), and the quadrant anode TSCSPC detector (QA;
Europho-ton GmbH, Germany). A band-pass emission filter (518 nm⬍ em⬎ 552
nm) was chosen to select the donor fluorescence (EGFP) and to reject the acceptor fluorescence (DsRed). The count rate was up to 30 kHz. Acqui-sition of fluorescence decay images was done after accumulation of suffi-cient single photon events, usually after 3 to 6 min. A temporal resolution
of⬍100 ps and a spatial resolution of 500 nm were previously determined
for this system (63).
(ii) A MicroTime 200 (PicoQuant, Berlin, Germany) was used to mea-sure FRET between GFP–EBNA-1 and DsRed-EBP2 with or without oriP-containing plasmid. A pulsed diode laser operating at 470 nm (Pico-Quant) is focused at the center of the optical axis in the sample through a
water objective with a high-numerical aperture objective (⫻60, NA 1.3)
mounted on an inverted microscope (Olympus, Tokyo, Japan). The flu-orescence emission passes through a double dichroic mirror (DM 470/471 nm) and is focused on a pinhole. An avalanche photodiode (SPADs 14;
Perkin-Elmer), in front of which is placed an emission filter (525⫾ 25
nm), constitutes the GFP fluorescence detector. The subcellular position of the region of interest is chosen by first acquiring a prescan image of the field of view. A continuous DPSS laser operating at 470 nm is used to acquire the DsRed fluorescence into the red channel, in front of which is
placed the emission filter (593⫾ 20 nm). A TimeHarp 300PC board
(PicoQuant) is used in a time-tagged time-resolved (TTTR) mode and coupled to a PC that pilots data acquisition and analysis using Sympho-time software (PicoQuant). A single photo-counting TTTR trace was ac-quired over 20 s.
tdFLIM data analysis. For qualitative determination of FRET, the
flu-orescence decays of EGFP within the regions of interest were extracted from the acquisition matrix, and the decays of EGFP-tagged proteins (do-nor) in the presence of DsRed-tagged proteins (acceptor) were compared to the control decays of the EGFP-tagged proteins measured in the ab-sence of acceptors. Since the DsRed protein emits a weak green fluores-cence before maturation in vitro as well as in vivo, the decays of the green species of each DsRed-tagged protein in the BP emission filter were ana-lyzed in cells cotransfected with GFP. In these cells, no other component than GFP lifetime could be detected, indicating that immature DsRed from each DsRed-tagged protein cannot contribute to decay obtained with GFP.
To perform quantitative analyses, the experimental fluorescence de-cays were further deconvoluted with the instrument response function and fitted to a monoexponential and a biexponential function using a Marquardt nonlinear least-squares algorithm (Globals Unlimited Soft-ware/University of Illinois at Urbana-Champaign) or using the Sympho-time software (PicoQuant). The fluorescence decay of EGFP-tagged
pro-teins in monotransfected cells was monoexponential with a⌻1 lifetime. In
cotransfected cells in which the fluorescence decay was faster than in monotransfected cells, the fluorescence decay of EGFP-tagged proteins was biexponential with a fixed T1 lifetime and a faster T2 lifetime. From the relative amplitudes of the lifetime components, we quantified the
respective proportions of the two donor populations namely, ␣1 (⌻1
life-time corresponding to the unbound donor) and ␣2 (T2 faster lifelife-time corresponding to the donor interacting with an acceptor).
Yeast two-hybrid screening. A cDNA encoding EBNA-1 truncated
do-main into pAS2.1 (Clontech) between EcoRI and BamHI sites. A premade HeLa cell random cDNA library fused with GAL4 AD in pGAD-GH (Clontech) was used. A yeast two-hybrid assay was performed according to the manufacturer’s protocol. Briefly, Saccharomyces cerevisiae CG-1945 strain was cotransformed with cDNA HeLa/pGAD-GH and 1-90/327-410 EBNA-1/pAS2.1 or pAS2.1 control. The transformed yeasts were selected
on agar plates with a double (⫺Leu/⫺Trp) or a triple (⫺Leu/⫺Trp/
⫺His) dropout of the essential amino acids. Prey plasmids from dropout-resistant yeast clones were isolated, and cDNA inserts were sequenced for identification. Plasmids encoding for putative EBNA-1 partners were fur-ther tested in Y2H assay with plasmids encoding three different baits:
1-90/327-410 EBNA-1, EBNA-1⌬GA, and EBNA-1 full length.
Trans-formed CG1945 cells were screened with high stringency by plating on ⫺Leu/⫺Trp/⫺His selective dropout minimal medium containing 25 mM 3-aminotriazole.
Cell transduction by lentiviral vectors for delivery of shRNA to HMGB2. Two different pLKO.1 lentiviral vectors targeting distinct
re-gions of HMGB2 mRNA were used to transduce Raji and HeLa cells. Both constructs have been previously used to inactivate HMGB2 expression in UT-7 cells (31). After 3 weeks of continuous selection with puromycin, HMGB2 expression was monitored by Western blot as described previ-ously (31). EBV episomes were quantified by using Kappa SYBR Fast qPCR Master Mix (Kapa Biosystems, Boston, MA) with the primers 5=-G GAGATACTGTTAGCCCTG-3= and 5=-GTGTGTTATAAATCTGTTCC AAG-3= designed within the region encoding BHRF1. Cellular DNA was quantified by using the primers 5=-TAGCAACCTCAAACAGACACC A-3= and 5=-CAGCCTAAGGGTGGGAAAAT-3= designed within the re-gion encoding the -globin.
RESULTS
EBNA-1 and EBP2 partly colocalize in living cells throughout
the cell cycle. EGFP- and DsRed-tagged forms of EBNA-1 and
EBP2 were expressed in human HeLa cells and observed by live
cell imaging during interphase and mitosis. This approach was
chosen because it prevents artifactual mislocalization that may
result from the use of chemical fixative or drugs that irreversibly
block cell cycle progression, such as demecholcine, as previously
observed (46). During interphase, EBNA-1 colocalized mainly
with condensed and dispersed forms of the chromatin, which are
characterized by intense and weak Hoechst staining, respectively
(Fig. 1A). In addition, a weak nucleolar staining was observed in
most cells. EBP2 concentrated mainly, albeit not exclusively, in
the nucleoli during interphase, as confirmed by differential
inter-ference contrast microscopy (Fig. 1B). Importantly, the
subcellu-lar localization of the resulting tagged proteins was not influenced
by either the nature of the fluorophores or their relative positions
in the fusion proteins.
A time course analysis was performed by quantitative video
microscopy on cells coexpressing DsRed–EBNA-1 and
GFP-EBP2. During interphase, EBNA-1 and EBP2 partly colocalized
both within and outside the nucleolus (Fig. 2a to c). From
meta-phase to cytokinesis EBNA-1 diffusely coated the mitotic
chromo-somes, as reported previously (26, 36, 42, 67, 68). Importantly,
only 13 to 15% of the EBP2 colocalized with EBNA-1 on
chromo-somes. Indeed, EBP2 dispersed within the nucleoplasm after
nu-cleolus breakdown and exhibited two localizations during mitosis
(Fig. 2e, h, and k). In addition to a weak diffuse staining in the
nucleoplasm, we also detected EBP2 around the chromosomes
and close to a structure that was highly reminiscent of the mitotic
spindle. At the end of mitosis, the fluorescence of GFP-EBP2
de-creased in the vicinity of the mitotic spindle, an observation
con-sistent with the progressive depolymerization of spindle
microtu-bules between daughter cells (Fig. 2k and l). Based on these
observations, we evaluated that an average of 96% of the EBNA-1
colocalized with EBP2 during metaphase, 61% during anaphase,
and 58% at the end of mitosis.
EBNA-1 and EBP2 interact in nucleoli and nucleoplasm
dur-ing interphase. We investigated a possible interaction between
EBNA-1 and EBP2 by measuring Förster resonance energy
trans-fer (FRET). FRET is a nonradiative energy transtrans-fer that can occur
when a donor and a compatible acceptor fluorophore are located
at a distance lower than 10 nm from each other (15). FRET can be
detected via tdFLIM and used to monitor protein-protein
inter-actions in living cells (11). Indeed, if the interacting proteins are
conjugated to suitable donor and acceptor fluorophores in such a
way that the fluorescence emission spectrum of the donor
over-laps the absorption spectrum of the acceptor and their dipoles
align, FRET occurs and reduces the lifetime of the donor
fluores-cence (11). In the present case, a tdFLIM setup was used to
mea-sure FRET with a spatial accuracy of a few hundred nanometers,
which is therefore well adapted for studies at a subcellular scale.
Since tdFLIM measurement is not sensitive to fluorophore
con-centration or unintended photobleaching, it is especially
appro-priate for detecting FRET in transiently transfected cells. Finally,
tdFLIM analysis can give access to the proportion of GFP-tagged
molecules involved in a FRET at the single-cell level (63).
FRET efficiency relies on the relative positions and distance of
FIG 1 Subcellular localization of tagged proteins by confocal microscopy in
living cells. (A) HeLa cells were cotransfected with either GFP–EBNA-1 (a) and DsRed–EBNA-1 (b) or with EBNA-1–GFP (d) and EBNA-1–DsRed (e). The DNA was stained with Hoechst. Images a to f show single confocal z-section. Whatever the nature and the position of the fluorophore, EBNA-1 colocalizes with chromatin (c and f). Scale bar, 10 m. (B) HeLa cells were cotransfected with either GFP-EBP2 (a) and DsRed-EBP2 (b) or with EBP2-GFP (d) and EBP2-DsRed (e). Images a to f show single confocal z-section. Whatever the nature and the position of the fluorophore, EBP2 colocalizes perfectly with nucleoli (arrowheads) observed by differential interference contrast (D.I.C.) (c and f). Scale bar, 10 m.
the donor and acceptor fluorophores even when fusion proteins
are in close interaction. Therefore, FRET was performed with the
eight possible pairs obtained when combining the different
do-nors (GFP-EBP2, EBP2-GFP, GFP–EBNA-1, and EBNA-1–GFP)
with the different acceptors (DsRed–EBNA-1, EBNA-1–DsRed,
DsRed-EBP2, and EBP2-DsRed) to minimize false-negative
re-sults. Since identical results were obtained with the eight possible
donor/acceptor pairs, we only present here data collected from
cells coexpressing GFP-EBP2 and DsRed–EBNA-1.
As illustrated in Fig. 3, we first performed a pixel-by-pixel
ac-quisition of GFP fluorescence decay in cells expressing GFP-EBP2
alone (Fig. 3A, condition a) or coexpressing DsRed–EBNA-1 (Fig.
3A, condition b). Two mean lifetime values were measured for
GFP-EBP2 alone, depending on its subnuclear localization:
2.57
⫾ 0.02 ns (n ⫽ 8 cells) in the nucleoplasm and 2.49 ⫾ 0.015
ns (n
⫽ 8 cells) in the nucleolus. This result was consistent with the
well-known effect of the local environment of the fluorophore on
its fluorescence lifetime (30). Subsequently, regions of interest
(ROIs) corresponding to nucleolar and nucleoplasmic areas were
manually drawn from tdFLIM images (Fig. 3B) and GFP-EBP2
fluorescence decay was analyzed. In the nucleoli, GFP-EBP2
fluo-rescence decay was significantly faster in the presence (see the red
curves in Fig. 3C) than in the absence (see the green curves in Fig.
3C) of DsRed–EBNA-1, demonstrating that EBNA-1 and EBP2
interact with each other in this compartment. Subsequent analysis
allowed us to estimate that 31% of the GFP-EBP2 interacted with
DsRed–EBNA-1 in the nucleoli (Fig. 3). Surprisingly, whereas
only low amounts of GFP-EBP2 were detected in the nucleoplasm
(Fig. 2), a significant FRET was also be measured in this
compart-ment (Fig. 3C, Np), and we calculated that 35% of the GFP-EBP2
interacted with DsRed–EBNA-1 out of the nucleoli.
Altogether, these results demonstrated for the first time that
EBNA-1 and EBP2 interact specifically in living cells during
inter-phase, a finding which is in agreement with previous data obtained
by yeast double-hybrid screening and biochemical approaches
FIG 2 Dynamic localization of EBNA-1 and EBP2 throughout the cell cycle.
Living HeLa cells coexpressing GFP-EBP2 and DsRed–EBNA-1 were observed from interphase (a to c) to mitosis (d to l) by video microscopy. All images are deconvoluted z-optical sections. Colocalized pixels (in white) from the merge images were quantified with ImageJ software. The standard deviations are
indicated (n⫽ 4). Scale bars, 10 m.
FIG 3 EBP2 and EBNA-1 interact in the nucleolus and the nucleoplasm during interphase. tdFLIM-FRET measurements were carried out by acquiring
fluorescence decay images for GFP fluorescence (515 nm⬍ ⬎ 560 nm), in HeLa cells transfected with GFP-EBP2 alone (images Aa and Ba) or in the presence
of DsRed–EBNA-1 (images Ab and Bb). (A) tdFLIM images were obtained by analyzing the fluorescence decays with a single lifetime pixel by pixel and are displayed as fluorescence lifetime pseudocolor maps. A lifetime colored scale is presented. Each arrow indicates a nucleolus. (B) Regions of interest (ROIs) corresponding to the nucleolus and nucleoplasm have been selected from tdFLIM images. (C) The fluorescence decay of GFP-EBP2 was measured in each ROI in the absence (condition a, green curves) or in the presence of DsRed–EBNA-1 (condition b, red curves). (D) The experimental curves were further fitted with
a biexponential function using Globals Unlimited software for quantifying the relative proportions of the two donor populations: ␣1 with a slow⌻1 lifetime
(42, 58). In addition, we provided the first evidence that EBNA-1
and EBP2 interacted in human living cells both in the nucleolus
and in the nucleoplasm.
EBNA-1 and EBP2 do not interact during mitosis. Since we
previously demonstrated by FRET that EBP2 interacted with
EBNA-1 during interphase, we wondered whether this interaction
was conserved upon mitosis. This question is of the utmost
im-portance since EBP2 is currently considered as a docking protein
for EBNA-1 onto chromosomes during mitosis.
Figure 4 shows that the fluorescence decay of GFP-EBP2 in an
ROI defined around mitotic chromosomes (Fig. 4A) was identical
in the absence (green curve drawn from tdFLIM image a) and in
the presence of DsRed–EBNA-1 (red curves drawn from tdFLIM
image b). In both cases, we measured undistinguishable
monoex-ponential decays with a unique fluorescence lifetime T1 of 2.47 ns,
indicating that FRET did not occur between GFP-EBP2 and
DsRed–EBNA-1. This result was confirmed on 12 mitotic cells.
Therefore, EBNA-1 and EBP2 did not interact during mitosis in
living cells, whereas they efficiently interacted during interphase
and colocalized at least in part on mitotic chromosomes in living
cells.
These results strongly contrasted with previous findings of Wu
et al. and others (26, 42, 67, 68). Such discrepancies might result at
least in part from technical differences. In contrast to previous
studies, colocalization and subsequent interactions between
EBNA-1 and EBP2 were analyzed in the context of living mitotic
cells in the absence of any drug promoting cell cycle arrest. We
hypothesized that such drugs, e.g., demecholcine, could modify
EBP2 or EBNA-1 localization and therefore promote artifactual
interactions between these proteins. Indeed, demecholcine
in-duces a metaphase block by preventing the assembly of spindle
fibers during mitosis. To test this assumption, mono- and
double-transfected HeLa cells were treated with demecholcine and
ana-lyzed by video microscopy and tdFLIM as described previously. As
illustrated in Fig. 5, EBNA-1 concentrated in the close vicinity of
the equatorial chromosome plate in demecholcine-treated cells.
Strikingly, EBP2 colocalization with EBNA-1 markedly increased
on chromosomes in these cells. Whereas 11%
⫾ 2.1% of the EBP2
colocalized with EBNA-1 in untreated cells (Fig. 2), this
propor-tion rose to 20.7%
⫾ 2.2% in demecholcine-arrested cells (Fig.
5A). Importantly, a significant FRET was detected in
demechol-cine-treated cells, and we estimated that 33% of the GFP-EBP2
interacted with DsRed–EBNA-1 in this condition (Fig. 5B).
Therefore, we concluded from these experiments that
demechol-cine promoted EBP2 mislocalization, which in turn favored the
subsequent interaction of EBP2 with EBNA-1.
EBNA-1 and EBP2 interaction cannot be observed even in
the presence of oriP. Another major difference between our
ex-periments and previous studies in which EBP2 was claimed to
mediate the tethering of EBNA-1 to chromosomes (26, 42, 67, 68)
was the absence of a plasmid containing oriP. Indeed, EBNA-1
binds not only to cellular chromatin and chromosomes but also to
oriP during the cell cycle (12). Even though oriP and cellular
chro-matin binding involve two different regions of EBNA-1, its
C-ter-minal and N-terC-ter-minal parts, respectively, one may suggest that the
binding of EBNA-1 to oriP promotes EBNA-1 interaction with
EBP2 during mitosis. To address this question, we constructed an
oriP plasmid that could encode for DsRed-EBP2. In this way it was
possible to evaluate FRET in cells containing different ratios of
EBNA-1 over oriP by modulating the relative ratios of GFP–
EBNA-1/DsRed-EBP2-oriP plasmids from 2 to 0.5. Since identical
results were obtained in all tested conditions, we only present here
data obtained for a 1:1 plasmid ratio, which corresponded to the
experimental conditions used in previous works that investigated
FIG 4 FRET measurement between EBP2 and EBNA-1 during mitosis in living cells. tdFLIM-FRET measurements were carried out by acquiring fluorescence
decay images of the GFP donor (515 nm⬍ ⬎ 560 nm) in mitotic HeLa cells expressing GFP-EBP2 alone (images a, and green curves) or in the presence of
DsRed–EBNA-1 (images b, and red curves). (A) The tdFLIM images were obtained by analyzing the fluorescence decays with a single lifetime pixel by pixel and are displayed as fluorescence lifetime pseudocolor maps. A lifetime colored scale is presented. (B) The ROI corresponding to mitotic chromosomes has been manually drawn from tdFLIM images. (C) The decays of GFP-EBP2 in the presence of DsRed–EBNA-1 (condition b or red curves) were compared to the control decays of GFP-EBP2 alone (condition a or green curves) in each ROI. (D) The experimental curves were further fitted with a biexponential function for
quantifying the proportion of two donor populations: ␣1 with a slow⌻1 lifetime corresponding to the unbound donor and ␣2 with a fast T2 lifetime
EBNA-1 binding to EBP2 in the presence of oriP (26, 42, 67, 68).
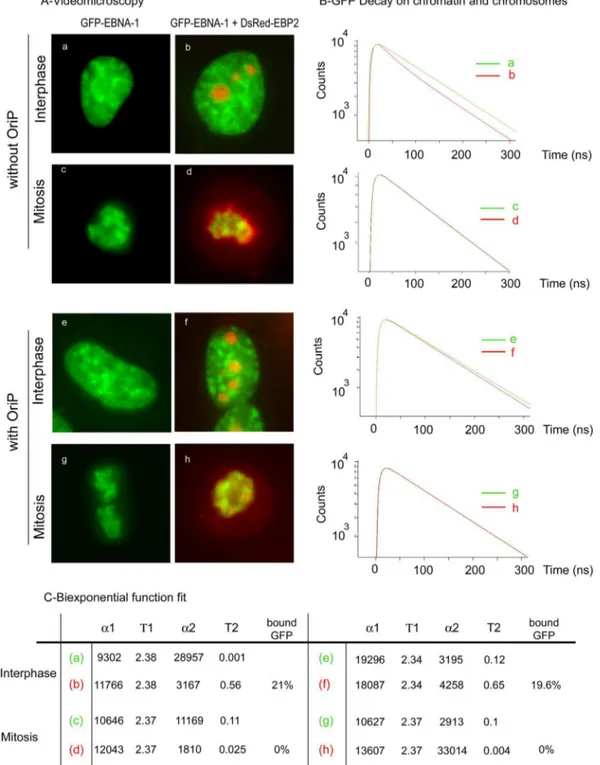
We first examined the localization of EBNA-1 and EBP2 in
interphase and mitosis by video microscopy. As seen in Fig. 6A,
GFP–EBNA-1 and DsRed-EBP2 staining patterns were
indis-tinguishable with (e to h) or without (a to d) the presence of
oriP. Interactions between GFP–EBNA-1 and DsRed-EBP2
were analyzed by FRET in the absence or presence of oriP.
During interphase, GFP–EBNA-1 fluorescence decay was
sig-nificantly faster in the presence of DsRed—EBP2 on the
chro-matin (see red curves corresponding to panels b and f)
inde-pendently of the presence of oriP. The same results were
obtained in nucleoli (data not shown). During mitosis, the
presence of oriP did not significantly increase EBNA-1
interac-tion with EBP2 since no FRET could be detected in the
chro-mosome region. Therefore, we concluded from these
experi-ments that the presence of oriP plasmids did not significantly
increase the association of EBNA-1 with EBP2, as detected by
FLIM-FRET, either during interphase or during mitosis.
EBNA-1 interacts with HMGB2 on chromatin during
inter-phase and mitosis. The exact nature and time course of EBNA-1
interaction with cellular chromatin is still highly debated. Since
EBP2 did not form detectable complexes with EBNA-1 during
mitosis, we wondered whether other cellular proteins might
inter-act with EBNA-1 on mitotic chromosomes. To address this
ques-tion, we performed a yeast two-hybrid assay using a truncation
mutant covering aa 8 to 410 (⌬95-314) as a bait. This truncated
form of EBNA-1 lacked the Gly-Arg central repeats, as well as the
C-terminal DNA-binding domain, but it encompassed the three
known chromosome-binding sites of EBNA-1. Importantly, this
truncated form has previously been shown to colocalize with
chromatin during interphase and mitosis similarly to wild-type
EBNA-1 (36). A total of 75 independent clones encoding 35
dif-ferent proteins were identified. Ten of these encoded known
part-ners of EBNA-1, including SF2/P32/TAP (66) and EBP-2. We
fo-cused on new putative interactors that were known to interact
with cellular chromatin. One of them was HMGB2, an abundant
FIG 5 Demecholcine induces artifactual interaction between EBNA-1 and EBP2. (A) HeLa cells coexpressing GFP-EBP2 and DsRed–EBNA-1 were blocked in
metaphase by demecholcine (10 g/ml) and observed by video microscopy as indicated. The images represent deconvoluted optical z-sections. Colocalized pixels
(in white) from the merge images were quantified by using ImageJ software. The error corresponds to the standard deviation (n⫽ 4). Scale bars, 10 m. (B)
tdFLIM measurements were carried out as described in the legend of Fig. 3. (I) Lifetime images were obtained by analyzing the fluorescence decays with a single lifetime pixel by pixel and are displayed as fluorescence lifetime pseudocolor maps. A colored lifetime scale is presented. (II) ROI corresponding to chromosomes have been manually defined from tdFLIM images. (III) In each ROI, the decays of GFP-EBP2 were measured in the absence (condition a or green curves) and in the presence of DsRed–EBNA-1 (condition b or red curves). (IV) The experimental curves were further fitted with a biexponential function using Globals
Unlimited software in order to quantify the proportion of two donor populations: ␣1 with a slow⌻1 lifetime corresponding to the unbound donor and ␣2 with
and conserved component of the chromatin that is endowed with
architectural activities (60). Importantly, HMGB2 has been
pre-viously shown to associate with chromosomes during interphase
and mitosis (46). As illustrated in Fig. 7, GFP-HMGB2 and
DsRed–EBNA-1 colocalized almost perfectly in living cells during
interphase and throughout mitosis. Similar observations were
made in cells coexpressing DsRed-HMGB2 and GFP–EBNA-1
(data not shown).
FIG 6 oriP does not promote interaction between EBNA-1 and EBP2. (A) HeLa cells expressing GFP–EBNA-1 or coexpressing GFP–EBNA-1 and DsRed-EBP2
with or without oriP were observed by video microscopy as indicated. (B) tdFLIM measurements were carried out using scanning confocal time-resolved microscope by acquiring fluorescence decay images for GFP fluorescence, on six different points of HeLa cells transfected with GFP–EBNA-1 alone (green curves a, c, e, and g) or in the presence of DsRed-EBP2 without oriP (red curves b and d) or with oriP (red curves f and h). (C) The experimental curves were further fitted
with a biexponential function using Symphotime software in order to quantify the proportion of two donor populations: ␣1 with a slow⌻1 lifetime
In order to confirm that EBNA-1 effectively interacts with
HMGB2 in living human cells, we performed a FRET analysis as
described previously. FRET was assessed with the eight possible
pairs obtained when combining the four different donors
(GFP-HMGB2, HMGB2-GFP, GFP–EBNA-1, EBNA-1–GFP) with the
four acceptors (DsRed–EBNA-1, EBNA-1–DsRed,
DsRed-HMGB2, HMGB2-DsRed). Whatever the relative positions of the
fluorophore in the fusions proteins, a significant FRET was
ob-served when HMGB2 was fused to DsRed and EBNA-1 to GFP
(Fig. 8). We could evaluate that an average of 31% of the GFP–
EBNA-1 interacted with DsRed-HMGB2 during interphase. This
proportion increased up to 68% on mitotic chromosomes (Fig. 9).
In contrast, no FRET could be detected when tdFLIM analysis was
performed in the nucleoplasm of mitotic cells (Fig. 9).
The absence of FRET when HMGB2 was fused to GFP and
EBNA-1 was fused to DsRed, whatever their position, may be
explained by parameters that reduce FRET efficiency, such as
an excessive distance between the fluorophores and/or
fluoro-phore dipoles that do not align even when fusion proteins are
in close interaction. To substantiate this hypothesis, we used
fluorescence recovery after photobleaching (FRAP) to measure
the mobility of HMGB2-GFP in the presence or in the absence
of DsRed–EBNA-1. Preliminary experiments indicated that
HMGB2-GFP was extremely mobile in living cells, whereas
EBNA-1 was stably bound onto chromatin (data not shown).
Therefore, HMGB2 mobility was expected to decrease in cells
coexpressing EBNA-1 only if both proteins formed a complex.
The results of FRAP experiments are depicted in Fig. 10. As
expected, EBNA-1–DsRed markedly decreased HMGB2-GFP
mobility in mitotic and interphase cells, confirming that
HMGB2-GFP and EBNA-1–DsRed interaction occurred in the
absence of FRET. These experiments demonstrated that
EBNA-1 increased HMGB2 residence time on mitotic
chroma-tin, where they are in close interaction.
To determine the level of specificity of EBNA-1 interaction
with HMGB2, we investigated the possible interaction of EBNA-1
with HMGB1, a highly abundant variant of HMGB that is nearly
80% identical to HMGB2 (60). As illustrated in Fig. 11, no FRET
could be detected in living HeLa cells coexpressing
DsRed-HMGB1 and GFP–EBNA-1 in interphase or in mitosis. Similar
results were obtained in cells coexpressing EBNA-1 and HMGB1
fused to GFP or DsRed at their N- or C-terminal extremities (data
not shown). Taken together, the results of these experiments
es-tablished that HMGB2 and EBNA-1 interacted in a highly specific
manner both during interphase and mitosis, notably on mitotic
chromosomes.
FIG 7 Dynamic localization of EBNA-1 and HMGB2 throughout the cell
cycle. Living HeLa cells coexpressing GFP-HMGB2 and DsRed–EBNA-1 were observed during interphase (a to c) and throughout mitosis (d to l) by video microscopy. All images are deconvoluted z-optical sections. Colocalizing pix-els (in white) from the merge images were quantified using ImageJ software.
The error corresponds to the standard deviation (n⫽ 4). Scale bars, 10 m.
FIG 8 HMGB2 and EBNA-1 interact during interphase in living cells. tdFLIM-FRET measurements were carried out by acquiring fluorescence decay images of
the GFP donor (515 nm⬍ ⬎ 560 nm) in mitotic HeLa cells expressing GFP–EBNA-1 alone (images a and green curves) or in the presence of DsRed-HMGB2
(images b and red curves). (A) The tdFLIM images were obtained by analyzing the fluorescence decays with a single lifetime pixel-by-pixel and are displayed as fluorescence lifetime pseudocolor maps. A lifetime colored scale is presented. (B) ROIs corresponding to the nucleus have been manually drawn from tdFLIM images. (C) In each ROI, the decays of GFP–EBNA-1 in the presence of DsRed-HMGB2 (condition b or red curves) were compared to the control decays of GFP–EBNA-1 alone (condition a or green curves). (D) The experimental curves were further fitted with a biexponential function using Globals Unlimited
software for quantifying the proportion of two donor populations: ␣1 with a slow⌻1 lifetime corresponding to the unbound donor and ␣2 with a fast T2 lifetime
Inhibition of HMGB2 expression affects EBNA-1 stability on
chromatin and chromosomes but has no significant impact on
episome maintenance. Considering that HMGB2 and EBNA-1
specifically interacted during interphase and mitosis, we
won-dered whether HMGB2 contributed to EBNA-1 interaction with
cellular chromatin and/or to the maintenance of viral episomes.
To address this point, we stably silenced HMGB2 expression in
HeLa and Raji cells, a lymphoblastoid cell line that contains an
average of 40 episomes per cell. As shown in Fig. 12A, HMGB2
expression was totally abrogated in both cell lines. In HeLa cells
that did not express HMGB2, EBNA-1–GFP still colocalized with
cellular chromatin both during interphase and mitosis; however,
an additional weak diffuse staining was also observed (Fig. 12B),
suggesting that the absence of HMGB2 might increase EBNA-1
mobility. To address this question, FRAP experiments were
con-ducted on EBNA-1–GFP in HMGB2
⫹and HMGB2
⫺HeLa cells
(Fig. 12C). We first noticed in HMGB2
⫹cells during interphase
that the FRAP recovery curve did not reach the initial level of
fluorescence; only 63% of the bleached EBNA-1 presented a high
turnover on chromatin and contributed to the fluorescence
recov-ery (mobile fraction). Consequently, we deduced that 37% was
immobile. In the absence of HMGB2, the EBNA-1 mobile fraction
increased up to 100%, clearly indicating that HMGB2–EBNA-1
interaction is the determinant stabilizing EBNA-1 on chromatin
during interphase. During mitosis, the fraction of immobile
EBNA-1 was more important (78.3%), indicating that EBNA-1
interaction with chromosomes was more stable during mitosis. As
before, we observed an increased mobility of EBNA-1 in mitotic
HeLa cells that did not express HMGB2. Altogether, these results
indicated that HMGB2 plays a determining role in stabilizing
EBNA-1 binding to chromatin and chromosomes. However, since
the immobile fraction did not totally disappear during mitosis,
additional mechanisms probably contribute to stabilizing
EBNA-1 chromosome binding. We next sought to determine
whether HMGB2 inactivation impacts the maintenance of EBV
episomes. To answer this question, we measured the relative
amounts of viral and cellular genomes in Raji cells in which
HMGB2 was inactivated for 4 weeks. The relative viral load was
analyzed in two independent cell populations that did not express
HMGB2, namely, shHMGB2 (1) and shHMGB2 (2). As shown in
Fig. 12D, inactivating HMGB2 did not abrogate episome
mainte-nance, at least over a short period of time. Instead, we observed a
slight increase in the viral load in Raji cells that did not express
HMGB2; this increase was not statistically significant in this assay.
DISCUSSIONEBP2 is the only EBNA-1-interacting protein identified to date
that has been proposed to mediate EBNA-1 docking onto mitotic
chromosomes (58, 67). This model was initially based on the
ap-parent colocalization of both proteins in demecholcine-arrested
cells (26, 42, 67, 68). In addition, a set of convincing observations
argued for a central role for EBP2 in episome maintenance (26,
58). Although different mechanisms have been proposed to
ex-plain EBNA-1 interaction with mitotic chromosomes, direct
evi-dences for EBP2 being responsible for EBNA-1 docking onto
mi-totic chromosomes were still lacking. Moreover, a possible
interaction of EBNA-1 with interphase chromatin has been much
debated but was still lacking definitive proofs. A recent study
es-tablished that EBP2 redistribution from the nucleolus to the
chro-mosomal peripheral layer occurred at late prophase (42). We
showed here that EBP2 localization during mitosis was not
re-stricted to the periphery of chromosomes. Indeed, EBP2 was also
detected in the interzone of the mitotic spindle and
homoge-neously dispersed within the nucleoplasm. This localization was
highly reminiscent of previous observations made on B23 by Ochs
et al. (45). B23 is one of the most abundant proteins of the
nucle-olus. Similarly to EBP2, B23 has been involved in rRNA processing
and localized in the granular component of the nucleolus during
FIG 9 HMGB2 and EBNA-1 interact throughout mitosis in living cells. tdFLIM-FRET measurements were carried out by acquiring fluorescence decay images
of the GFP donor (515 nm⬍ ⬎ 560 nm) in mitotic HeLa cells transfected with GFP–EBNA-1 alone (images a and green curves) or in the presence of DsRed
acceptor after a cotransfection with DsRed-HMGB2 (images b and red curves). (A) The tdFLIM images were obtained by analyzing the fluorescence decays with a single lifetime pixel by pixel and are displayed as fluorescence lifetime pseudocolor maps. A lifetime colored scale is presented. (B) ROI corresponding to the chromosomes or to the cytoplasm has been manually drawn from tdFLIM images. (C) In each ROI, the decays of GFP–EBNA-1 in the presence of DsRed-HMGB2 (condition b or red and blue curves) were compared to the control decays of GFP–EBNA-1 alone (condition a or green curves). (D) The experimental curves were further fitted with a biexponential function using Globals Unlimited software for quantifying the proportion of two donor populations: ␣1 with a
interphase (7). Interestingly, B23 and some other nucleolar
pro-teins such as the fibrillarin, nucleolin, and Ki-67 are components
of the perichromosomal layer that covers each chromosome from
one telomere to the other and seems to act as a peripheral skeleton
around mitotic chromosomes (17, 56; for a review, see references
20 and 65). Similarities between EBP2 and B23 localization during
mitosis suggest that EBP2 might also be a component of the
perichromosomal layer. This structure might constitute a docking
site, allowing proteins necessary for early nuclear assembly to
seg-regate toward daughter cells equally (65). These observations were
still compatible with EBP2 acting as a molecular bridge between
EBNA-1 and mitotic chromosomes.
In the present study, we demonstrated by FRET that EBNA-1
and EBP2 interacted during interphase in living cells both in the
nucleoplasm and in the nucleoli. However, despite a partial
colo-calization of both proteins during mitosis, no interaction between
EBNA-1 and EBP2 was detected whatever the stage of mitosis.
Importantly, reproducing experimental conditions depicted in
previous experiments that studied EBNA-1–EBP2 binding with
the presence of oriP plasmid, we obtained the same results,
indi-cating that oriP is unlikely to promote EBNA-1 interaction with
EBP2 in living cells. One might argue that FRET could provide
false-negative results. Indeed, the efficiency of energy transfer
de-pends not only on the distance between the donor and acceptor
molecules but also on the relative orientation of their respective
transition dipole moment (15). These factors are therefore
influ-enced by the spatial arrangement of the fusion proteins within the
complex they form. We do not favor this hypothesis for two
rea-sons. First, FRET was observed in interphase but not in mitosis in
cells expressing the same pair of fusion proteins. Second, FRET
between EBP2 and EBNA-1 could be artificially restored by
treat-ing the cells with demecholcine, a drug that induces microtubule
disassembly. Accordingly, demecholcine promoted the
subse-quent relocalization of EBP2 on chromosomes, which confirmed
that EBNA-1–EBP2 interaction was hampered due to the spatial
distribution of the cellular components during mitosis.
This observation strongly contradicted a current model, which
stipulated that EBP2 was an obligate partner of EBNA-1 on
mi-totic chromosomes (26, 42, 67, 68). Other studies have already
underlined some limits of this model. Indeed, a truncated form of
EBNA-1 that lacked the EBP2 binding site (EBNA-1
⌬325-376)
still localized on mitotic chromosomes (54). Sears et al. suggested
that EBNA-1 could bind mitotic chromosomes independently of
EBP2, a process that would involve an AT hook domain contained
in the N-terminal CBS (54). Importantly, other experiments from
our laboratory demonstrated that aa 325 to 376 were somewhat
important for stabilizing EBNA-1 on chromosomes during
mito-sis. FRAP experiments were conducted on EBNA-1 and on a
trun-cated form of EBNA-1 that did not contain EBP2-binding domain
(Fig. 13). During interphase, the
Dfor the fluorescence recovery
was 12.08 s for EBNA-1 and 12-fold shorter (
D⫽ 0.97 s) for the
truncated variant of EBNA-1, a finding in agreement with
EBNA-1 interacting with EBP2 during interphase. In mitotic cells,
the
Dfor EBNA-1–GFP was slightly longer (19.3 s), indicating
that EBNA-1 interaction with chromosomes was more stable than
during interphase, which was further confirmed by additional
ex-periments (see Fig. 12). Although EBNA-1 did not interact with
EBP2 during mitosis, EBP2-binding domain seems to be also
im-portant at that time, since the
Drecovery for the truncated form
of EBNA-1 was 5-fold shorter (5 s). Therefore, two
non-mutually-exclusive hypotheses could be proposed. First, EBP2 might be
re-quired to load EBNA-1 onto chromatin during or at the end of
interphase but would not be required later on. Second, aa 325 to
376 could be involved in another, as-yet-undiscovered interaction
that would be necessary to stably maintain EBNA-1 on
chromo-somes during mitosis. The absence of an interaction between
EBP2 and EBNA-1 during mitosis may not be inconsistent with an
essential role for EBP2 in episome maintenance. Indeed, the
local-ization of EBP2 around mitotic chromosomes and in the
inter-zone of the mitotic spindle suggest a role for EBP2 in chromosome
stabilization and/or in chromatid segregation. This may explain
why oriP-containing plasmids are improperly transmitted in cells
where EBP2 expression has been silenced or when EBP2 was
dis-sociated from chromosomes by Aurora kinase (25). This would
also be compatible with a possible role for EBP2 in chromosome
stability, as suggested by Lee et al. (33).
We report here for the first time that EBP2 and EBNA-1
unex-pectedly interact during interphase mainly within the nucleoli.
EBP2 is a nucleolar protein that is highly conserved in eukaryotes.
FIG 10 FRAP analysis indicates that HMGB2 mobility is reduced in the
pres-ence of EBNA-1. For the upper graph, calculated from 14 cells of a represen-tative experiment, the average fluorescence intensities in the bleached region for GFP-HMGB2 alone (green circles) or GFP-HMGB2 plus DsRed–EBNA-1
(red circles) were measured over time during interphase. The Dvalues are
averages⫾ the standard deviation. Recovery is faster for GFP-HMGB2 alone:
Dof 0.024 s versus 0.03 s in the presence of DsRed–EBNA-1 (Student t test; n
⫽ 14, P ⬍ 0.01). For the lower graph, calculated from 14 cells of a representa-tive experiment, the average fluorescence intensities in the bleached region for GFP-HMGB2 alone (green circles) and GFP-HMGB2 plus DsRed–EBNA-1
(red circles) were measured during mitosis. The Dvalues are averages⫾ the
standard deviation. Recovery is faster for GFP-HMGB2 alone: Dof 0.037 s
versus 0.08 s in the presence of DsRed–EBNA-1 (Student t test; n⫽ 14, P ⬍
Its functions have been associated with the maturation of 25S
rRNA and assembly of 60S ribosomal subunits in S. cerevisiae (64).
EBP2 is likely to contribute to ribosome biogenesis in human as
well, since it was identified in nucleoli from HeLa cells (53). A
direct contribution of EBNA-1 in ribosome biogenesis is therefore
possible, although this has not been formally demonstrated to our
knowledge. The high proportion of EBP2 that is engaged in an
interaction with EBNA-1 in the nucleoli suggests that EBP2–
EBNA-1 interaction is functionally different from what has been
proposed thus far and may be related to some unreported activity
of EBNA-1 in the nucleolus. In the last few years, a growing list of
studies has shown that viruses, expressed nucleolar proteins that
are able to interfere with nucleolus functions, with major
conse-quences on viral replication cycle and/or virus-induced pathology
(for reviews, see references 21 and 22). EBP2 activities have also
been linked to cell growth control and tumorigenesis. Indeed,
EBP2 expression is required for human cell proliferation, but its
overexpression has been associated with an increased expression
FIG 11 No interaction can be detected by FRET between HMGB1 and EBNA-1 during interphase and during mitosis in living cells. tdFLIM-FRET
measure-ments were carried out by acquiring fluorescence decay images of the GFP donor (515 nm⬍ ⬎ 560 nm) in mitotic HeLa cells transfected with GFP–EBNA-1
alone (images a and c and green curves) or in the presence of DsRed-HMGB2 (images b and d and red curves). (A) The tdFLIM images were obtained by analyzing the fluorescence decays with a single lifetime pixel by pixel and are displayed as fluorescence lifetime pseudocolor maps. A lifetime colored scale is presented. (B) ROIs corresponding to the nucleus (images a and b) or to chromosomes (images c and d) have been manually drawn from tdFLIM images. (C) In each ROI, the decays of GFP–EBNA-1 in the presence of DsRed-HMGB1 (condition b during interphase and condition d during mitosis or red curves) were compared to the control decays of GFP–EBNA-1 alone (condition a during interphase and condition c during mitosis or green curves). (D) The experimental curves were further
fitted with a biexponential function using Globals Unlimited software for quantifying the proportion of two donor populations: ␣1 with a slow⌻1 lifetime
of cyclin E1 and subsequent chromosome instability (26, 33).
Whether EBNA-1 modulates such aspect of EBP2 functions
dur-ing interphase merits a careful examination.
Similarly to EBV, other persistent viruses have developed a
mechanism to anchor their episomal genomes to the cellular
chro-mosomes during mitosis. This was notably described for Kaposi’s
sarcoma-associated herpesvirus and papillomaviruses, in which
two proteins—LANA and E2, respectively—act similarly to
FIG 12 HMGB2 stabilizes EBNA-1 interactions with cellular chromatin and chromosomes but does not significantly alter episomes maintenance in Raji cells.
(A) HMGB2 and GAPDH expression was performed on Raji and HeLa cells 3 weeks after transduction with a nontargeting shRNA (NT) or two different shHMGB2 expressing lentiviral vectors. (B) EBNA-1–GFP was transiently expressed in HeLa cells expressing HMGB2 (HMGB2⫹) or not (HMGB2⫺). The cells were observed by confocal fluorescence microscopy during interphase and mitosis. (C) FRAP analyzes of EBNA-1 were also performed on HeLa cells HMGB2⫹ (blue curves) and HMGB2⫺ (red curves). Calculated from nine cells, the average fluorescence intensities in the bleached region were measured for 250 s in interphase and for 15 s at different time points along mitosis to avoid that the movement of chromosomes induces an artifactual fluorescence recovery measure.
The percentages of the mobile fraction in front of each curve are averages⫾ the standard deviation. The differences in mobile fraction values between EBNA-1
in HMGB2⫹ and EBNA-1 in HMGB2⫺ are statistically significant (Mann-Whitney nonparametric U test; n ⫽ 9, P ⬍ 0.05). (D) Raji cells expressing HMGB2 (NT) or not—“shHMGB2 (1)” and “shHMGB2 (2)”—were grown for 3 weeks. Viral and cellular DNA were quantified by quantitative PCR as described in the text. The results are expressed as the relative amount of viral over cellular DNA. The ratio was set to 1 for the original Raji cells (NT).The standard deviation is
EBNA-1 for episome maintenance. However, the nature of
EBNA-1, LANA, and E2 interaction with chromatin is different.
Bovine papillomavirus type 1 (BPV-1) E2 protein is randomly
distributed over all chromosomes as small dots that costain with
the cellular protein Brd4 (6, 37), a cellular protein that is essential
for the maintenance of BPV-1 genomes (72). In contrast, the
hu-man papillomavirus type 8 (HPV8) E2 protein forms large
speck-les on the short arm of acrocentric chromosomes, a region
corre-sponding to nucleolar organizing region (NOR). Whereas almost
all components of nucleoli are dispersed throughout the cell
dur-ing mitosis, components of fibrillar centers (mainly the rRNA
gene and RNA polymerase I complex) remains associated to
chro-mosomes at NORs. The colocalization of HPV8 E2 and NORs is
consistent with its capacity to bind to the rRNA gene and
colocal-ize with the ribosomal transcription factor UBF1 (49). LANA
fused with GFP diffusely paints all chromosomes and directly
binds core histone H2A-H2B (5, 48). As observed in our work and
by others, EBNA-1–GFP associated diffusely with all
chromo-somes independently of the presence of oriP region.
To identify other proteins that could modulate EBNA-1
inter-action with the cellular chromatin, we performed a double-hybrid
screen that identified HMGB2 as a new partner of EBNA-1. A
combination of FRET and FRAP approaches allowed us to
dem-onstrate that HMGB2 and EBNA-1 established a highly specific
interaction both during interphase and mitosis. To our
knowl-edge, this is the first evidence of EBNA-1 interacting directly with
a known chromatin component. HMGB2, as well as its highly
homologous variant HMGB1, binds within the minor groove of
AT-rich B-form DNA with no sequence specificity and increases
the flexibility of the DNA to which they are bound (60). HMGB
may also modulate nucleosome positioning and stability and
therefore influence DNA accessibility (40). Altogether, these
ac-tivities are thought to modulate the local architecture of the
chro-matin and to facilitate the access of many proteins to their target
sequence, including Hox proteins (74), steroid hormone
recep-tors (8), P53 (23, 61), P73 (61), Oct1, Oct2, and Oct3/4 (9, 75), Rel
family transcription factors (2), and others. Importantly, HMGB
interaction with DNA and/or proteins is usually extremely weak
both in vitro and in vivo. In vitro binary or ternary complexes with
DNA are often difficult to detect by conventional double-hydride
or biochemical approaches (2). In living cells, HMGB1 and
HMGB2 interact with chromatin during interphase and mitosis
but this interaction is labile and both proteins are highly mobile in
the nucleus (46). Recent work by Agresti et al. demonstrated that
FIG 13 Contribution of the EBP2 binding site (or CBS2) to the localization and stability of EBNA-1 on chromatin and chromosomes. (A) HeLa cells transfected
with GFP–EBNA-1 or GFP–EBNA-1⌬90-376 were observed by confocal microscopy during interphase and mitosis as described in Materials and Methods. (B) FRAP analysis of GFP–EBNA-1 and GFP–EBNA-1⌬90-376. For the upper graph, calculated from 12 cells of a representative experiment, the average fluorescence
intensities in the bleached region for GFP–EBNA-1 (green circles) and GFP–EBNA-1⌬90-376 (red circles) were measured over time during interphase. The D
values are averages⫾ the standard deviation. Recovery is faster for GFP–EBNA-1⌬90-376 than for GFP–EBNA-1: Dof 0.97 s and 12.08 s, respectively (Student
t test; n⫽ 12, P ⬍ 0.005). For the lower graph, calculated from six cells of a representative experiment, the average fluorescence intensities in the bleached region
for GFP–EBNA-1 (green circles) and GFP–EBNA-1⌬90-376 (red circles) were measured during mitosis. The Dvalues are averages⫾ the standard deviation.