A COMPARATIVE FINANCIAL ANALYSIS OF THE AUTOMOBILE AND PUBLIC TRANSPORTATION IN LONDON
by
Tejus Jitendra Kothari
B.S., Civil and Environmental Engineering Massachusetts Institute of Technology (2006)
Submitted to the Department of Urban Studies and Planning in partial fulfillment of the requirements for the degrees of
Bachelor of Science in Urban Studies and Planning and Master in City Planning
at the
MASSACHUSETTS INSTITUTE OF TECHNOLOGY
June 2007
C 2007 Massachusetts Institute of Technology All Rights Reserved
Author Departnient of' Certified by Department of Accepted by MASSACHUSETTS INSTITUTE OF TECHNOLOGY
JUL 8 2007
Department ofUrban Studies and Planning
May 24, 2007
Profegsor Frank Levy Urban Studies and Planning
Professor Langley Keyes Chair, MCP Committee Urban Studies and Planning
A COMPARATIVE FINANCIAL ANALYSIS OF THE AUTOMOBILE AND PUBLIC TRANSPORTATION IN LONDON
Tejus Jitendra Kothari
Massachusetts Institute of Technology June 2007
ABSTRACT
Automobile systems and public transportation are often organized separately within government structure inhibiting a comparative analysis between the two modes. Further complicating the comparison is that in public transportation systems, not only is infrastructure but vehicles and operators are usually provided by government or contracted private sector partners, while in the automobile system, infrastructure is normally government owned but costs of vehicle ownership and operation and parking are private.
However, these private actions have enormous costs. In total in FY 2004-05 in London, private automobile spending was over 14 times greater than public automobile spending, as public spending on the automobile was about E1.4 billion while private spending on the automobile was about £20.9 billion. For public transportation, public spending was about E2.0 billion while private spending was about E2.3 billion.
On a normalized basis, when not including time costs, the automobile was 3.7 times more expensive than public transportation on a per trip basis, and 2.0 times more expensive on a per passenger-kilometer basis. When including time costs and segmenting trips by travel zone, we found that public transportation enjoys an advantage for all travel zone combinations, with the advantage being the greatest for trips between outer London and inner London and for trips within inner London. At the household level, we estimated that households well-served by public transportation spend 15 to 18 percent less out-of-pocket on transportation than the average London household, although these savings are outweighed by additional time costs.
From our findings in this research, we see significant opportunity for the London region to achieve a more cost-efficient transportation system. First, measures should be pursued to increase the share of variable automobile costs as a percentage of total costs. Policy such as pay-as-you-drive insurance and road pricing or policy inducing greater awareness of parking costs would help shift the burden. Second, public authorities should consider the private expenditures on automobiles and parking, as they are relatively large compared to the public spending on automobiles, when allocating resources between transportation modes.
Thesis Advisor: Frank Levy, Department of Urban Studies and Planning
ACKNOWLEDGMENTS
"Success comes from knowing that you did your best to become the best that you are capable of becoming."- John Wooden
The journey is more important than the end. And this journey through MIT has been an experience I am truly grateful to have had. Many people have made this journey possible, and I have the better part of 543 words to try to write about all of them.
There would be no way I would be here today without my family. My parents provided me with a tremendous upbringing and nurtured in me the foundation that allowed me to become who I am today. My brother and sister were unbelievable role models growing up, teaching me valuable life lessons only the way a sibling can from day one.
MIT is no cakewalk and I have been blessed with an amazing set of friends who not only provided an outlet to have a good time and forget about the impossible problem set due the next day but were also a consistent base of support when the going got tough.
I thank Nigel Wilson for the chance to become involved with transit research. Working with him as an undergraduate researcher exposed me to a fascinating field and provided me with tremendous opportunities later in my MIT career, from the research in this thesis to several internship experiences.
It has been a privilege and honor to work with Fred Salvucci these past two years. Whenever I met with Fred, I went into pure listening mode as I never knew what snippet of wisdom I would get to hear that day. His pragmatic approach combined with his insights into the political process are traits I will always remember and have very much shaped my own thinking.
I have also been blessed with the opportunity to work with Frank Levy this past year. The work in this thesis has greatly benefited from his way of explaining complex concepts in the simplest of terms and of thinking about the right questions to ask.
To Justin Antos, Hazem Zureiqat, Giorgia Favero, Mikel Murga, and Fred: our weekly meetings over the past two years have been an incredible learning experience for me. Learning about your research and having the chance to think aloud about my progress greatly expedited my
process up the learning curve of transit finance. I will truly miss these meetings. Special thanks to Justin who over these past two years always had a willing ear no matter if I wanted to talk about whether I really had a legitimate thesis topic, which I still sometimes question, to what life was like in London.
And about London, many thanks to Shashi Verma, Will Judge, and Simon Fine at Transport for London for welcoming me into their team as an intern in the Fall of 2006. They provided me with a once in a lifetime experience of living in a great city while working on extremely exciting
projects and providing me a base to begin my thesis research.
I have come nowhere close to acknowledging all the people I ought to have acknowledged but space is running out unfortunately. I am very glad and proud of the opportunities I have had these past five years and know that I will always look back at my time at MIT and my time working on transit research with the fondest of memories.
TABLE OF CONTENTS
1. INTRO DUCTIO N...15 1 .1 . O V E R V IE W ... 1 5 1.2. ANALYTICAL TASKS...15 1 .3 . M O TIV A TIO N ... 16 1 .4 . M ET H O D O LO G Y ... 181.4.1. Task 1 - Mobility in Cities Analysis ... ... 18
1.4.2. Task 2 - Modal Comparison ... 19
1.4.3. Task 3 - Geographic Analysis and Time Costs ... 19
1.4.4. Task 4 - Private Costs and Public Transport Accessibility... 19
1.5. OVERVIEW OF CHAPTERS ... 20
2. WHY SHOULD WE CARE ABOUT TRANSPORTATION COSTS?...21
2 .1 . IN T R O D U C TIO N ... 2 1 2.2. W HY SHOULD WE CARE?... . .. . . .. . . .. . . . .. . . .. . . . .. . . . .. . . . .. . . .. . . . .. . . .. . . ..21
2 .2 .1 . O ve rvie w ... ... 2 1 2.2.2. Private Expenditures are Significant ... ... ... 22
2 .2 .3 . T he Incom e Effect...25
2.2.4. Transportation's Complexities ... 28
2 .3 . C O N C LU SIO N ... 2 9 3. M O BILITY IN CITIES ANALYSIS ... 31
3 .1 . IN T R O D U C TIO N ... 3 1 3.2. REVIEW OF PREVIOUS W ORK ... 31
3.3. DATA SELECTION...33
3.4. DATA DESCRIPTION AND OBJECTIVES OF ANALYSIS ... 33
3 .5 . R E S U LT S ... 3 6 3.5.1. Public Transit Mode Share and Transport Costs ... ... 37
3.5.2. Length of Motorways and Transport Costs ... ... ... 38
3.5.3. Public Transit Provision and Transport Costs ... 39
3.5.4. Multiple Variable Analysis ... ... 41
3 .6 . C O N C LU SIO N ... 4 2 4. MODAL TRANSPORT COSTS ... ... 43
4 .1 . IN T R O D U C TIO N ... 4 3 4.2. MONETARY SOURCES...43
4.2.1. Transport for London... 44
4 .2 .2 . A uto m o bile ... 4 6 4.2.3. Funding Summary...59
4.3. TRANSPORT EXPENDITURES ... 60
4.3.1. Transport for London's Public Transport Expenditures ... 60
4.3.2. Automobile Expenditures ... 62
4.3.3. Local vs. Non-Local Spending ... 64
4.4. MODAL USAGE STATISTICS ... 68
4.5. COMPARISON ... 69
4.6. CONCLUSION...70
5. GEOGRAPHIC ANALYSIS AND TIME COSTS... ... 71
5.1. INTRODUCTION ... 71
5.2. M ETHODOLOGY ... 71
5.2.1. Explanation of Terms ... 72
5.2.2. London Area Travel Survey ... ... ... 74
5.2.3. Categorizing Trips ... 76
5.2.4. Limitations to Methodology ... 79
5 .3 . R E S U LT S ... 8 0 5.4. CONCLUSION...86
6. TRAVEL COSTS AND PUBLIC TRANSIT ACCESSBILITY LEVELS...87
6.1. INTRODUCTION ... 87
6.2. LITERATURE REVIEW ... 87
6.3. DESCRIPTION OF PTAL ... 88
6.4. METHODOLOGY ... 90
6.5. RESULTS - HOUSEHOLD ANALYSIS ... 91
6.6. RESULTS - TRIP LEVEL ANALYSIS ... 94
6 .6 .1 . O ve rvie w ... 9 4 6.6.2. W alking Trips ... 95
6.6.3. Travel Costs by PTAL ... 97
6.7. CONCLUSION ... 105
7. RECO M M ENDATIO NS AN D CO NCLUSIO N ... 106
7.1. KEY FINDINGS FROM RESEARCH ... 106
7.2. RECOMMENDATIONS...107
7 .4 . C O N C LU SIO N ... 1 13 APPENDIX A: BIBLIOGRAPHY ... 114
LIST OF TABLES
TABLE 2.1 - COSTS OF PUBLIC AND PRIVATE TRANSPORTATION IN THE GREATER TORONTO AREA IN 1996 ... 2 4
TABLE 2.2 - LONDON HOUSEHOLD EXPENDITURES - Two TRANSPORTATION SCENARIOS...27
TABLE 3.1 - CITIES IN THE MOBILITY IN CITIES DATABASE ... 33
TABLE 3.2 - AVAILABLE MEASURES IN THE MOBILITY IN CITIES DATABASE ... 34
TABLE 3.3 - M OBILITY IN CITIES DATA FROM 1995... 35
TABLE 3.4 - MOBILITY IN CITIES DATA FROM 2001 ... 35
TABLE 3.5 - CHANGES IN MOBILITY IN CITIES DATA BETWEEN 1995 AND 2001 ... 36
TABLE 3.6 - PUBLIC TRANSIT MODE SHARE - REGRESSION RESULTS... 37
TABLE 3.7 - LENGTH OF MOTORWAYS - REGRESSION RESULTS... 39
TABLE 3.8 - PUBLIC TRANSIT PROVISION - REGRESSION RESULTS ... 40
TABLE 3.9 - MULTIPLE VARIABLE REGRESSION RESULTS ... 41
TABLE 4.1 - SUMMARY M ODAL COMPARISON ... 43
TABLE 4.2 - PRIVATE TRANSPORT FOR LONDON MONETARY SOURCES (IN MILLIONS) ... 45
TABLE 4.3 - ROADWAY SPENDING BY LONDON BOROUGHS (IN MILLIONS)...49
TABLE 4.4 - PUBLIC SOURCES OF AUTOMOBILE SPENDING ... 49
TABLE 4.5 - AUTOMOBILE REGISTRATIONS IN LONDON (THOUSANDS), 1996 TO 2005...50
TABLE 4.6 - FIXED AND VARIABLE COSTS FOR PETROL CARS ... 51
TABLE 4.7 - FIXED AND VARIABLE COSTS FOR DIESEL CARS... 52
TABLE 4.8 - UNITED KINGDOM AUTOMOBILE SALES DATA FOR 45 MODELS IN 2005...53
TABLE 4.9 - AUTOMOBILE DISTRIBUTION BY PURCHASE PRICE ... 54
TABLE 4.10 - LONDON'S PARKING SUPPLY ... 55
TABLE 4.11 - TCRP PARKING CONSTRUCTION COST ESTIMATES (1997 DOLLARS)...56
TABLE 4.12 - PARKING OPERATING AND MAINTENANCE COSTS (2002 DOLLARS)...56
TABLE 4.13 - UNITED KINGDOM LAND VALUE - JANUARY 2005 ... 57
TABLE 4.14 - PER SPACE PARKING COST ESTIMATES ... 58
TABLE 4.15 - TOTAL PARKING COSTS (IN MILLIONS) ... 59
TABLE 4.16 - PRIVATE SOURCES OF AUTOMOBILE SPENDING ... 59
TABLE 4.17 - TFL'S FY 2004-05 PUBLIC TRANSPORT OPERATIONAL EXPENDITURES (IN MILLIONS) ... 61
TABLE 4.18 - TFL'S FY 2004-05 PUBLIC TRANSPORT CAPITAL EXPENDITURES (IN MILLIONS)...61
TABLE 4.19 - TFL'S FY 2004-05 AUTOMOBILE-RELATED EXPENDITURES ... 62
TABLE 4.20 - PRIVATE AUTOMOBILE EXPENSES (IN MILLIONS) ... 63
TABLE 4.21 - AUTOMOBILE LOCAL/NON-LOCAL EXPENDITURES (IN MILLIONS) ... 67
TABLE 4.22 - PUBLIC TRANSIT LOCAL/NON-LOCAL EXPENDITURES (IN MILLIONS)...68
TABLE 4.23 - DAILY NUMBER OF JOURNEYS (IN MILLIONS) ... ... 69
TABLE 4.25 - FY 2004-05 MODAL USAGE STATISTICS... 69
TABLE 5.1 - TRANSPORT FOR LONDON FARE TABLE ... 74
TABLE 5.2 - TRAVEL COSTS BY ZONAL COMBINATIONS (SELF-REPORTED PARKING COSTS)... 80
TABLE 5.3 -TRAVEL COSTS BY ZONAL COMBINATIONS (FULL PARKING COSTS)...81
TABLE 5.4 - SELF-REPORTED PARKING COST AS A PERCENTAGE OF FULL PARKING COST ... 81
TABLE 6.1 - PTAL GEOGRAPHIC AND HOUSEHOLD DISTRIBUTION... 89
TABLE 6.2 - DOES HOUSEHOLD OWN AT LEAST ONE VEHICLE?... 92
TABLE 6.3 - REASONS WHY HOUSEHOLDS Do NOT OWN AN AUTOMOBILE ... 93
TABLE 6.4 -AUTOMOBILE OWNERSHIP RATES FOR HOUSEHOLDS THAT OWN AT LEAST ONE CAR...93
TABLE 6.5 - AUTOMOBILE OWNERSHIP RATES FOR ALL HOUSEHOLDS...94
TABLE 6.6 - RELATIVE MODE SHARES INCLUDING WALKING TRIPS... ... ... 96
TABLE 6.7 - TRAVEL COSTS BY PTAL AND TRAVEL MODE ... 98
TABLE 6.8 - PRIVATE TRAVEL COSTS BY PTAL...101
TABLE 6.9 -W EIGHTED PRIVATE NON-TIME TRAVEL COSTS ... 104
LIST OF FIGURES
FIGURE 2.1 - PUBLIC AND PRIVATE TRANSPORTATION 2005 SPENDING IN BOSTON BY MODE...23
FIGURE 2.2 - COMPARING VEHICLE AND PARKING EXPENDITURES IN THE UNITED STATES...25
FIGURE 3.1 - COST OF TRANSPORT TO THE COMMUNITY VS. MODAL SPLIT ... 32
FIGURE 3.2 - PUBLIC TRANSIT MODE SHARE PLOT... 38
FIGURE 3.3 - PER CAPITA CHANGE IN THE LENGTH OF MOTORWAYS PLOT...39
FIGURE 3.4 - PUBLIC TRANSIT PROVISION PLOT ... 40
FIGURE 3.5 - MULTIPLE VARIABLE REGRESSION EQUATION ... 41
FIGURE 4.1 - MAP OF UK HIGHWAY AGENCY'S ROADWAYS ... 46
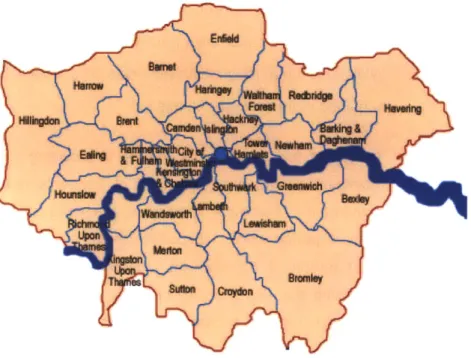
FIGURE 4.2 - M AP OF LONDON BOROUGHS ... 48
FIGURE 4.3 - CALCULATING PRIVATE VEHICLE EXPENDITURES... 54
FIGURE 4.4 - MODAL SPENDING BY PUBLIC AND PRIVATE ACTORS IN FY 2004-05 ... 60
FIGURE 5.1 - AUTOMOBILE TRAVEL COST FORMULA... 72
FIGURE 5.2 - PUBLIC TRANSIT TRAVEL COST FORMULA ... 72
FIGURE 5.3 - LONDON TRAVEL ZONE M AP...77
FIGURE 5.4 - AUTOMOBILE TRIP DISTRIBUTION ... 78
FIGURE 5.5 - PUBLIC TRANSPORTATION TRIP DISTRIBUTION ... 78
FIGURE 5.6 - COSTS PER TRIP (SELF-REPORTED PARKING COSTS)...82
FIGURE 5.7 - COSTS PER KILOMETER (SELF-REPORTED PARKING COSTS)...82
FIGURE 5.8 - COSTS PER TRIP (FULL PARKING COSTS)... 83
FIGURE 5.9 - COSTS PER KILOMETER (FULL PARKING COSTS) ... 83
FIGURE 5.10 - TIME COSTS AS A PERCENT OF TOTAL TRAVEL COSTS...84
FIGURE 5.11 - PRIVATE NON-TIME COSTS AS A PERCENT OF TOTAL TRAVEL COSTS...85
FIGURE 5.12 - RELATIVE MODE SHARES BY ZONAL COMBINATION ... 86
FIGURE 6.1 - PTAL GEOGRAPHIC AND HOUSEHOLD DISTRIBUTION ... 90
FIGURE 6.2 - LINKING PTA L W ITH LATS ... 91
FIGURE 6.3 - DOES HOUSEHOLD OWN AT LEAST ONE VEHICLE?...92
FIGURE 6.4 - AUTOMOBILE TRAVEL COST FORMULA... 95
FIGURE 6.5 - PUBLIC TRANSIT TRAVEL COST FORMULA ... 95
FIGURE 6.6 - RELATIVE MODE SHARES INCLUDING WALKING TRIPS... ... 97
FIGURE 6.7 - TRAVEL COSTS PER KM BY PTAL... 99
FIGURE 6.8 - AVERAGE TRIP LENGTHS BY PTAL ... ... ... 99
FIGURE 6.9 - TRAVEL COSTS PER TRIP BY PTAL ... ... . ... ... 100
FIGURE 6.10 - RELATIVE M ODE SHARES BY PTAL ... 100
FIGURE 6.11 - PRIVATE NON-TIME COSTS PER KM BY PTAL ... 102
FIGURE 6.12 - PRIVATE NON-TIME COSTS PER TRIP BY PTAL ... 102
1.
INTRODUCTION
1.1. OVERVIEW
The purpose of this research is to financially compare the private automobile system and the public transportation system (only services provided by Transport for London) in
London, United Kingdom in the Fiscal Year 2004-05 (April 1, 2004 to March 31, 2005). Expenditures borne by both public and private actors are included in the scope of the research to account for all costs. In addition to a financial comparison of the automobile and public transportation in London, we explore transport cost patterns in 20 prominent cities across the world, estimate local and non-local spending for each mode, analyze travel costs by the geographic distribution of trips (including time costs), and investigate the relationship between travel costs and public transport accessibility levels. From these tasks, our hope is that we can assess how London can achieve a more cost-efficient transportation system. While findings from this research are most applicable to the London region, metropolitan areas of a similar scale can also learn from them.
In this chapter, we will describe the specific analytical tasks of the research, briefly discuss the motivation underpinning the research, provide a snapshot of the methodology behind each task, and present the overall structure of the thesis.
1.2. ANALYTICAL TASKS
In order to assess how London can achieve a more cost-efficient transportation system, the following sub-tasks were developed:
1. Using a database of transport-related measures for 20 cities for the years 1995 and 2001, explore the relationship between changes in passenger transport costs and public transportation capacity and use and automobile capacity;
2. Collect data on all passenger transportation costs, public and private, for FY 2004-05 in order to compare public transportation with the private automobile on a per trip and per kilometer basis - as part of this comparison, we will measure the relative share of passenger transport costs for each mode that stay within the London economy;
3. Building off the aggregate comparison in Task 2, investigate how each mode compares for different types of geographic trips (e.g. within inner London, between inner London and outer London, and within outer London) while including travel time costs; and
4. Analyze the relationship between private household transportation costs and public transit accessibility levels.
Combined, these tasks will allow us to financially compare the automobile and public transportation and identify opportunities for the London region to realize a more cost-efficient transportation system.
1.3. MOTIVATION
Automobile systems and public transportation are often organized separately within government structure. While this may be beneficial in terms of specialized knowledge, it inhibits a comparative analysis between the two modes. Further complicating the comparison is the fact that in public transportation systems, not only is infrastructure but vehicles and operators are usually provided by government or contracted private sector partners, while in the automobile system, infrastructure is normally government owned but costs of vehicle ownership and operation and parking are private.
However, these private actions have enormous costs which are a direct result of modal choice. An analysis of expenditures in the Boston, MA region showed that these private expenses on automobiles outweighed public expenditures on infrastructure by a factor of 14.1 A similar piece of work for the Toronto, Canada region determined a ratio of 12 dollars of private spending for every public dollar spent on the automobile system.2 An
analysis of expenditures spent on parking infrastructure in the United States estimated that parking-related expenditures are three times as large as total expenditures on public roads and more than half as large as total expenditures on private vehicles.3 Clearly
1 Kothari, and Antos, "Public and Private Transportation costs in Boston, MA."
2 Kennedy, "A comparison of the sustainability of public and private transportation systems."
these private automobile and parking costs are significant and must be considered when financially comparing transportation modes.
Existing literature examining public transportation and the private automobile system lacks in accurately financially comparing both modes. Literature has tended to focus more on the modal decisions of individuals between public transportation and the automobile and less on what mode exhibits greater financial efficiency when including private expenditures. In the cases where overall efficiency is assessed, the literature tends to focus on a particular project or omits all or certain private expenditures and consequently provides an incomplete picture.
Given the compartmentalized governance structure that often exists between public transportation and the automobile system, there is limited need at first glance to determine each mode's financially efficiency. Furthermore, while at the national level in the United Kingdom decisions are made allocating funding between the two modes, a comparative analysis has limited appeal given that the results of such an analysis would
likely differ from city to city.
However, for a single metropolitan area, a comparative analysis would yield credible evidence as to what the financial efficiency of a mode is relative to another mode. Results could be used to support either decreasing or increasing the level of public spending on a given mode and be used to inform relevant regulatory decisions. That is the aim of this research - compare both at an aggregate level and disaggregate level the financially efficiency of the automobile and public transportation when including public and private costs, understand the relationship between public transport accessibility and travel costs, and determine ways that London can achieve a more financially efficient transportation system.
Why do we believe this research is necessary? In short, because there are many inherent features of the automobile and public transportation systems that decrease the likelihood that London, or any metropolitan area, is already at a financially efficient allocation level. In the automobile system, private actors pay for the vehicles and their
usage as well as absorb the majority of parking costs. Equivalent costs on the public transportation system - the vehicles and their operation and stations - are not the responsibility of the private sector but rather the public sector. Because different actors -public actors, private businesses, and private individuals - do not pay for the equivalent costs for each mode, the possibility of misallocation by both public and private actors is strong. In addition, many aspects of a transportation system have a significant fixed cost component to them which in turn distorts marginal decisions. For example, an individual who already owns an automobile has already paid the majority of the automobile's cost whether it is used or not and thus that individual is biased on the margin to use the automobile. Furthermore, because public involvement is needed for each mode, many political complexities could exist that would decrease the likelihood of an efficient allocation. All combined, these traits of transportation mean that there is a low probability that a given metropolitan area is minimizing its transportation costs. For additional detail on why we believe this research is necessary, please refer to Chapter 2.
1.4. METHODOLOGY
The following section describes the methodology undertaken to perform the necessary analysis for each task.
1.4.1. Task 1 - Mobility in Cities Analysis
The Mobility of Cities database and its predecessors contain a wealth of transport and urban related data for many of the world's largest urban areas. After a thorough analysis of data quality of all years of data (1960, 1970, 1980, 1990, 1995, 2001), we determined that reliable and consistent data exists for approximately 20 cities (mostly Western European) in the years 1995 and 2001. This set of data will form the backbone of completing Task 1.
By analyzing this time-series panel database, we can identify useful patterns relating transport investment decisions and modal use with overall transport costs in these 20 cities from 1995 and 2001. Through this analysis of macro-level data across a range of
cities, we hope to strengthen the basis for digging deeper into one city's transportation costs.
1.4.2. Task 2 - Modal Comparison
This task digs deeper into London's transportation costs. First, for both the automobile and public transportation, we will gather all relevant cost data and walk through each expenditure's data source(s) and assumptions. Second, we will collect modal usage statistics to allow for a normalized comparison on a trip and distance basis. And lastly, we will compare local spending for each mode by using estimates from existing literature and applying them to London's expenditures.
1.4.3. Task 3 - Geographic Analysis and Time Costs
The London Area Travel Survey (LATS) provides sample data of trips on a typical weekday in London. Respondents to the LATS complete a travel log and include information on the mode used, travel time, parking costs, the origin and destination, and etc. Using this trip-specific data, we will investigate possible ways to segment trips geographically and compare the automobile and public transportation at a disaggregate level. In addition, because we have a reported travel time for each trip, we can include travel time costs in our comparison. By breaking down the comparison geographically and including time costs, we will produce a more accurate and fine-grained comparison
between the automobile and public transportation.
1.4.4. Task 4 - Private Costs and Public Transport Accessibility
Two different data sources - the London Area Travel Survey (LATS) and the Public Transport Accessibility Level (PTAL) Index - will be used to measure the effect of public transport accessibility on private transportation expenditures. A cost function using findings from Task 2 will be built for each trip in the LATS and these costs will then be tested against the PTAL Index, which serves as a measure to the availability of public transport in a given area.
1.5. OVERVIEW OF CHAPTERS
This thesis is divided into the following seven chapters:
1. Introduction - The introduction will explain the overall research focus, the sub-tasks of the research, the motivations behind the research, the methodological approaches behind the research, and the structure of the thesis.
2. Motivation and Literature Review - In this chapter, we will present why the analysis in this thesis is necessary by presenting the features inherent in the passenger transportation market which complicates the allocation decision between both modes by both public actors and private actors.
3. Mobility in Cities Analysis - In this chapter, we will analyze the relationship in 20 cities of how transport costs changed from 1995 to 2001 with how the capacity and use changed of both the automobile system and the public transportation system.
4. Modal Transport Costs - In this chapter, we will collect data on all expenditures for both the automobile and public transportation in London in FY 2004-05. For each expenditure, we will explain the data source(s) and methodology used to determine the magnitude of the expenditures. We will also collect modal usage statistics so that we can financially compare each mode on a per trip and per kilometer basis. We will also estimate the share of expenditures for each mode that stay within the
local economy.
5. Geographic Distribution and Time Costs - In this chapter, we will build off the aggregate cost data from the previous chapter and incorporate actual trip data to compare the automobile and public transportation at a disaggregate level. Time costs will be included in this analysis.
6. Travel Costs and Public Transport Accessibility Levels - In this chapter, we will examine the relationship between private transportation costs and public transport accessibility levels.
7. Recommendations - In this chapter, we will summarize our findings, propose how London can achieve a more cost-efficient transportation system, and suggest areas of future research.
The thesis also contains two appendices: a bibliography (Appendix A) and a list of acronyms (Appendix B).
2.
WHY SHOULD WE CARE ABOUT TRANSPORTATION COSTS?
2.1. INTRODUCTION
In this chapter, our main objective is to establish why we should care about the research in thesis. First, we will develop a basis of why it is important to include both public and private expenditures when comparing transportation modes; and second, we will describe characteristics of passenger transportation that make it highly unlikely for a city or region to naturally achieve a cost-efficient modal allocation.
2.2. WHY SHOULD WE CARE?
2.2.1. Overview
According to the Bureau of Transportation Statistics, the ultimate objective of most travel is access, the ability to obtain desired goods and activities.4 In other words,
transportation is not an end in itself - people travel because they derive more utility from the opportunity at the end of the trip than the disutility they face in travel costs. This implies that we as a society should try to meet our transportation needs through the most efficient combination of modes. Strictly speaking, transportation's cost (or disutility) should be minimized while still serving society's mobility needs. But what does this mean in a metropolitan area such as London? What costs should we include when comparing transportation modes? How do transportation modes compare in aggregate? How do transportation modes compare in disaggregate? Are there opportunities to achieve a more cost-efficient transportation system? These questions, from the viewpoint of a government unit with an eye over London, are the focus of our research.
Central to answering these questions is ensuring that private expenditures in addition to public expenditures are included in any comparison study. Why should a unit of government concern itself with private expenditures? If a given amount of public spending leverages a high level of private spending to meet an objective, is that not a
better outcome from a public perspective than an alterative where a higher amount of public spending leverages a lower level of private spending to meet that same objective? In this chapter, I argue that the answer to that question is not necessarily yes in the context of passenger transportation.
Let's say we assume private expenditures do matter, what evidence is there that each transportation mode is not already at a cost-efficient level? In other words, what makes comparing transportation modes different than most other goods and services? Why is transportation different in the sense that a reasonably optimal combination of modes might not already exist?
The remaining portion of this chapter attempts to address these two issues - why private expenditures matter and what makes passenger transportation complex. Through looking at previous studies and exploring the income effect, we will establish a rationale for including private expenditures. In addition, by illustrating that transportation is complex along the following dimensions - public versus private spending, fixed versus variable spending, and political complications - we will show that there are differences in the passenger transportation market that do not pertain for many goods and services and consequently, there are likely to be opportunities to realize a more cost-efficient transportation system.
2.2.2. Private Expenditures are Significant
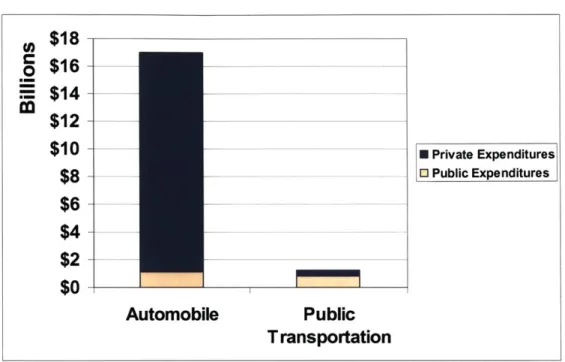
In order to quickly determine the relative magnitude of private automobile expenditures against public automobile and public transportation expenditures, a fellow student and I conducted an analysis of transportation spending in the Boston, MA region in 2005. We determined the ratio of private spending on the automobile outweighed public spending by a factor of over 14 while on the public transportation side, public spending outweighed private spending by a ratio of about 2.3.5 This drastic difference provides evidence that a modal comparison that neglects private expenditures would be heavily biased to favor
the automobile. Figure 2.1 illustrates transportation expenditures by both public and private actors in Boston in 2005.
Figure 2.1 - Public and Private Transportation 2005 Spending in Boston by Mode
$18 -$16 - $14-$12 -$10 -$8 -$6 - $4-$2 -$0 - I I * Private Expenditures o Public Expenditures
'
I
AutomobilePublic
Transportation
While the work on Boston provided evidence that both public and private expenditures need to be included when comparing transportation modes, the work was limited as it did not relate cost data with output. A cost per passenger-mile and a cost per trip were not computed as part of the analysis. Furthermore, given the quick nature of the work, several assumptions about public spending on the automobile were made.
A 2003 report on transport expenditures in the Pans region provided numbers of similar magnitude, as private automobile expenditures outweighed public automobile expenditures by a ratio of over 13.6 In total, E23.8 billion was spent on the automobile, 93 percent of which was spent by private individuals while the remaining seven percent was spent by public authorities. On the public transport side, E6.8 billion was spent, 68 percent of which was spent by private individuals while the remaining 32 percent was spent by public authorities. On a per-kilometer distance basis, public transport was
calculated to be 34% cheaper than the automobile in the Paris region. These numbers are consistent with numbers presented for London in Chapter 4.
Kennedy in his 1991 and 1996 studies compared the sustainability of public and private transportation systems in the Greater Toronto Area (GTA).7 Defining transportation as a
product, a driver, and a cost, he assessed the automobile and public transportation on economic, environmental, and social dimensions from the perspective of the region as an economic unit. Table 2.1 summarizes his results for 1996 in comparing the costs of each mode; the numbers presented in his analysis are consistent with those that are presented for London in Chapter 3.
Table 2.1 - Costs of Public and Private Transportation in the 1996
Greater Toronto Area in
Daily no. of trip Mean ki. Person ki. Total cost S per person trip $ per person-kn (S per day) Auto. driver 5.623,498 9.8 55.253,966 Auto passenger 1,441,814 7.5 10,826,969 Total auto. 7,065,312 66,080,934 36,556,897 S5.17 $0.35 Local transit 1.154.298 8.1 9,345.249 3,309,701 S2.87 $0.35 0 transit 101,054 30.8 3,112,463 756,860 $7.49 $0.24
Total public 1,255,352 12,457,712 4,066,561 S3.24 SO.33
While using a thorough and well-explained methodology, Kennedy's show that public transit costs significantly less than the automobile
person-kilometer basis.
results for the GTA on both a trip and
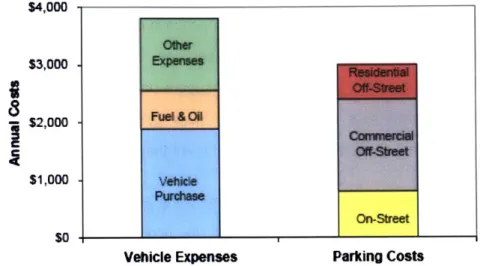
Litman in his analysis of the benefits and costs of parking estimated that parking facility costs totaled more than $500 billion in the United States in 2000.8 He arrived at this estimate by multiplying an amortized cost per parking space for different types parking facilities by the total number of parking spaces for each type of facility. His estimate of $500 billion means that parking expenditures in the United States were more than three
7 Kennedy, "A comparison of the sustainability of public and private transportation systems."
times as large as total public expenditures on roadways and more than half as large as total expenditures on private vehicles. Figure 2.2 illustrates this comparison.
Figure 2.2 - Comparing Vehicle and Parking Expenditures in the United States
$4,000 cOur $3,000 $2,000 $1,000 1Mk On-Street
so~-Vehicle Expenses Parking Costs
In summary, the four pieces of work reviewed here directly analyzed both public and private spending for both the automobile and public transportation. Kennedy's work in Toronto was the most methodologically complete and showed public transportation as more cost-efficient than the automobile, the Pans and Boston work provided evidence that both public and private expenditures need to be included in a modal comparison, while Litman showed that parking expenditures are significant relative to other transportation expenditures. Combined, the work on Boston, Paris, Toronto, and Litman's work on parking costs clearly show that private expenditures are significant large and must be included when financially comparing transportation modes.
2.2.3. The Income Effect
Now that the magnitude of private expenditures has been established, we will extend the logic one step deeper by showing a situation where an increase in public spending on transportation leads to a decrease in private spending for a hypothetical household. The income effect is defined as a change in the demand for a good or service caused by a change in the income of consumers rather than a change in consumer preferences. In the context of transportation, if an individual has to spend more to meet his or her
transportation needs, he or she has fewer monetary resources to spend on other products and services. Conversely, if an individual can spend less to meet his or her transportation needs, he or she has more monetary resources to spend on other products and services. Both scenarios act as income effect, as changes in transportation spending rather than changes in consumer preferences affect the demand the individual has for other goods or services. This logic underpins the argument that a situation in which government spends more on transportation but the private individual than spends less on transportation (less by a greater amount than the increased government spending) is more cost-efficient than the status quo.
Let's imagine a hypothetical scenario using actual spending data from UK Office of National Statistics (ONS) to illustrate the income effect.9 In our example, we have a
household that spends according to average London figures provided in the ONS survey. According to survey results, they spend £25,151 annually and E3,118 on transportation annually. Let's say that a new rail line or a new bus route opens near the household so that they use their automobile less, perhaps even selling an automobile, and rely more on public transportation so that their annual transportation spending drops to £1,500. To finance this new rail line or bus route, let's also say this household was taxed an additional E200. This leaves the household with an extra E1,418 to spend on other products or services that they presumably derive more utility from than transportation. Assuming that the household's spending distribution is equivalent to their original spending, the second column in Table 2.2 reflects their new spending amount in each category in the lower transportation spending scenario. The third column represents the change in spending between the two scenarios.
Table 2.2 - London Household Expenditures - Two Transportation Scenarios
Average grossed number of households (thousands) 2,880
Total number of households in sample (over 3 years) 1,875
Total number of persons in sample (over 3 years) 4,539
Total number of adults in sample (over 3 years) 3,354
Weighted average number of persons per household 2.5
Commodity or service
I Food & non-alcoholic drinks E2,328 E2,478 E150
2 Alcoholic drinks, tobacco & narcotics E558 E593 E36
3 Clothing & footwear E1,385 E1,474 E89
4 Housing (net)', fuel & power E2,995 E3,188 E193
5 Household goods & services E1,715 E1,825 E110
6 Health E277 E295 E18
7 Transport E3,118 E1,500 -£1,618
8 Communication E747 E795 E48
9 Recreation & culture E2,960 E3,150 E190
10 Education E600 E639 E39
11 Restaurants & hotels E2,313 E2,461 E149
12 Miscellaneous goods & services E2,014 E2,144 E130
1-12 All expenditure groups E21,010 E20,543 -E467
13 Other expenditure items E4,141 E4,408 E267
14 Change in Taxes E200 E200
Total expenditure E25,151 E25,151 £0
From Table 2.2, we see that the household increases their spending on other categories by a significant amount. For example, they now spend E150 more on food and non-alcoholic drinks, E193 more on housing, E190 more on recreation and culture, and E149 more on restaurants and hotels. They also save more money than before. This hypothetical example shows how an increase in public spending on public transportation can cause a decrease in private transportation spending and how these private savings are beneficial for the local and national economies.
2.2.4. Transportation's Complexities
If we think of another market with two possible products or services - let's say white and wheat bread - we would be fairly confident that the quantities produced of each were at the right level and that their prices would reflect competitive economic conditions. The
bread market is competitive - bread manufacturers have complete information about the costs to produce either white or wheat bread, they know the demand level from their customers, and they know how customers respond to changes in prices.
The same cannot be said about the passenger transportation market for three primary reasons. First, different actors - governments, businesses, and private individuals - all pay for various aspects of a transportation system. Second, because public resources are needed for both the automobile and public transportation, decisions are often made through the political process, further complicating the ability to achieve a cost-efficient transportation system. And third, because many components of a transportation system are decided on a multi-year basis, the marginal cost to use only reflects a small portion of the system's costs.
Existing studies and work in this thesis show that many actors pay for various aspects of a transportation system. On the automobile side, governments pay for roadway infrastructure and maintenance but private individuals and companies pay an order of magnitude more to purchase and operate vehicles and provide and maintain parking facilities. On the public transportation side, governments pay for nearly everything (although they do collect fare revenue from private individuals). Because we have multiple actors all contributing to a transportation system, it is hard for any one entity to have complete information on a mode's total costs and thus there is a lower probability of a cost-efficient allocation between the automobile and public transportation when compared to the allocation between white and wheat bread.
In addition to involving multiple actors spanning many levels of society, transportation is more complex than bread because there is significant public sector involvement. This involvement necessitates a political process, which may or may not produce efficient outcomes. We can assume though that because a political process is necessary for a
large share of transportation decisions, there is a lower probability of achieving an efficient allocation of transportation modes than there is of bread manufacturers achieving an efficient allocation of white and wheat bread.
Lastly, consumers of transportation, especially automobile users, pay marginal prices that do not come close to reflect actual costs. This occurs, as will be shown in Chapter 4, because over 70 percent of a cost of the vehicle is strictly attributable to ownership and not use, and ownership decisions are typically made on a multi-year basis. Furthermore, because the majority of parking costs are absorbed in construction costs and parking construction decisions are typically made on a multi-decade basis, parking costs are seldom reflected in their marginal prices of use. Moreover, parking is often provided for free to consumers and consequently its costs are absorbed by employers and retailers. Combined, this creates a situation where the marginal price of automobile use reflects less than ten percent of the total cost of the automobile system while the remaining portion of costs are not decided upon for years or even decades.
In summary, significant differences exist between the allocation decision between white and wheat bread and between the automobile and public transportation. In the bread market, bread manufacturers have complete information on the costs and the marginal price of bread reflects these costs and market conditions. In the transportation market, we as a society lack information on total costs and the marginal price of automobile usage only reflects a portion of total costs. Research in this thesis attempts to fulfill the information gap by measuring all transportation costs, regardless of who pays for them.
2.3. CONCLUSION
In this chapter, we argued the importance of including both public and private expenditures when financially comparing transportation modes and why we believe a cost-minimizing allocation of transportation modes is unlikely to already exist in a given city. From this base, we will now move on to our analysis. Before diving into London's transportation costs, we will first review transportation cost data from 20 worldwide cities in Chapter 3 to see if there are patterns between changes in transportation costs and
changes in roadway and public transportation infrastructure and use. In Chapters 4 and 5, we will conduct our comparison between the automobile and public transportation. In Chapter 4, the comparison will be at an aggregate level and include all direct costs. In Chapter 5, the comparison will be at a disaggregate level and include travel time costs in addition to all direct costs. Our analysis will close in Chapter 6, where we will explore the relationship between public transportation accessibility and travel costs. In Chapter 7, we will conclude the thesis by summarizing our key findings and offering recommendations for London to realize a more cost-efficient transportation system and areas for additional research.
3.
MOBILITY IN CITIES ANALYSIS
3.1. INTRODUCTION
The Mobility in Cities Database (MCD) 10 and its predecessors11 contain a wealth of
transportation-related data for many of the world's largest urban areas. By analyzing this time-series panel database, we can identify useful patterns relating transport investment decisions and overall transport costs in these 20 cities from 1995 and 2001. In our analysis, we find the following:
* As public transportation's mode share of mechanized trips increases, the amount spent on passenger transport as a percentage of GDP decreases.
* As the per capita length of motorways increases, the amount spent on passenger transport as a percentage of GDP increases.
* As the per capita amount of public transit service miles increases, the amount spent on passenger transport as a percentage of GDP decreases.
We will first review previous work in this area before describing the methodology employed in our analysis and our results.
3.2. REVIEW OF PREVIOUS WORK
Given the methodological approach I have chosen for this task, there is limited relevant literature aside from the report written by Jean Vivier that was published with the release of the MCD in 2006. Authors, such as Peter Newman and Jeffrey Kenworthy, of precursors of the MCD dataset have also published their findings and are similar in nature to Vivier's work. In its 2001 version, the MCD includes data on 120 transport-related measures for 52 cities. Of these 52 cities, about 20 have consistent data for both
10 "Mobility in Cities Database."
1995 and 2001. In his review of the 2001 data, Vivier identifies several important patterns pertaining to transport costs:
" The cost of transport for the community ranges from five percent in dense cities
with high public transportation use to over 15 percent in sprawling cities where the car is the dominant mode of transportation.
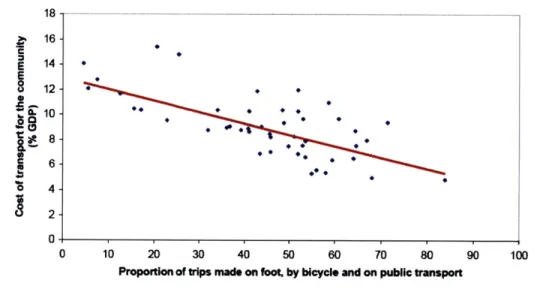
* The overall cost of passenger transport as a percent of GDP for a region decreases as the modal share of non-automobile modes increases. See Figure 3.1 for a visual representation of this relationship.
Figure 3.1 - Cost of Transport to the Community vs. Modal Split
18 -_ 16-E 14- 12-0 0 10 20 30 40 50 60 70 80 90 100
Proportion of trips made on foot, by bicycle and on public transport
* In cities where the GDP per inhabitant is higher than E10,000, the automobile costs the region 1.75 times more than public transit on a per passenger kilometer basis. Public transport's advantage is greater in less affluent cities.
While of great insight, Vivier's work is limited by only having one time-point of data for each city. More relationships can be uncovered with data from multiple time-points as is attempted in this chapter. In addition, the MCD and its precursors suffer from unreliable data, as the database attempts to collect a vast amount of information from many different data sources for over 50 cities - an impossible task to complete perfectly.
Because of a lack of documentation on the methodology of how a measure is calculated for a given metropolitan area, we are unable to assess how accurate certain data-points are.
However, the MCD data and its precursors present a great starting point to build upon. The analysis presented in this chapter builds off the work of MCD authors by using longitudinal data from 1995 and 2001. By having two time-points of data for around 20 cities, the ability to test specific hypothesis is more robust that relying on only one
time-point of data. Instead of focusing on the value of a particular measure we can focus on the change in value of a particular measure and thus control for the initial state.
3.3. DATA SELECTION
Data exists from 1960, 1970, 1980, 1990, 1995, and 2001; however, in most cases data from one year is not comparable to data from another year as both the specific measures captured in a given year and the methodology behind several of the measures are seldom consistent from year to year. Furthermore, geographical boundaries of central business districts, city limits, and metropolitan areas often change from year to year.
After spending much time over the past year working with the MCD data and its predecessors, the only data that we feel is consistent from year to year are for a handful of measures from 1995 and 2001 for about 20 cities. When the 2001 version was released, the MCD authors went back for these 20 cities and reviewed their values from 1995, often times making corrections to the original value to ensure consistency to the 2001 measure.
3.4. DATA DESCRIPTION AND OBJECTIVES OF ANALYSIS The cities included in our analysis are listed in Table 3.1.
Table 3.1 - Cities in the Mobility in Cities Database
Amsterdam Hong Kong
Berlin London Bern Madrid Bologna Manchester Brussels Nantes Chicago Newcastle Copenhagen Oslo Glasgow Paris Graz Stockholm Helsinki Zurich
In our sample, we have one city from North America (Chicago), one city from Asia (Hong Kong), and 18 cities from Europe.
Possible measures to include in our analysis are listed in Table 3.2.
Table 3.2 - Available Measures in the Mobility in Cities Database
Given the objectives of our analysis, four variables have the greatest relevance:
1. Total cost of transport (% GDP)
2. PT market share (mechanized and motorized trips)
3. Length of motorways/inhabitant (KM/million inhabitants) 4. PT vehicle-kilometers/inhabitant
By having data on each of the above variables from 1995 and 2001, we can measure the relationship between the changes of each variable. This allows us to control for 1995 conditions and isolate changes between 1995 and 2001. With the four variables listed above, we can see how total costs changed relative to roadway capacity, public transit capacity, and public transit usage relative to the automobile. We did not include a measure on parking spaces as data was only available for Central Business District parking and parking costs were not included in the Total Cost of Transport (% GDP) measure.
Table 3.3 consists of 1995 values: Population Density Motorization Rate
Number of Parking Spaces/1,000 jobs in the CBD Length of Motorways/In habitant
Length of Reserved Routes/Inhabitant Average PT Operating Speed PT Vehicle x KM/Hectacre PT Vehicle x KM/inhabitant PT Boardings/Inhabitant/Year
PT Market Share (mechanized and motorized trips) PT Farebox Revenue per Boarding
PT Operating Costs per Boarding PT Operating Costs per Vehicle x KM PT Investment per Year and per Inhabitant Total Cost of Transport (% GDP)
Table 3.3 - Mobility in Cities Data from 1995
Table 3.4 consists of 2001 values:
Table 3.4 - Mobility in Cities Data from 2001
Cost of Percentage of Daily Length of Motorways Public Transit Service City Passenger Mechanised Trips by (kilometers per million (vehicle kilometers per
Transport as o Puiblic Transport inhabitants) inhabitant) of GDP
Table 3.5 consists of the changes between 1995 and 2001:
Table 3.5 - Changes in Mobility in Cities Data Between 1995 and 2001
3.5. RESULTS
To meet the objectives listed above, our first step was to run simple single variable regressions in which the percentage change in transport costs as a percent of GDP were regressed on each the remaining three variables. Key findings, all of statistical significance, include:
e For a one percent gain in public transit mode share of mechanized trips,
transport costs as a percent of GDP decreased by 2.72 percent.
* For a one percent increase in the length of motorways per a million inhabitants, transport costs as a percent of GDP increased by 0.44 percent.
* For a one percent increase in the vehicle kilometers of public transit per inhabitant, transport costs as a percent of GDP decreased by 0.76 percent.
After examining the results from the single-variable analysis, a multi-variable model was constructed to improve our understanding of the factors affecting the change in transport
costs. This model included the percentage change in per capita length of motorways and the absolute change in public transit mode share of mechanized trips as independent variables. This analysis produced similar results as above but of stronger statistical significance and in total explained about 68 percent of the variation in the change in transport costs.
The following sections contain greater detail on the results of both the single-variable and multiple-variables regression analyses.
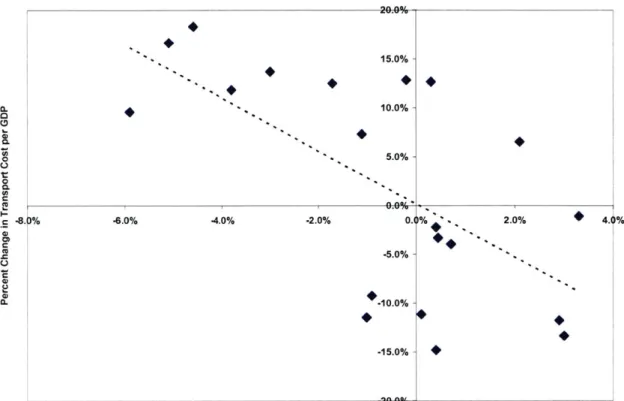
3.5.1. Public Transit Mode Share and Transport Costs
In this analysis, all 20 cities were included. On average, transport costs as a percentage of GDP increased by 2.0 percent while public transit mode share of mechanized trips decreased by 0.7 percent. For every one percent increase in public transit's share of motorized trips, transport costs as a percentage of GDP decreased by 2.72 percent. The standard error of this coefficient is 0.77, resulting in a t-statistic of -3.55. The 95 percent confidence interval on the coefficient is from -1.11 to -4.32.
Table 3.6 shows a summary of the regressions results while Figure 3.2 shows a plot of the two variables for the 20 cities.
Table 3.6 - Public Transit Mode Share - Regression Results
Regression Statistics Multiple R 0.64 R Square 0.41 Adjusted R Square 0.38 Standard Error 0.09 Observations 20.00
Coefficients Standard Error t Stat Lower 95% Upper 95%
Intercept 0.00 0.02 0.07 -0.04 0.04
Figure 3.2 - Public Transit Mode Share Plot 20.0% 15.0% C. 10.0%-0 5.0% -0 -. %-6.0% -4.0% -2.0% 0.11% ',, 2.0% + 4.11% -5.0% CD) a. -10.0% -15.0% - + -20.0%
Change in Percent of Motorized Trips on Public Transit
3.5.2. Length of Motorways and Transport Costs
In this analysis, only 17 cities were included as motorway data for both 1995 and 2001 were not available for Amsterdam, Bologna, and Stockholm. On average, transport costs as a percentage of GDP increased by 2.0 percent while the length of motorways per inhabitant increased by 8.6 percent. For every one percent increase in the per capita length of motorways, transport costs as a percentage of GDP increased by 0.44 percent. The standard error of this coefficient is 0.21, resulting in a t-statistic of 2.08. The 95
percent confidence interval on the coefficient is from -0.01 to 0.89.
Table 3.7 shows a summary of the regressions results while Figure 3.3 shows a plot of the two variables for the 17 cities.
Table 3.7 - Length of Motorways - Regression Results Regression Statistics Multiple R 0.47 R Square 0.22 Adjusted R Square 0.17 Standard Error 0.10 Observations 17.00
Coefficients Standard Error t Stat Lower 95% Upper 95%
Intercept 0.01 0.03 0.21 -0.06 0.07
Motorway Change 0.44 0.21 2.08 -0.01 0.89
Figure 3.3 - Per Capita Change in the Length of Motorways Plot 20.0% ,
15.0%
-104%
-5.0%
-0.% 5.0% 10.0% 15.0% 20.0% 25.0% 30.0% 35.0%
Percent Change in Length of Motorways per Inhabitant
3.5.3. Public Transit Provision and Transport Costs
In this analysis, all 20 cities were included. On average, transport costs as a percentage of GDP increased by 2.0 percent while the amount of public transportation vehicle miles increased by 8.7 percent. For every one percent increase in the per capita length of motorways, transport costs as a percentage of GDP decreased by 0.76 percent. The
a. 0 0 0*0 L. C -SSQ%- '. -5.0% -10.0% I Vm7b , I I
standard error of this coefficient is 0.26, resulting in a t-statistic of -2.97. The 95 percent confidence interval on the coefficient is from -1.30 to -0.22.
Table 3.8 shows a summary of the regressions results while Figure 3.4 shows a plot of the two variables for the 20 cities.
Table 3.8 - Public Transit Provision - Regression Results
Regression Statistics Multiple R 0.57 R Square 0.33 Adjusted R Square 0.29 Standard Error 0.10 Observations 20.00
Coefficients Standard Error t Stat Lower 95% Upper 95%
Intercept 0.09 0.03 2.79 0.02 0.15
PT vehicle-km -0.76 0.26 -2.97 -1.30 -0.22
Figure 3.4 - Public Transit Provision Plot
20.0% . 15.0% -10iY
.
.
5.0%-5.0% 10.0% '15.0% 20.0% 25.0% 30.0% -5.0% --10.0% --15.0%Percent Change in PT Vehicle-KM per Inhabitant
(L 0 0 0 110 (. -10.0% -5.0% I U U" 4
0. %
3.5.4. Multiple Variable Analysis
As discussed in the introduction of this section, in addition to the single-variable regressions, we constructed a model incorporating more than one explanatory variable.
Figure 3.5 depicts the model equation.
Figure 3.5 - Multiple Variable Regression Equation
Change in Transport Costs = 80 + 81*Absolute Change in Public Transit Mode Share +
B2*Percentage Change in Length of Motorways per Inhabitant + p
These two variables were chosen as they have a weak relationship between them (correlation coefficient of -0.14) and they measure different aspects of a passenger transportation system. Changes in public transit mode share were used instead of changes in public transit supply as it more accurately reflects changes in the passenger transportation market. Table 3.9 contains the results of the regression model.
Table 3.9 - Multiple Variable Regression Results Regression Statistics Multiple R 0.83 R Square 0.68 Adjusted R Square 0.64 Standard Error 0.06 Observations 17.00
Coefficients Standard Error t Stat Lower 95% Upper 95%
Intercept 0.00 0.02 -0.21 -0.05 0.04
Change in PT Mode Share -
p1
-2.46 0.55 -4.48 -3.64 -1.28Change in Motorways -P2 0.36 0.14 2.50 0.05 0.66
From our model, we see that for every one percent gain public transit's mode share of mechanized trips, transport costs as a percentage of GDP decrease by 2.46 percent and for every one percent increase in the per capita length of motorways, transport costs as a
percentage of GDP increase by 0.36 percent. As expected the value of these coefficient are smaller in magnitude than the single variable regressions but the statistical significance of each coefficient is stronger in the multiple variable regression. Combined, these two explanatory variables explain around 68 percent of the variation in the change in transport costs as a percentage of GDP.
3.6. CONCLUSION
From our analysis of the MCD data from 1995 and 2001, we identified relationships between the change in transport costs and changes in public transportation and roadway capacity and mode split. We saw a decrease in overall transport costs associated with an increase in public transportation mode share. We saw an increase in overall transport costs associated with an increase in the per capita length of roadways. We saw a decrease in overall transport costs associated with an increase in the per capita supply of public transit.
However, in order to fully understand the driving factors behind changes in transport costs, MCD data is not sufficient by itself. The cost data is only provided at an aggregate level and the methodology behind how each measure was calculated is unclear. In addition, despite the consistency checking process employed by the MCD authors, we cannot be certain that the methodology and geographic definitions were identical in 1995 and 2001. Simply put, we need more fine-grained information on costs for both the automobile and public transit systems. To achieve this, research in this thesis will analyze transport costs in London for FY 2004-05. We will present detailed cost information for each mode and analyze these costs both in aggregate and for different types of trips within London in the ensuing chapters. While we lose the multi-year and multi-city approach of this section, we will gain a deeper understanding of the driving factors behind passenger transport costs.