READ THESE TERMS AND CONDITIONS CAREFULLY BEFORE USING THIS WEBSITE.
https://nrc-publications.canada.ca/eng/copyright
Vous avez des questions? Nous pouvons vous aider. Pour communiquer directement avec un auteur, consultez la première page de la revue dans laquelle son article a été publié afin de trouver ses coordonnées. Si vous n’arrivez pas à les repérer, communiquez avec nous à PublicationsArchive-ArchivesPublications@nrc-cnrc.gc.ca.
Questions? Contact the NRC Publications Archive team at
PublicationsArchive-ArchivesPublications@nrc-cnrc.gc.ca. If you wish to email the authors directly, please see the first page of the publication for their contact information.
NRC Publications Archive
Archives des publications du CNRC
This publication could be one of several versions: author’s original, accepted manuscript or the publisher’s version. / La version de cette publication peut être l’une des suivantes : la version prépublication de l’auteur, la version acceptée du manuscrit ou la version de l’éditeur.
Access and use of this website and the material on it are subject to the Terms and Conditions set forth at
Considering time-dependent factors in the statistical prediction of water main breaks
Kleiner, Y.; Rajani, B. B.
https://publications-cnrc.canada.ca/fra/droits
L’accès à ce site Web et l’utilisation de son contenu sont assujettis aux conditions présentées dans le site LISEZ CES CONDITIONS ATTENTIVEMENT AVANT D’UTILISER CE SITE WEB.
NRC Publications Record / Notice d'Archives des publications de CNRC:
https://nrc-publications.canada.ca/eng/view/object/?id=6b4f32fd-3051-4076-9af3-7478e5fd33b7 https://publications-cnrc.canada.ca/fra/voir/objet/?id=6b4f32fd-3051-4076-9af3-7478e5fd33b7
http://irc.nrc-cnrc.gc.ca
Conside ring t im e -de pe nde nt fa c t ors in
t he st at ist ic a l pre dic t ion of w at e r m a in
bre a k s
N R C C - 4 2 6 6 3
K l e i n e r , Y . ; R a j a n i , B . B .
A version of this document is published in / Une version de ce document se trouve dans:
American Water Works Association: Infrastructure Conference, Baltimore, Maryland, March 12-15, 2000, pp. pp. 1-12
Considering Time-dependent Factors in the Statistical Prediction of Water
Main Breaks
Yehuda Kleiner and Balvant Rajani
Institute for Research in Construction, National Research Council Canada, Ottawa, Ontario Canada K1A 0R6
AWWA Infrastructure Conference Proceedings, March 12-15, 2000, Baltimore, Maryland
Abstract: The effective planning of water distribution system renewal requires accurate
quantification of the structural deterioration of water mains. As typical water distribution systems comprise hundreds and even thousands of buried pipes, direct inspection of all of them is often prohibitively expensive. Identifying water main breakage patterns over time is an effective and inexpensive alternative to measure the structural deterioration of a water distribution system.
Environmental and operational conditions exert stresses on the pipe. Pipe breakage occurs when these stresses exceed its structural resiliency. While the structural deterioration of the pipe is generally considered to be a steady, monotonous process, some of the environmental and operational stresses could be time-dependent, steady or transient. These stresses result in “noisy” breakage rate data sets that reduce the accuracy of establishing the underlying deterioration (ageing) patterns, especially in small data sets. If the cause of these random stresses can be identified and attributed to a measurable phenomenon (e.g., temperatures, precipitation, etc.), their “noisy” effect can be neutralised to obtain a more accurate pipe deterioration pattern.
A method is presented to analyse how breakage rate patterns in water mains are affected by time-dependent factors. The method is versatile enough to consider any number of underlying causes but the solution becomes more complex as the number of causes increases. The method is demonstrated with three case studies that examine the effect of temperature, soil moisture, main replacement rates and cathodic protection rates on pipe breakage patterns. Finding the “true” deterioration rates of buried water mains will inevitably lead to a more accurate prediction of their useful life, which in turn will lead to a more efficient allocation of resources for water main rehabilitation and renewal.
Résumé : Pour une planification efficace du renouvellement d’un système de distribution
d’eau, il faut une quantification exacte de la détérioration structurelle des conduites d’eau. Étant donné que les systèmes de distribution d’eau type comprennent des centaines, voire des milliers de conduites souterraines, une inspection sur place de toutes les conduites coûterait trop cher. Une autre solution, efficace et moins chère, consiste à identifier les modèles de bris des conduites au fil du temps de façon à mesurer la détérioration structurelle d’un système de distribution d’eau.
Les conditions environnementales et opérationnelles exercent des contraintes sur les conduites. Le bris d’une conduite a lieu lorsque les contraintes sont supérieures à la résilience structurelle. Alors que la détérioration structurelle d’une conduite est généralement considérée comme étant un processus régulier et uniforme, certaines contraintes environnementales et opérationnelles peuvent être temporelles, continues ou transitoires. Ces contraintes se traduisent alors par ensembles de données “bruitées” sur les taux de bris qui diminuent l’exactitude des définitions des modèles de détérioration (vieillissement) sous-jacents, plus particulièrement quand les données ne sont pas très nombreuses. Si la cause de ces contraintes aléatoires peut être identifiée et imputée à un phénomène mesurable (températures, précipitations, etc.), leur effet de “bruitage” peut être neutralisé afin d’obtenir des modèles de détérioration des conduites plus exacts.
L’auteur présente une méthode pour analyser comment les facteurs dépendant du temps influent sur les modèles de taux de bris des conduites. Cette méthode est assez souple pour prendre en considération n’importe quel nombre de causes sous-jacentes mais la solution devient plus complexe au fur et à mesure que le nombre de ces causes augmente. Trois études de cas viennent démontrer cette méthode, analysant l’effet de la température, de l’humidité du sol, des taux de remplacement des conduites ainsi que des taux de protection cathodique sur les modèles de bris des conduites. Trouver les taux de détérioration “véritables” des conduites d’eau souterraines amènerait bien sûr à une estimation plus juste de leur vie utile, et donc une allocation des ressources plus judicieuse pour la réhabilitation et le renouvellement des conduites.
Key words:water main deterioration, pipe failure, statistical analysis of water main breaks,
time-dependent factors.
Introduction
General. Distribution networks often account for up to 80% of the total expenditure involved
in water supply systems. As water mains deteriorate both structurally and functionally, their breakage rates increase, network hydraulic capacity decreases, and the water quality in the distribution system may decline. Scarce capital resources make it essential for planners and decision-makers to seek the most cost-effective rehabilitation and renewal strategy. The ideal strategy should exploit the full extent of the useful life of the individual pipe, while addressing issues of safety, reliability, water quality, and economic efficiency.
The effective planning of the renewal of water distribution systems requires accurate quantification of the structural deterioration of water mains. Direct inspection of water mains is often prohibitively laborious and expensive. The application of physical models to assess the structural resiliency of each individual pipe is also not realistic in most cases because accurate data are rarely available and are very costly to obtain. Identification of breakage patterns over time is an effective and inexpensive alternative to measure the structural deterioration of water mains. While the structural deterioration of pipes is generally a steady monotonous process, environmental and operational conditions are random and sometimes cyclical over time. These random events lead to “noisy” breakage rates that reduce the accuracy in finding the underlying deterioration (ageing) patterns, especially in small data sets.
Time-dependent factors. Typically, water mains break when environmental and operational
conditions exert stresses that exceed structural resiliency of deteriorating pipes. Factors affecting pipe deterioration rate and operational and environmental conditions can be either static or time-dependent. For example, the material type and diameter of a pipe are static factors that affect pipe deterioration, while the age of the pipe is an obvious non-static factor. The soil type is a static environmental factor, while soil and water temperatures are random, time-dependent factors that may influence the breakage rate of water mains. Even soil electrical resistivity, which is often treated as a static factor, is more likely to be time-dependent in many places due to application of de-icers and fluctuations in soil moisture content.
While several researchers (e.g., Newport, 1981; Walski and Pelliccia, 1982; Lochbaum, 1993) observed the effects of temperature and moisture conditions on the breakage rate of watermains, most breakage prediction models in water mains developed so far deal almost exclusively with static factors. The reason for that could be twofold. First, the modelling of some of those time-dependent factors, e.g., soil resistivity require extensive amounts of data that are historically unavailable and costly to acquire in the future. Second, many undoubtedly question the merit of using effects like temperatures in breakage prediction models, seeing that temperatures in themselves can not be predicted reliably.
Since water main breakage rate can indeed be influenced by time-dependent factors, it is posited that failure to consider these factors in any statistical analysis may, in many cases, yield biased results. Conceptually, pipe breakage rate can be viewed as a non-decreasing function of time (disregarding, for simplicity, phenomena like the first phase of the bathtub effect), with “noise” that is super imposed upon it by time-dependent effects. Some of these time-dependent factors are steady while others are transient or cyclical in nature. Cyclical effects tend to average out in the long run, however, when dealing with short data sets the cyclical effects can introduce significant bias into analysis results. In this paper we use three case studies to demonstrate how breakage prediction models can consider time-dependent factors in order to refine the accuracy of their predictions. An additional benefit of identifying time-dependent effects may be in gaining additional insight into pipe failure mechanisms. The factors that are considered in these case studies are operational – water main replacement rates and cathodic protection, and environmental – temperatures and soil moisture.
Temperature and soil moisture effects. The influence of temperatures on water and gas main
breakage rates was observed by others, e.g., Lackington and Large (1980), Newport (1981), Needham and Howe (1981), Walski and Pelliccia (1982), Cittoni (1985), Goulter and Kazemi (1989), Lochbaum (1993), Habibian (1994), Chambers (1994), and others. Most reported a typical annual pattern of breakage rate that peaks during or towards the end of the winter season, when the ground temperatures are below normal.
The influence of soil moisture on water and gas main breakage rates was observed by Baracos et al. (1955), who observed that water mains breaks in Winnipeg largely occurred between September and January and peaked especially when dried-soil conditions existed after a hot summer or just prior to spring thaw. Morris (1967) and Clarke (1971) reported that volumetric swelling and shrinkage for clays is a contributory factor towards a high number of water main breaks. Newport (1981) observed breakage rate peaks following very hot and dry
summers in the UK. Hudak et al. (1998) also observed that extreme dry periods led to an increase in water main breaks in expansive soils found in Texas.
Rajani et al. (1996) developed a pipe-soil interaction model, which demonstrates how temperature and soil moisture interact to influence pipe breakage rate. Buried mains are restrained from movement by the frictional resistance between pipe and soil. When pipes are initially installed at a warm ambient temperature, they will contract (axially and to a minor extent circumferentially) upon subsequent drop in water and ground temperatures, resulting in the development of axial tensile stresses. Conversely, tensile stresses in the pipe can also be induced if pipes attempt to resist deformation imposed by soil shrinkage as moisture is depleted. Frictional resistance can also increase if either the frictional angle or the vertical load increase. Frictional angle can vary over time as a result of changes in the surface properties of the pipe due to corrosion, and also as a result of changes in soil moisture content. The vertical loads can increase as a consequence of either frost load or swelling and shrinking of expansive soils. Flexural (bending) actions due to inadequate bedding support will tend to augment the response of the pipe to imposed vertical loads.
The Rajani and Zhan (1996) model described the mechanics and circumstances that lead to the generation of frost loads, which develop primarily as a consequence of different frost susceptibilities (frost penetration and frost heave) of trench backfill and sidefill (native soil) and the interaction at the trench backfill-sidefill interface. The depth of frost front can be estimated using the Berggren function (Aldrich, 1956) which considers thermal conductivity and latent heat of the frozen soil, freezing index and a correction factor that depends on the thermal properties of the unfrozen and frozen soil. The Berggren function shows that a dry soil (expected after an extreme dry season) will have low latent heat capacity and will therefore lead to deeper frost penetration even if the thermal conductivity and freezing index remain unchanged.
Clays with high montmorillonite mineral content undergo substantial volume change when subjected to seasonal wet (swelling) and dry (shrinkage) conditions. However, a physical model of how these volume changes impose stresses on the pipes is not currently available. Nonetheless, longitudinal and vertical actions are likely to compound and lead to a water main breakage whenever processes like corrosion have compromised the structural resiliency of the main.
Method
In a recent review (Kleiner and Rajani, 1999), the statistical methods available in the literature to predict water main breakage were classified broadly into deterministic, probabilistic multi-variate and probabilistic single-variate models applied to grouped data. The statistical methods for predicting water main breaks use available historical data on past failures to identify pipe breakage patterns. These patterns are then assumed to continue into the future in order to predict the future breakage rate of a water main or its probability of breakage. Of all the statistical methods reviewed, none considered time-dependent variables other than pipe age and sometimes number of previous breaks. Mathematically, time-dependent variables could be considered in most existing models, though in some cases the statistical analysis may prove to be substantially more challenging. This paper focuses on the time-exponential and time-power
models to predict breakage rates. A desirable precursor to this type of statistical analysis is to partition the population of water mains into groups that are appreciably uniform and homogeneous with respect to their response to deterioration and stress inducing mechanisms. Grouping criteria could be properties such as material type, pipe size, vintage, soil type, etc. These time-exponential models have been quite popular and in several cases have been used to analyse large distribution systems (e.g., Walski and Wade 1987; Male et al. 1990).
Time-exponential model. Shamir and Howard (1979) were the first to suggest that water
main breakage rates increased exponentially with pipe age.
) ( 0) 0 ( ) ( At t e t N t N = − (1)
where t is the time elapsed (from base year to ) in years; N(t) is number of breaks per unit length per year (km-1 year-1) at time t, and A is coefficient of breakage rate growth (year-1). Note that for convenience to can be taken as zero.
This single variate, two-parameter expression was used by many others with and without modifications, e.g., Walski and Pelliccia (1982), Clark et al. (1982), Kleiner et al. (1998), Kleiner and Rajani (1999) to name a few. We propose to generalise it to a multi-variate exponential model T x a e x N x N( )= ( 0) ⋅ (2)
where x = vector of time-dependent covariates, N(x) = number of breaks resulting from x,
a = vector of parameters corresponding to the covariates x; x0 = value of covariates x at a baseline
time. Time-dependent covariates (or “explanatory variables”) could be pipe age, temperature, precipitation, etc. Parameters N(x0) and a can be found by least square regression (with or
without linear transformation) or using maximum likelihood. A similar approach can be used to extend the time-power function, as suggested by Constantine and Darroch (1993), to a multi-variate power model.
It should be stressed that equation (2) in its current form should be applied to groups of pipes that are relatively homogeneous with respect to their response to the selected set of covariates. The criteria of grouping the pipes into homogeneous groups can be unique to a distribution system and is often not known a priori.
The factors that were examined for this presentation were time elapsed from a baseline year (the first year that breakage data were available), temperature and soil-moisture effects, as well as main replacement rates and cathodic protection rates. The following is a description of how these factors were considered.
Freezing index (FI). The periodical freezing index is expressed in degree-days, which is the
cumulative average daily temperature below 0OC during a given period. It gives a measure of the severity of winter during the specified period.
å = ∈DDp i i p T FI (3)
where Ti = average daily temperature of day i, DDp = degree days in period p or all the days with average temperature below 0OC.
In this study the actual FI covariate was normalised by its mean value in order to obtain a better stability in the calculations as well as obtain parameters that are comparable in order of magnitude.
Rain deficit (RD). As previously described, low soil moisture levels may affect pipe
breakage rates both in warm (soil shrinkage) and cold (soil shrinkage and increased frost penetration) regions. The Thornwaite method (e.g., Withers and Vipond, 1980) quantifies the moisture depletion in the ground as a function of temperature, precipitation and latitude. While there are other, sometimes more refined, methods to quantify soil moisture, we have selected the Thornwaite method because of its simplicity and the ease of obtaining the required data.
Since this method was developed in Eastern USA, it is thus more suitable to humid climates, some modifications had to be implemented for other climates. The effect of these modifications on the results was deemed minimal because what is of interest are the time-dependent relative variations in soil moisture rather then their absolute values. The RD was also normalised by its mean for the same reasons as the FI covariate.
Cumulative length of replaced mains (CLR). In many main break models the number of
breaks are normalised by the total length of the water main inventory, resulting in units of number of breaks per pipe length. This practice is instrumental as water main inventories change over time due to new construction, abandonment and replacement. However, it also implies that the spatial distribution of the breaks along the pipes is uniform. This implication may bias the model, especially when implementing a main replacement program, in which the mains with the highest breakage rates are replaced first. Taking the cumulative length of the replaced mains as an additional time-dependent covariate may capture this phenomenon. Specifically, it was assumed that the CLR in year i would affect the breakage rate in year i+1.
Cumulative length of cathodic protection (CLCP). There is evidence that pipes that have
been retrofitted with cathodic protection change their deterioration patterns in certain circumstances (e.g., Gummow, 1988; Doherty, 1990; Green et al., 1992). Similar to CLR, the pipes that are likely to first receive this retrofit are the ones with the highest breakage rate. Thus, the cumulative length of cathodically protected pipes was also taken as a time-dependent covariate where applicable.
Analysis time-step. The calendar year of 12-month, January to December is less suitable to
capture the effects of a cold winter that follows a dry summer. Thus, where monthly breakage data were available, i.e., Ottawa, a season-based period was used, e.g., from May to April.
Data analysis and interpretation
Adelaide. The data set from Adelaide, Australia, contained the number of breaks per month,
recorded for the 10 years period 1985-1994, for cast iron (CI) and asbestos-cement (AC) pipes separately. Information was unavailable to further refine the groups of pipes. Climatic data were obtained from the Australian National Climate Centre. Adelaide’s climate is warm and arid, thus only time and RD were examined as co-variates, with a calendar year (January to December) as the basic time-step.
Figure 1. Adelaide water main breaks as a function of time and RD.
As can be seen from Figure 1, AC pipes appear to be more affected by RD than CI pipes (the coefficients of RD in the exponent were 0.13 and 0.05 for AC and CI mains respectively). The dashed lines, showing the influence of the time factor on the respective breakage rates, are nearly horizontal, which indicates little deterioration rate. This means that the model attributes the annual fluctuations in breakage rates predominantly to RD fluctuations. It is possible that this analysis could be refined if the pipes were further grouped into homogeneous age or soil groups or if pipe replacement rates in the relevant period were available.
The analysis was applied using both the multi-variate exponential and the multi-variate power models. The results in Figure 1 were obtained from the multi-variate exponential model. The multi-variate power model performed somewhat better, yielding r2 values of 0.73 and 0.47 for AC and CI pipes respectively.
Ottawa. The data set from Ottawa, Ontario, contained water main break records for the years
1973-98. The climate data was obtained from Environment Canada. Following an observation of 0 100 200 300 400 500 600 1985 1986 1987 1988 1989 1990 1991 1992 1993 1994 No . of brea ks AC observed CI observed CI predicted (time + RD)
CI time factor only
AC predicted (time + RD)
AC time factor only
r2= 0.70
typical higher breakage rate towards the end of every winter, the basic time-step was taken as the twelve-month period May-April, and two basic assumptions were made:
• A warm and dry summer with a relatively high RD will tend to increase the breakage rates of the following winter, because low soil moisture content will decrease the latent heat that mitigates frost penetration.
• A cold winter will tend to increase the breakage rate because of increased frost penetration. It was further assumed that in Ottawa, the soil is mostly frozen during winter at the relevant depths, thus there is typically very little variation in the RD. Consequently, the value of the RD in November was taken as the one prevailing during the critical period of frost penetration. In addition, CLR and CLCP were also considered in the analysis. Figure 2 shows the breakage pattern found for CI water mains up to 12” in diameter.
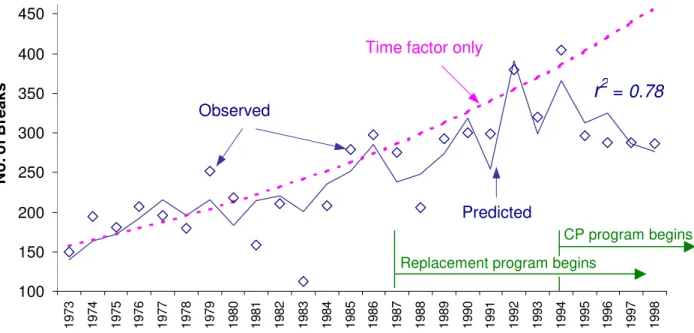
Figure 2. Ottawa water main breaks as a function of time, FI, RD, CLR.and CLCP.
It can clearly be seen that the water mains in Ottawa have been deteriorating in a relatively steady rate. In 1987 the utility embarked upon a main replacement program and in 1994 a cathodic protection retrofit program was initiated. The CLR and CLCP appear to have captured the effect that these two programs have had on the breakage rate. This effect is apparent in the way the observed breakage rates seem to depart from the up-trend of the time factor, around 1987-1989. The FI and RD covariates also appear to be significant to the prediction, because omitting them as covariates resulted in an r2 of 0.64.
Edmonton. The data set from Edmonton, Alberta, included annual break counts for the years
1961-98 in cast iron water mains. The climate data was obtained from Environment Canada. Since the break counts were available only annually and not monthly, the analysis time-step was
100 150 200 250 300 350 400 450 1 973 1 974 1 975 1 976 1 977 1 978 1 979 1 980 1 981 1 982 1 983 1 984 1 985 1 986 1 987 1 988 1 989 1 990 1 991 1 992 1 993 1 994 1 995 1 996 1 997 1 998 No . o f Br e a k s CP program begins Replacement program begins
Time factor only
Observed
Predicted
taken as a calendar year, January to December. The temperature and soil-moisture effects were modelled in the same manner as Ottawa, i.e., in terms of FI and RD. Since it was known that Edmonton embarked on an aggressive main replacement program in 1982, CLR was also taken as a covariate. Figure 3 demonstrates the results.
Figure 3. Edmonton water main breakage rate as a function of time, FI, RD and CLR.
It can clearly be seen that the water mains in Edmonton have been deteriorating quite fast (7.8% compounded annual increase in average breakage rate) and that the CLR has indeed captured the dramatic effect that the pipe replacement program has on the breakage rate. Omitting the FI and RD as covariates resulted in an r2 of 0.8. This indicates a relatively small contribution of the environmental factors to the quality of the prediction, which is expected in such a long data set, as was discussed earlier. However, the contribution of these environmental factors may increase significantly when analysing short data sets, as is demonstrated in the following.
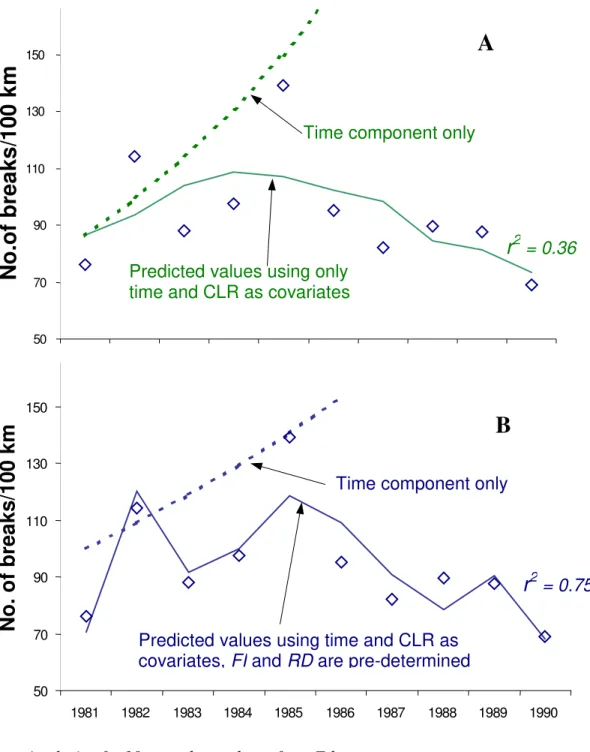
A subset of the Edmonton data encompassing 10 years 1981-90 was randomly selected and analysed separately. First, a prediction was made using only time and CLR as covariates. This resulted in a model that captured the effect of the CLR on the breakage rate as is shown in Figure 4A. However, the time component came out very steep, indicating a compounded average increase in breakage rate of 14.8% per year. This is nearly twice the rate of 7.8% that was found in the 38-year data set.
0 20 40 60 80 100 120 140 160 1962 1964 1966 1968 1970 1972 1974 1976 1978 1980 1982 1984 1986 1988 1990 1992 1994 1996 1998 N o . of break s /10 0 km Observed
Time factor only
Predicted
r2=0.86
Figure 4. Analysis of a 10-year data sub-set from Edmonton.
In the second step a prediction was made using only FI and RD as covariates. Once the coefficients for these covariates were established, another prediction was made, with the coefficients for the FI and RD held constant, and the time and CLR as covariates. Figure 4B illustrates the results. The r2 is significantly higher than the previous one and the time component at 8.8% is much closer to the long-term compounded average increase in breakage rate.
50 70 90 110 130 150
N
o
.o
f b
r
eak
s/
1
0
0 km
50 70 90 110 130 150 1981 1982 1983 1984 1985 1986 1987 1988 1989 1990No. o
f
brea
ks
/1
0
0
km
A
B
r
2 = 0.36Predicted values using only time and CLR as covariates
Time component only
Predicted values using time and CLR as covariates, FI and RD are pre-determined
Time component only
It should be noted that in Adelaide the entire water main inventory was grouped into cast iron and asbestos cement pipes, while in Ottawa and Edmonton the entire cast iron population was considered. It is likely that better fit could be obtained if the respective data set were partitioned into more homogeneous groups.
Summary
Planning for water main rehabilitation and renewal is imperative to meet adequate water supply objectives. The ability to understand and quantify pipe deterioration mechanisms is an essential part of the planning procedure. While a comprehensive physical model of pipe deterioration is desirable, it is currently more realistic to use statistical models for distribution water mains due to the availability and the cost to acquire data necessary for physical models. Over the last two decades various models have been developed to statistically model and predict pipe failures and failure rates. These models, however, dealt predominantly with static, rather than time-dependent, factors, which influence water main breaks.
A new method was presented in which time-dependent factors can be considered in the statistical modelling of water main breakage rates. This method, which can be applied either as a multi-variate exponential model or a multi-variate power model is powerful, yet simple enough to account for ageing as well as environmental and operational effects that vary over time. The application of this method was demonstrated with three case studies that considered ageing, as well as environmental (FI, RD) and operational (CLR, CLCP) time-dependent variables. Other variables can be considered if they are judged to be significant and if relevant data are available. It was also demonstrated that failure to consider time-dependent variables may result in significantly biased results, especially in short data sets.
The consideration of time-dependent factors can be incorporated in existing break prediction models (e.g., proportional hazards, accelerated life time, and others) to improve their accuracy and remove possible biases.
Acknowledgements
We would like to extend our gratitude to the water utilities of Adelaide, Edmonton (EPCOR Water Services) and the Regional Municipality of Ottawa Carleton for providing the data for this research.
References
Aldrich, H.P. (1956). “Frost penetration below highway and airfield pavements.” Highway
Research Board, 36(145), 125-144.
Barcos, A; Hurst, W.D., and Legget, R. F. (1955). “Effects of Physical Environment on Cast Iron pipe.” J. AWWA, 47(12), 1195-1206.
Chambers, G.M. “1994. Reducing water utility costs in Winnipeg.” Proceedings of the Western
Canada Water and Wastewater Association Conference, October 1994, Winnipeg, Manitoba. pp.
1-12.
Ciottoni, A.S. (1985). “Updating the New York City water system.” Proceedings of the Specialty
Conference on Infrastructure for Urban Growth. pp. 69-77.
Clark, C.M. (1971). “Expansive-soil effect on buried pipe.” J. AWWA, 63, 424-427.
Clark, R. M., Stafford, C. L., and Goodrich, J. A. (1982). “Water distribution systems: A spatial and cost evaluation.” J. Water Resources Planning and Management Division, ASCE, 108(3), 243-256.
Constantine, A. G., and Darroch, J. N. (1993). “Pipeline reliability: stochastic models in engineering technology and management.” S. Osaki, D.N.P. Murthy, eds., World Scientific Publishing Co.
Doherty, B.J. (1990). “Controlling Ductile-iron Water Main Corrosion: A Preventive Maintenance Measure”, Materials Performance, 29(1), 22-28.
Green, B.M. Johnson, F. and De Rosa, J. (1992). “In situ Cathodic Protection of Existing Ductile iron Pipes”, Materials Performance, 31(3), 32-38.
Goulter, I. C., and Kazemi, A. (1988). “Spatial and temporal groupings of water main pipe breakage in Winnipeg.” Canadian J. Civil Engrg., 15(1), 91-97.
Gummow, R.A. (1988). “Experiences with Water Main Corrosion”, Joint Annual Conference of the Ontario Section AWWA and OMWA, London. Ontario. pp. 1-41.
Habibian, A. (1994). “Effect of temperature changes on water-main break”, J. Transportation
Engrg., ASCE, 120(2), 312-321.
Hudak, P., Sadler, B. and Hunter, B. (1998). “Analyzing underground water-pipe breaks in residual soils.” Water/Engineering Management, 145(12), 15-20.
Kleiner, Y., Adams, B. J., and Rogers, J. S. (1998). “Long-term planning methodology for water distribution system rehabilitation.” Water Resources Research, 34(8), 2039-2051.
Kleiner, Y., and Rajani, B. B. (1999). “Using limited data to assess future need.” J. AWWA, 91(7), 47-62.
Lackington, D.W. and Large, J.M. 1980. “The integrity of existing distribution systems.”
Journal of the Institute of Water Engineers and Scientists, 34: 15-32.
Lochbaum, B. S. (1993) “PSE&G develops models to predict main breaks.” Pipeline and Gas J., 20(9), 20-27.
Morris, R.E. (1967). “Principal causes and remedies of water main breaks.” J. AWWA, 54: 782-798.
Needham, D., and Howe, M. 1981. “Why gas mains fail, Part 1.” Pipe Line Industry, 55: 47-50. Newport, R. (1981). “Factors influencing the occurrence of bursts in iron water mains.” Water
Supply and Management, 3, 274-278.
Rajani, B. B., and Kleiner, Y. (1999). “Comprehensive review of structural deterioration of water mains: Physical models.” Submitted to J. Infrastructure Systems, ASCE.
Rajani, B. and Zhan, C., (1996). “On the Estimation of Frost Load.” Canadian Geotechnical
Journal, 33(4), 629-641.
Rajani, B., Zhan, C. and Kuraoka, S., (1996). “Pipe-soil Interaction Analysis for Jointed Water Mains”, Canadian Geotechnical Journal, 33(3), 393-404.
Shamir, U., and Howard, C.D.D. (1979). “An analytic approach to scheduling pipe replacement.” J. AWWA, 71(5), 248-258.
Walski, T. M., and Pelliccia, A. (1982). “Economic analysis of water main breaks.” J. AWWA, 74(3), 140-147.
Withers B., and Vipond, S. (1980). “Irrigation: design and practice” 2nd Edition, Cornell