Publisher’s version / Version de l'éditeur:
Proceedings 18th International Conference on Port and Ocean Engineering under Arctic Conditions, POAC'05, 1, pp. 176-185, 2005
READ THESE TERMS AND CONDITIONS CAREFULLY BEFORE USING THIS WEBSITE.
https://nrc-publications.canada.ca/eng/copyright
Vous avez des questions? Nous pouvons vous aider. Pour communiquer directement avec un auteur, consultez la première page de la revue dans laquelle son article a été publié afin de trouver ses coordonnées. Si vous n’arrivez pas à les repérer, communiquez avec nous à [email protected].
Questions? Contact the NRC Publications Archive team at
[email protected]. If you wish to email the authors directly, please see the first page of the publication for their contact information.
NRC Publications Archive
Archives des publications du CNRC
This publication could be one of several versions: author’s original, accepted manuscript or the publisher’s version. / La version de cette publication peut être l’une des suivantes : la version prépublication de l’auteur, la version acceptée du manuscrit ou la version de l’éditeur.
Access and use of this website and the material on it are subject to the Terms and Conditions set forth at
Properties of Hummocked Ice in Transition Zone Between Fast Ice And Pack Ice, Labrador.
Johnston, Michelle
https://publications-cnrc.canada.ca/fra/droits
L’accès à ce site Web et l’utilisation de son contenu sont assujettis aux conditions présentées dans le site LISEZ CES CONDITIONS ATTENTIVEMENT AVANT D’UTILISER CE SITE WEB.
NRC Publications Record / Notice d'Archives des publications de CNRC: https://nrc-publications.canada.ca/eng/view/object/?id=1a3b0697-fc7a-4c69-a449-6e6c3badae27 https://publications-cnrc.canada.ca/fra/voir/objet/?id=1a3b0697-fc7a-4c69-a449-6e6c3badae27
Proceedings 18th International Conference on Port and Ocean Engineering under Arctic Conditions, POAC’05
Vol.1, pp 177-185, Potsdam, NY, USA, 2005.
PROPERTIES OF HUMMOCKED ICE IN TRANSITION ZONE
BETWEEN FAST ICE AND PACK ICE, LABRADOR
M.E. Johnston
Canadian Hydraulics Centre, National Research Council Canada Ottawa, Ontario, Canada
ABSTRACT
This paper discusses property measurements made at four sites in a hummocked area of ice about 40 km east of Nain, Labrador. The measurements were made in April, when the ice thickness ranged from 0.99 to 2.20 m. The ice at the four sites was isothermal at near melting temperatures throughout its full thickness, with slightly colder temperatures at the top ice surface. The ice salinity ranged from near zero in the top ice, to 4 to 5 ‰ towards the interior of the ice, and upwards of 8 ‰ in the bottom ice. In situ borehole strengths of the hummocked ice ranged from 5.3 to 10.6 MPa at the top ice surface, and near zero to 5.5 MPa at the bottom ice surface. The borehole strength in the interior regions of ice ranged from 9.8 to 14.9 MPa.
INTRODUCTION
Shipping to the Voisey’s Bay Mine is planned to commence in the winter 2006 (Rowell and Metcalf, 2005). To access the mine site in Anaktalak Bay, the bulk carrier must first travel through the Labrador shear zone before entering the level, landfast ice. The shear zone can be defined as the dynamic area of ice between the moving pack ice and the stable landfast ice. Much of the shear zone is comprised of hummocked ice, which the World Meteorological Organization (WMO) defines as ‘sea ice piled haphazardly, one piece over another, to form an uneven ice surface’. Some of that rough ice extends into the landfast ice, where it becomes what the Inuit call mannitualuit (J. Rowell, personal communication).
Because the properties of hummocked ice near Labrador are not very well known, the Canadian Hydraulics Centre (CHC) conducted property measurements at four sites in the hummock field near Nain, Labrador (56.53°N, 61.68°W) in April 2004. The hummocked ice that was sampled was not in the shear zone, per se, it was in an area of quasi-stable landfast ice. For the purposes of this paper, the region in which the hummocked ice sties were located will be referred to as the transition zone. Although the properties of level, landfast ice near Nain were measured four times during the winter/spring of 2004 (Johnston, 2005), sampling in the hummocked ice was possible during the April visit only, as discussed subsequently.
HUMMOCKED ICE: A SYNOPSIS OF HOW IT FORMED
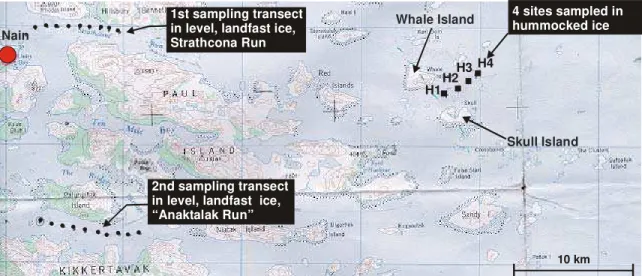
Figure 1 shows where the location of the four sites in the hummocked ice (denoted by an ‘H’) in relation to the sampling sites in level, landfast ice reported in Johnston (2005). The hummocked ice sites were selected along the proposed shipping route to Voisey’s Bay Mine, which passes between Whale Island and Skull Island (Dickins and Dempsey, 2005). The sites in the hummocked ice were separated by a distance of 1 km. 10 km Nain Whale Island Skull Island 1st sampling transect
in level, landfast ice, Strathcona Run
2nd sampling transect in level, landfast ice, “Anaktalak Run” 4 sites sampled in hummocked ice H4 H3 H2 H1 H1 (6264309N, 0617321W), H2 (6264863N, 0618118W), H3 (6265467N, 0618888W), H4 (6266108N, 0619669W)
Figure 1 Four sampling sites in the hummocked ice (H1, H2, H3 and H4)
sampling sites in landfast ice shown to left
The Ice Charts issued by the Canadian Ice Service for the East Coast Region for the winter of 2004 show dramatic changes in the landfast ice extent near Nain. When the first visit to Labrador was made in late-January, the landfast ice extended to within a few kilometres west of Whale Island. The Charts show that the ice between Whale and Skull Islands consisted of thin first-year ice, young ice and grey-white ice in
late-January. Because the Charts do not differentiate between rough and level ice, there is no documentation about when the thin first-year ice between Whale and Skull Islands transformed into hummocked ice. In mid-March, strong onshore winds that occurred in the area, and may have resulted in the extensive hummock field that formed between Whale and Skull Islands, and beyond (R. Webb, personal communication). Assuming that the hummock field developed in mid-March, only about two weeks had passed when the second trip to Labrador was made, in late-March. Upon learning that a hummocked area of ice had developed within ‘reach’ of Nain (about three hours by snowmobile, round trip), the author returned to Ottawa and approached Transport Canada about providing support for measurements in the Labrador hummocked ice, during the third and fourth visits to Labrador. Because the properties of rough ice are relevant to shipping, Transport Canada provided resources to allow for the extra time and labour needed for sampling the hummocked ice in April and May.
Measurements were conducted at four sites in the hummocked ice between Whale and Skull Islands during the third trip to Labrador, in mid-April. On site observations revealed that the hummock field extended as far as the eye could see; the Ice Chart for mid-April showed that the landfast ice extended about 20 km east of site H4 (Figure 1). Assuming that high winds in mid-March had caused the hummock field to form, the hummocked ice would have had about one month to consolidate before measurements were made on 19 April.
Although measurements in the hummocked ice had been planned for the fourth and final trip to Labrador, on 11 May, that was not to be. A storm on the weekend of 9 May (R. Webb, personal communication) devastated the landfast ice edge, taking the four hummocked ice sites out to sea. The Ice Chart for 10 May confirmed that the storm caused the landfast ice edge to rapidly recede. It is interesting (indeed frustrating) to note that the hummocked ice sites were missed by only a few days.
PROPERTY MEASUREMENTS AND SAMPLING METHODOLOGY
Johnston (2005) provides a detailed description of the sampling methodology that was used to sample the level and hummocked ice in Labrador, which is summarized here. A motor driven, fibreglass corer was used to make three boreholes in the ice (0.15 m diameter), at least 2.0 m apart. The ice thickness, freeboard and snow depths were measured at each borehole. When a full thickness core was not removed from the ice, the thickness of the ice was measured using a 50 mm auger, based upon total depth of auger flighting that the ice ‘consumed’. The ice core from the first borehole was used to profile the ice temperature (at 0.20 m intervals) using a calibrated Fluke 73 multimeter, with an attached 80T-150U temperature probe (the instrument has a limited accuracy (+/- 2°C) when the temperature of the ice approaches its melting
point). The core from the second hole was used to measure the ice salinity (at 0.20 m intervals) with an Orion model 105A portable conductivity meter (accuracy 0.5%). The third core was sometimes used to provide a second ice temperature profile. The NRCC borehole indentor (Sinha, 2005) was used to measure the in situ strength of the ice in each of the three boreholes, at depth intervals of 0.30 m. The borehole indentor measures the confined compressive strength of the ice using two opposing indentor plates to penetrate the ice. An external digital data acquisition system was used to record the displacement of each indentor plate and the oil pressure. Upon concluding a test, the indentor plates were fully retracted, the borehole indentor was rotated 90° and the test unit was lowered to the next depth. All borehole strengths in this paper have been (a) converted from oil pressure to ice pressure using a ratio of 0.56 (Johnston, 2005), (b) are reported at a standard indentor penetration of 3 mm (Johnston et al., 2001) and (c) have been compensated for the stress-rate effect using the procedure outlined in Johnston et al. (2003).
CONDITIONS ENCOUNTERED AT RUBBLED ICE SITES
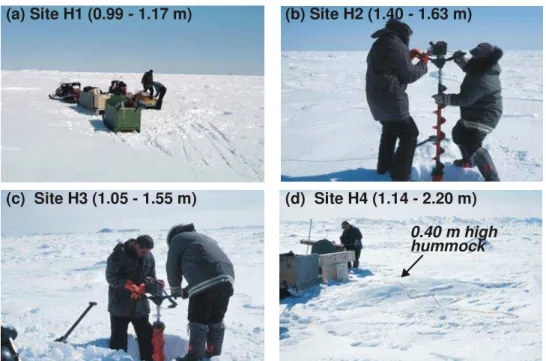
The photographs in Figure 2 show the surface conditions at the four sites in hummocked ice. The first site, H1, was selected from an area of ice between the level, landfast ice and the where the hummock field began. The fourth site, H4, was roughly 4 km west of site H1. The photographs in Figure 2 show that the ice became rougher as the rubble field was penetrated, and the snow and ice thickness became more variable. The ice at Site H1 (Figure 2-a) was relatively smooth, with an ice thickness from 0.99 to 1.17 m and snow depths from 40 to 150 mm. The ice at site H2 was 1.40 to 1.63 m thick, and had a snow cover from 210 to 340 mm thick. The ice at site H3 was 1.05 to 1.55 m thick, with snow depths from 260 to 480 mm. The fourth site, H4, provided the only opportunity to measure the properties of two well-defined ice hummocks, as well as properties of the more level surrounding ice (1.14 m thick). The larger hummock at site H4 was about 0.80 m high, had an ice thickness of 2.20 m and a 460 mm thick snow cover. The smaller hummock (shown in Figure 2-d) was 0.40 m high, had an ice thickness of 2.00 m and had no snow cover.
Since the hummocked ice was 40 km from Nain, 1.5 hours were required to reach it by snowmobile. Once in the hummocked ice, traveling was a delicate operation, especially since the field equipment was being towed behind the snowmobiles (Figure 2-a). Due to the limited amount of daylight, the level effort required to clear the ice surface of snow and conduct measurements, and the appreciable amount of transit time, measurements in the hummock field were limited to four sites only. Those sites were sampled on 19 April (Julian Day, JD110).
(a) Site H1 (0.99 - 1.17 m)
(c) Site H3 (1.05 - 1.55 m) (d) Site H4 (1.14 - 2.20 m) 0.40 m high hummock (b) Site H2 (1.40 - 1.63 m)
Figure 2 Conditions at sites in hummocked ice, ice thickness shown in brackets
DEPTH PROFILES OF ICE TEMPERATURE
An air temperature of -7.2°C was measured at site H1 (at 09:00 hrs). The air temperature steadily increased throughout the day. When measurements at site H4 were complete (17:00 hrs), the air temperature was -2.1°C. The ice temperature profile at sites H1, H2 and H3 was measured from one of the extracted cores, as shown in Figure 3-a. At those three sites, temperatures were coldest in the uppermost 0.20 m of ice. Below a depth of about 0.40 m, the ice was isothermal at near-melting temperatures, throughout the full-thickness of ice.
At site H4, ice temperature profile was measured from two different cores, as shown in Figure 3-b. Two cores were examined because site H4 provided the only opportunity to compare temperatures in the level ice, to those in hummocked ice. The profile in level ice at site H4 was much like those observed at sites H1, H2 and H3: the uppermost 0.20 m of the level ice was coldest, while ice below a depth of 0.40 m was isothermal near its melting point. Temperatures in the hummock at site H4 (hole 3, 2.20 m thick) were several degrees colder than the level ice, however they too became isothermal below a depth of 1.2 m. Temperature measurements are not available for the smaller, 2.00 m thick hummock.
-2.5 -2.0 -1.5 -1.0 -0.5 0.0 0.5 -8 -6 -4 -2 0 2 H4-h1 ('level') H4-h3 (sm. hummock) T_air (b) -2.5 -2.0 -1.5 -1.0 -0.5 0.0 0.5 -8 -6 -4 -2 0 2 H1 H2 H3 (a) T_air Ic e d ept h ( m )
Temperature of extracted core (°C)
Figure 3 Temperature of ice at (a) sites H1, H2 and H3 and (b) site H4
(depth zero indicates top ice surface, uppermost data marker shows air temperature)
DEPTH PROFILES OF ICE SALINITY
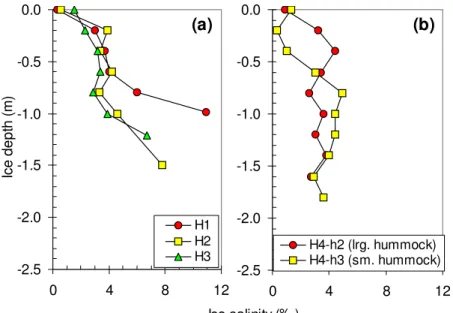
Figure 4-a shows similar salinity profiles for the ice at sites H1, H2 and H3, except that the ice at site H1 had a higher salinity towards the bottom of the ice. Salinities ranged from 0‰ at the top ice surface, 4 to 5 ‰ towards the interior of the ice, and up to 10.5 ‰ in the bottom layers of ice. Figure 4-b shows the ice salinity profile for the two hummocks at site H4. Because the bottom ice was not removed from the 2.20 m thick hummock (H4-h2, extracted core length 1.80 m) or the 2.00 m thick hummock (H4-h3, core length of 1.60 m), the two salinity profiles in Figure 4-b do not increase towards the very bottom.
Note that the two hummocks had very different salinity profiles in the uppermost 0.60 m of ice; the smaller hummock (H4-h3) had a lower surface salinity than the larger hummock (H4-h2). That is likely because the surface of the small hummock had not overlying snow cover, whereas the larger hummock had a 460 mm layer of snow. In general, the salinity of the 2.20 m thick hummock (H4-h2) was similar to the ice sampled at sites H1, H2 and H3. From depths 0.60 to 1.40 m, salinities in the larger hummock were higher than the smaller hummock. The two hummocks had similar salinity profiles below a depth of 1.40 m.
-2.5 -2.0 -1.5 -1.0 -0.5 0.0 0 4 8 12 H4-h2 (lrg. hummock) H4-h3 (sm. hummock) (b) -2.5 -2.0 -1.5 -1.0 -0.5 0.0 0 4 8 12 H1 H2 H3 (a) Ice salinity (‰) Ic e d ept h (m )
Figure 4 Salinity of ice at (a) sites H1, H2 and H3 and (b) site H4
DEPTH PROFILES OF ICE BOREHOLE STRENGTH
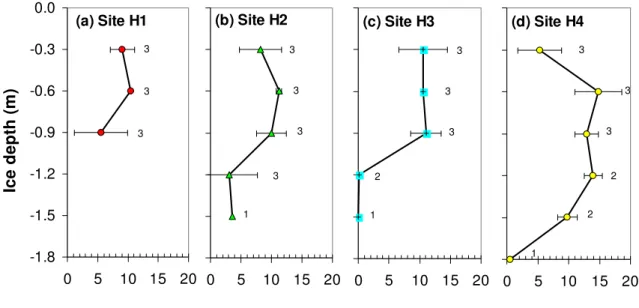
Figure 5 shows results of the borehole strength tests from sites H1 to H4. The strengths reported in the figure are the average strengths measured, at a particular depth, in (up to) three boreholes. Horizontal bars are used to show the standard deviation, or range, of the measured strengths for the different depths. The number of boreholes that were tested, at one particular depth, is noted to the right of the horizontal bars. Depending upon the ice thickness, from one to three strength tests were conducted at each depth.
The profiles show that the top ice surface and bottom ice surface had strengths that were, if not equal to, then lower than strengths towards the interior of the ice. Average borehole strengths for the hummocked ice ranged from 5.3 to 10.6 MPa at the top ice surface, and 0 to 5.5 MPa at the bottom ice surface. The strength of the interior regions of ice ranged from 9.8 to 14.9 MPa. For comparison, Johnston (2005) measured a borehole strength of level, landfast ice in Strathcona Run (0.96 to 0.98 m thick) and Anaktalak Run (0.85 to 0.91 m thick) from 4.3 to 8.3 MPa, in mid-April (Julian Day JD107/108).
The strength profile for site H4 is quite different than the other three sites: the strength of the top ice at site H4 was considerably lower than the other three sites, yet below a depth of 0.30 m the ice was consistently stronger than the other sites. Clearly, the bulk of the ice at site H4 had greater integrity than the ice at sites H1, H2 and H3. The data show that the bottom ice at sites H2, H3 and H4 had virtually no strength.
-1.8 -1.5 -1.2 -0.9 -0.6 -0.3 0.0 0 5 10 15 20 (d) Site H4 3 3 3 2 2 1 -1.8 -1.5 -1.2 -0.9 -0.6 -0.3 0.0 0 5 10 15 20 (c) Site H3 3 3 3 2 1 -1.8 -1.5 -1.2 -0.9 -0.6 -0.3 0.0 0 5 10 15 20 (b) Site H2 3 3 3 3 1 -1.8 -1.5 -1.2 -0.9 -0.6 -0.3 0.0 0 5 10 15 20 (a) Site H1 3 3 3 Ic e d e p th (m )
In situ ice borehole strength (MPa)
Figure 5 Strength of ice at four sites in hummock field
(number of boreholes tested indicated to right of standard deviation bar)
CONCLUSIONS
In April 2004, ice properties were measured at four sites in the hummocked field between Whale and Skull Islands, about 40 km east of Nain, Labrador. Site H1 was located closest to the level, landfast ice, and site H4 was located 4 km east, further into the hummock field. At the first site, the ice thickness in three holes ranged from 0.99 to 1.17 m, whereas ice at the fourth site was from 1.14 to 2.20 m thick. Cores from the four sites showed that the ice was isothermal at near melting temperatures throughout its full-thickness. The coldest temperature was measured in the surface layer of ice in a 2.20 m thick hummock at site H4 (-2.5°C). Ice salinities were lower at the uppermost ice surface, were from 4 to 5 ‰ towards the interior of the ice, and increased to upwards of 8 ‰ towards the bottom of the ice. Average borehole strengths in the hummocked ice ranged from 5.3 to 10.6 MPa at the top ice surface, 9.8 to 14.9 MPa towards the ice interior and from near zero to 5.5 MPa in the bottom layers of ice.
ACKNOWLEDGMENTS
The success of the field program would not have been possible without the assistance of G. Dicker and R. Webb of Sikumiut Environmental Management. Thanks to N. Sinha for use of the NRCC borehole indentor and to D. Boudreau of R.P.S.O. Design and Fabrication Services for providing CHC with a first-rate coring device. Particular thanks are extended to Transport Canada, especially V. Santos-Pedro; due to his quick response, CHC was able to grasp the opportunity that Mother Nature provided and sample hummocked ice in the quasi-stable region near Nain.
REFERENCES
Dickins, D.F. and Dempsey, J.B. (2005) Ice Conditions used as a Design Basis for the Voisey’s Bay Development. Proceedings of 18th International Conference on Port and Ocean Engineering under Arctic Conditions, POAC’05. Potsdam, New York, U.S.A. 20 - 26 June 2005, Vol. 1, pp 131-142.
Johnston, M., Frederking, R. and Timco, G. (2001) Decay-Induced Changes in the Physical and Mechanical Properties of First Year Ice. Proceedings 16th International Conference on Port and Ocean Engineering under Arctic Conditions, POAC’01, Ottawa, Canada, pp 1395-1404.
Johnston, M., Frederking, R. and Timco, G.W. (2003) Properties of Decaying First-year Sea Ice at Five Sites in Parry Channel. Proceedings 17th International Conference on Port and Ocean Engineering under Arctic Conditions, POAC’03, Trondheim, Norway, Vol. 1, pp 131-140.
Johnston, M. (2005) Growth and Deterioration of Landfast First-year Ice in the Sub-Arctic. Proceedings of 18th International Conference on Port and Ocean Engineering under Arctic Conditions, POAC’05. Potsdam, New York, U.S.A. 20 - 26 June 2005, Vol. 1, pp 165-175.
Rowell, J. and Metcalf, L. (2005) Sea Ice - Obstacle vs. Opportunity: Reconciling Two Views of Landfast Sea Ice. Proceedings of 18th International Conference on Port and Ocean Engineering under Arctic Conditions, POAC’05. Potsdam, New York, U.S.A. 20 - 26 June 2005, Vol. 1, pp 109-118.
Sinha, N.K. (2005): NRCC Borehole Indentor: Measuring Ice Strength. Proceedings of 18th International Conference on Port and Ocean Engineering under Arctic Conditions, POAC’05. Potsdam, New York, U.S.A. 20 - 26 June 2005, Vol. 1, pp 153-163.