HAL Id: hal-02335506
https://hal.archives-ouvertes.fr/hal-02335506
Submitted on 19 Mar 2021
HAL is a multi-disciplinary open access archive for the deposit and dissemination of sci-entific research documents, whether they are pub-lished or not. The documents may come from teaching and research institutions in France or abroad, or from public or private research centers.
L’archive ouverte pluridisciplinaire HAL, est destinée au dépôt et à la diffusion de documents scientifiques de niveau recherche, publiés ou non, émanant des établissements d’enseignement et de recherche français ou étrangers, des laboratoires publics ou privés.
Top-Down and Intact Protein Mass Spectrometry Data
Visualization for Proteoform Analysis Using
VisioProt-MS
Jean Lesne, Marie-Pierre Bousquet, Julien Marcoux, Marie Locard-Paulet
To cite this version:
Jean Lesne, Marie-Pierre Bousquet, Julien Marcoux, Marie Locard-Paulet. Top-Down and Intact Protein Mass Spectrometry Data Visualization for Proteoform Analysis Using VisioProt-MS. Bioin-formatics and Biology Insights, 2019, 13, pp.1-6. �10.1177/1177932219868223�. �hal-02335506�
Creative Commons CC BY: This article is distributed under the terms of the Creative Commons Attribution 4.0 License
(http://www.creativecommons.org/licenses/by/4.0/) which permits any use, reproduction and distribution of the work without further permission provided the original work is attributed as specified on the SAGE and Open Access pages (https://us.sagepub.com/en-us/nam/open-access-at-sage).
https://doi.org/10.1177/1177932219868223
Bioinformatics and Biology Insights Volume 13: 1–6
© The Author(s) 2019
DOI: 10.1177/1177932219868223
Introduction
Top-down proteomics consists in the analysis of intact proteins using liquid chromatography coupled to mass spectrometry (LC-MS), followed by their identification by tandem mass spectrometry (MS/MS). This informs on the protein composi-tion of the analyzed sample, and their potential combinacomposi-tions of post-translational modifications, splicing events, and/or mutations. Intact protein mass spectrometry (MS) recently increased in throughput1 and became quantitative,2,3 thereby allowing the in-depth characterization of proteoforms4 in complex samples.5 Such development was associated with the establishment of a specific lexicon,6,7 dedicated databases (repository.topdownproteomics.org), and, needless to say, a panel of bioinformatics tools.8-11
Typically, top-down and intact protein MS analysis relies on the measurement of the deconvoluted molecular weights (MWs) of proteoforms after separation by liquid chromatogra-phy (LC). This can be facilitated by the graphical representa-tion of LC-MS three-dimensional (3D) maps, where the x-axis represents retention time (RT), the y-axis represents deconvo-luted MW, and the color represents the intensity of the MS signal. In addition, directly comparing these maps reveals
differences in proteoform footprints between samples and/or experimental conditions.1,8,12–16 Recently, we developed a free standalone tool to facilitate this analytical step: VisioProt-MS.17 Here, we will illustrate its use through the analysis of the 20S core particle of the human proteasome.
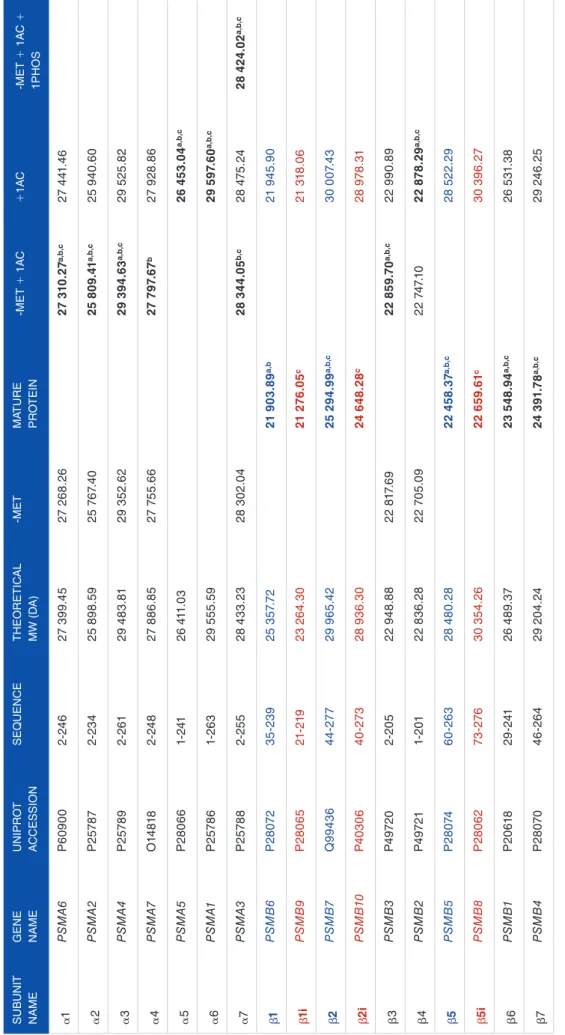
The proteasome is a ubiquitous macromolecular barrel-shaped complex of around 700 kDa that is responsible for pro-tein degradation in eukaryotic cells.18 It is vital to maintain protein homeostasis and the pool of free amino acids available for protein synthesis. It also contributes to the immune response through production of antigenic peptides. Its catalytic activity resides in the 20S core particle that is composed of 4 rings of 7 subunits each: two β-rings (β1-7) surrounded by two α-rings (α1-7). The names and theoretical MWs of these subunits are presented in Table 1. β1, β2, and β5 are the only subunits that are catalytically active in the standard 20S (std20S), and they can be replaced by β1i, β2i, and β5i to form the immunopro-teasome (i20S) in the context of immune response. This leads to 2 different functional complexes that have distinct catalytic activities.19 The proteasome is highly studied in academia and industry in the context of drug development. The 20S core particle can be immunopurified using the anti-α2 antibody
Top-Down and Intact Protein Mass Spectrometry
Data Visualization for Proteoform Analysis Using
VisioProt-MS
Jean Lesne
1, Marie-Pierre Bousquet
1, Julien Marcoux
1and Marie Locard-Paulet
21Institut de Pharmacologie et de Biologie Structurale, Université de Toulouse, CNRS, UPS,
Toulouse, France. 2Disease Systems Biology Program, Novo Nordisk Foundation Center for
Protein Research, University of Copenhagen, Copenhagen, Denmark.
ABSTRACT: The rise of intact protein analysis by mass spectrometry (MS) was accompanied by an increasing need for flexible tools allowing data visualization and analysis. These include inspection of the deconvoluted molecular weights of the proteoforms eluted alongside liquid chromatography (LC) through their representation in three-dimensional (3D) liquid chromatography coupled to mass spectrometry (LC-MS) maps (plots of deconvoluted molecular weights, retention times, and intensity of the MS signal). With this aim, we developed a free and open-source web application named VisioProt-MS (https://masstools.ipbs.fr/mstools/visioprot-ms/). VisioProt-MS is highly compatible with many algorithms and software developed by the community to integrate and deconvolute top-down and intact protein MS data. Its dynamic and user-friendly features greatly facilitate analysis through several graphical representations dedicated to MS and tandem mass spectrometry (MS/MS) analysis of proteoforms in complex samples. Here, we will illustrate the importance of LC-MS map visualization to optimize top-down acquisition/ search parameters and analyze intact protein MS data. We will go through the main features of VisioProt-MS using the human proteasomal 20S core particle as a user-case.
KeywoRDS: Mass spectrometry, proteasome, top-down, LC-MS, intact protein MS
ReCeIVeD: July 11, 2019. ACCePTeD: July 17, 2019. TyPe: Commentary
FUnDIng: The author(s) disclosed receipt of the following financial support for the
research, authorship, and/or publication of this article: This work was supported by the Novo Nordisk Foundation (NNF14CC0001), the French Ministry of Research
(Investissements d’Avenir Program, Proteomics French Infrastructure, ANR-10-INBS-08) and the Fonds Européens de Développement Régional Toulouse Métropôle and the Région Midi-Pyrénées.
DeClARATIon oF ConFlICTIng InTeReSTS: The author(s) declared no potential
conflicts of interest with respect to the research, authorship, and/or publication of this article.
CoRReSPonDIng AUTHoRS: Julien Marcoux, Institut de Pharmacologie et
de Biologie Structurale, Université de Toulouse, CNRS, UPS, 205 route de Narbonne 31077, Toulouse, France.
Email: [email protected]
Marie Locard-Paulet, Disease Systems Biology Program, Novo Nordisk Foundation Center for Protein Research, University of Copenhagen, DK-2200 Copenhagen N, Denmark. Email: [email protected]
CoMMenT on: Locard-Paulet M, Parra J, Albigot R, et al. VisioProt-MS: interactive 2D
maps from intact protein mass spectrometry. Bioinformatics. 2019;35(4):679-681. doi:10.1093/bioinformatics/bty680. PubMed PMID:30084957. PubMed Central PMCID:PMC6378940. https://www.ncbi.nlm.nih.gov/pmc/articles/PMC6378940/.
2 Bioinformatics and Biology Insights Tab le 1 . Theor etical molecular w
eights of the sub
units composing the 20S cor
e par ticle of the pr ot easome . S UB UNI T NAME G ENE NAME U NI P R o T A CCESSI o N S E q UENCE Th E o RETIC AL MW (D A ) -M ET M ATURE PR o TEIN -M ET + 1 AC + 1AC -M ET + 1 A C + 1P ho S α1 PS M A 6 P 609 0 0 2-24 6 27 3 99 .4 5 27 26 8. 26 27 3 10 .27 a,b,c 27 4 41 .4 6 α 2 PS M A 2 P 25 787 2-23 4 25 8 98 .5 9 25 7 67 .4 0 25 8 09 .41 a,b,c 25 9 40 .6 0 α 3 PS M A 4 P 257 89 2-261 29 4 83 .81 29 3 52 .6 2 29 3 94 .6 3 a,b,c 29 5 25 .8 2 α 4 PS M A 7 o 14 81 8 2-24 8 27 886 .8 5 27 7 55 .6 6 27 7 97 .67 b 27 9 28 .8 6 α 5 PS M A 5 P 280 66 1-241 26 4 11 .0 3 26 4 53 .0 4 a,b,c α 6 P S M A1 P 257 86 1-26 3 29 555 .5 9 29 5 97. 60 a,b,c α 7 P SM A3 P 257 88 2-25 5 28 4 33 .2 3 28 3 02 .0 4 28 3 44. 05 b,c 28 47 5. 24 28 4 24 .0 2 a,b,c β1 PS M B 6 P 28 07 2 35 -23 9 25 3 57 .7 2 21 9 03 .8 9 a, b 21 9 45 .9 0 β1i PS M B 9 P 28 0 65 21 -21 9 23 26 4. 3 0 21 2 76 .0 5 c 21 3 18 .0 6 β2 P S MB7 q 99 43 6 4 4 -27 7 29 9 65 .4 2 25 2 94. 99 a,b,c 3 0 0 07 .4 3 β2i P S M B 10 P4 03 0 6 40 -2 73 28 9 3 6. 3 0 24 6 48 .2 8 c 28 9 78. 31 β 3 PS M B 3 P4 97 20 2-20 5 22 9 48 .8 8 22 8 17 .6 9 22 8 59 .7 0 a,b,c 22 9 9 0. 89 β 4 PS M B 2 P4 97 21 1-20 1 22 8 3 6. 28 22 7 05 .0 9 22 7 47 .1 0 22 8 78. 29 a,b,c β 5 PS M B 5 P 28 074 60 -2 63 28 4 8 0. 28 22 4 58 .3 7 a,b,c 28 52 2. 29 β 5i PS M B 8 P 28 0 62 73 -2 76 3 0 354 .2 6 22 6 59 .6 1 c 30 3 96 .2 7 β 6 P S M B1 P 20 61 8 29 -2 41 26 489 .3 7 23 5 48 .94 a,b,c 26 5 31. 3 8 β 7 PS M B 4 P 28 070 46 -2 6 4 29 2 04 .24 24 3 91. 78 a,b,c 29 24 6. 25 Ab br eviation: MW , molecular w eight. “-Met”: loss of N -t er minal methionine; “Matur e pr ot ein ”: loss of N -t er minal pr opeptide; “ac”: acet ylation; “phos”: phosphor ylation. β 1/ β 2/ β 5 and β 1i/ β 2i/ β 5i ar e specific sub
units of the std20 and i20S
, r espectiv el y. The most ab undant pr ot eof or ms identifi ed in F igur es 1 and 2A and B ar e indicat
ed in bold with the super
scr ipts a, b , and c , r espectiv el y.
MCP21, and as it is constituted of subunits of ~20 to ~30 kDa, it is specifically suited for top-down and intact protein MS analysis.8 We present here the comparative top-down analysis of in-house-produced std20S and commercial samples of purified std20S and i20S using VisioProt-MS.
Material and Methods
Reagents
All reagents were provided by Sigma-Aldrich unless otherwise specified. Commercial standard and immuno-20S were pur-chased from Enzo Life Science.
In-house purification of endogenous 20S
Endogenous 20S was purified from Hek293-EBNA cells grown to 80% confluency in Iscove’s Modified Dulbecco’s Medium (IMDM; Thermo Fisher) supplemented with 10% fetal bovine serum (FBS), 116 mg/mL L-Arginine, and 36 mg/ mL L-asparagine (Acros Organics) at 37°C and 5% CO2. Cells were then washed twice with phosphate-buffered saline (PBS) and stored at –80°C. On the day of experiment, 50 × 106 cells were lysed with 2 mL of lysis buffer (10 mM HEPES with pH 7.9, 10 mM KCl, 5 mM MgCl2, 10% glycerol, 10 mM adeno-sine triphosphate [ATP], 1% NP40, protease Complete and phosphatase PhosSTOP inhibitors from Roche), incubated for 15 minutes at 4°C, and sonicated (Bioruptor Plus; Diagenode). Non-soluble debris were removed by centrifugation (4000g for 15 minutes at 4°C) and the protein concentration in the supernatant was determined by detergent-compatible (DC) assay (Bio-Rad). Aliquots were kept at –80°C until analysis. Immunopurification of the endogenous 20S core proteasome was performed as described in Fabre et al.21
Intact protein and top-down MS analysis
Nano-LC-MS and MS/MS analyses of commercial or immunopurified 20S were performed on a nanoRS UHPLC system (Dionex) coupled to an LTQ-Orbitrap Fusion Tribrid mass spectrometer (Thermo Fisher Scientific). A total of 5 μL of sample at 0.3 µM was loaded onto a reverse-phase C4-precolumn (300 μm i.d. × 5 mm; Thermo Fisher Scientific) at 20 μL/min in 2% acetonitrile (ACN) and 0.2% formic acid (FA). After 5 minutes of desalting, the precolumn was switched online with an analytical C4 nanocolumn (75 μm i.d. × 15 cm; in-house packed with C4 Reprosil) equili-brated in 95% solvent A (5% ACN, 0.2% FA) and 5% solvent B (0.2% FA in ACN). Proteins were eluted using a binary gra-dient ranging from 5% to 40% (5 minutes) and then 40% to 99% (33 minutes) of solvent B at a flow rate of 300 nL/min. For the commercial 20S samples, the Fusion Tribrid (Thermo Fisher Scientific) was operated in single MS acquisition mode with the Xcalibur software (Thermo Fisher Scientific).
The spray voltage was set to 1900 V, the ion transfer tube tem-perature to 300°C, the RF lens to 60%, and the in-source dis-sociation to 50 V. The MS scans were acquired in the 700 to 2000 m/z range with the resolution set to 60 000 and using 10 µscans for averaging. For the intact protein and top-down MS analysis of the immunopurified std20s, the spray voltage was set to 1350 V, the ion transfer tube temperature to 270°C, the RF lens to 60%, and the in-source dissociation to 50 V. The MS and MS/MS scans were acquired in the 400 to 2000 m/z range with a resolution of 120 000 and using 3 µscans for aver-aging. Ions of interest were selected according to an inclusion list of 14 precursor masses (corresponding to the 20S subu-nits) that were analysed by MS/MS with the option “DDA if parent mass list not found” unchecked. The isolation window was set to 5 Th with electron-transfer/higher-energy collision dissociation (EThcD) fragmentation (electron-transfer disso-ciation [ETD]: 20 ms and higher-energy collision dissocia-tion [HCD]: 25%).
Data analysis and visualization
For MS traces, raw files were automatically deconvoluted with the rolling window deconvolution software RoWinPro8 and the proteoform footprints were visualized with VisioProt-MS v2.0.17 Top-down raw data were analyzed with Proteome Discoverer v2.2 (Thermo Scientific) using the ProSight PD Top-Down Low/High node. Briefly, intact protein spectra were deconvoluted with ReSpect (precursor mass between 20 000 and 30 000 Da and 100 ppm mass tolerance, charge state range between 15 and 35). Tandem mass spectrometry spectra were deconvoluted with Xtract (S/N threshold = 3, m/z range between 200 and 2000 Da, 60 000 resolution) and searched against a custom database including all human 20S subunits (generated in ProSight PC v4.0, Thermo Scientific). The search was performed in absolute mass mode with a fragment mass tolerance of 15 ppm and a precursor mass tolerance of 200 Da. The MS/MS and proteoform-spectrum matches were visualized with VisioProt-MS. All the figures were adapted from VisioProt-MS exports using Adobe Illustrator CS6 v16.0.0.
MS/MS Analysis of Immunopurified STD20s
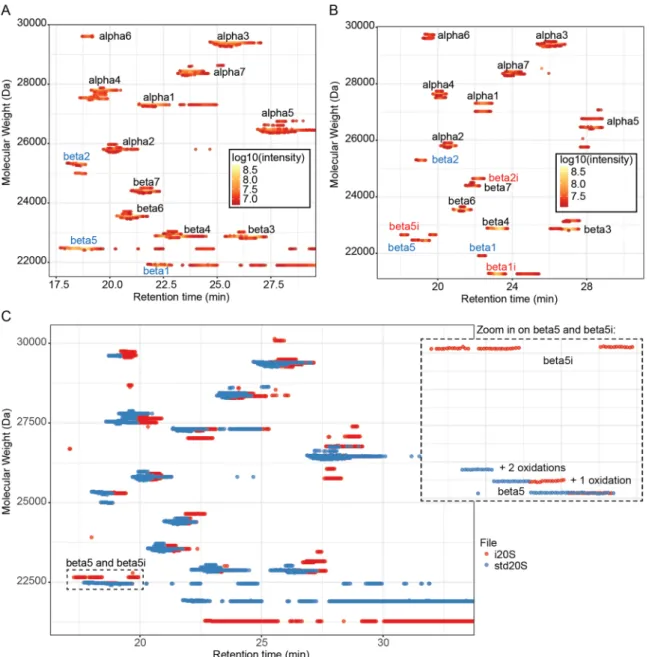
We analyzed the endogenous 20S immunopurified from human Hek293T-EBNA cells22 using intact protein and top-down MS. VisioProt-MS allowed the visualization of the most intense proteoforms based on their deconvoluted MWs (Figure 1A), and most of these were confirmed by MS/MS (Figure 1B). Besides the MS trace, the species selected for MS/MS during the top-down analysis are indicated by empty or filled circles for non-matched MS/MS and proteoform to spectrum matches, respectively. These can be dynamically explored with the “Show data labels” option in the sidebar
4 Bioinformatics and Biology Insights
menu, which triggers dynamic labeling of the data points on hovering. Then, passing the mouse over them informs on the proteoform identified with each MS/MS and their RT, inten-sity, and deconvoluted MW. It is also possible to highlight the MS/MS matched to specific proteoform(s) of interest such as β6 (PSMB1; Figure 1B, red points). The most intense proteo-forms identified in this sample are presented in Table 1 (indi-cated with the superscript “a”).
Beyond allowing an easy exploration of the identified pro-teoforms, this representation allows the quick detection of false identifications. For example, in the box “b” (Figure 1B), some MS/MS have been matched to proteoforms in an empty area of the LC-MS map and are most probably background noise. In addition, the single red point overlaid to the β7 subunit MS trace corresponds to an MS/MS that was wrongly matched to β6 (Figure 1B). This could be due to an incorrect estimation of the precursor MW during deconvolution (potential wrong charge state assignment), or a wrong proteoform to spectral matching, and should not be taken into account for further analysis.
In addition to facilitating data curation, the MS/MS mode of VisioProt-MS can be used to optimize the acquisition and search parameters. The dashed rectangle “a” in Figure 1B high-lights a proteoform that was not identified by MS/MS. We can see in this figure that several MS/MS were triggered on its elution, but none of them was matched to a protein sequence. This can be due to miss-adapted acquisition methods or search parameters that can be tuned to increase the number of proteo-forms identified. In this sample, α7 is mostly phosphorylated, as reported in Gersch et al.8
Comparison of the std20S and i20S
To demonstrate the advantages of VisioProt-MS in the context of comparative sample analysis, we chose the commercial sam-ples of std20S and i20S. Their LC-MS maps are presented in Figure 2, first alone with color-coded intensities (Figure 2A and B) and together for their direct comparison (Figure 2C). These graphical representations indicate the unexpected pres-ence of the subunits β1, β2, and β5 among the i20S-specific subunits of the i20S sample, thereby highlighting a contamina-tion by the std20S (Figure 2B).
Similar graphical representations can be used in other con-texts beyond heterogeneous complex analysis, such as identifi-cation of covalent drug binding,8 monitoring of protein maturation/processing, or identification of context-dependent post-translational modifications or protein variants.23-25 Besides zooming and dynamic labeling of the data points, VisioProt-MS allows the user to hide experiment-dependent background noise with the “Threshold” option of the sidebar menu. This defines the percentage of high-intensity MS signal that is visualized on the LC-MS map. It is also possible to mask/unmask sample traces by clicking on their legends, which facilitates the exploration of overlapping signals such as the ones of β5 in Figure 2C.
Conclusions
For many years, the composition of the 20S core particle of the human proteasome was analyzed with methods such as low-resolution two-dimensional (2D) sodium dodecyl sulfate polyacrylamide gel electrophoresis (SDS-PAGE) separation coupled with analytical techniques (Western blotting or Figure 1. Top-down analysis of immunopurified std20S: (A) 3D proteoform footprint of the LC-MS trace of 20S subunits generated with VisioProt-MS. The
names of the std20S subunits are indicated next to the corresponding signal. (B) The same sample analyzed with MS/MS fragmentation for identification and visualized with the MS/MS mode of VisioProt-MS. The MS trace is color-coded with the «Red/yellow/blue» scale, and the MS/MS identified as β6 are indicated in red. Gray empty and filled circles are MS/MS that were not identified or proteoform-spectrum matches, respectively. The 2 rectangular selections (in red dashed lines) highlight (a) a non-identified proteoform (corresponding to the phosphorylated α7—based on its MW), and (b) potential false identifications (filled circles that do not overlap with a clear deconvoluted MS trace). Both figures were drawn with a VisioProt-MS «Threshold» parameter of 80%. LC-MS indicates liquid chromatography coupled to mass spectrometry; MS, mass spectrometry; MW, molecular weight.
protein/peptide extraction followed by MS analysis).19,26 These methods prove the efficiency of 2D representations for map-ping proteoforms of complex samples. However, such strategies are experimentally heavy, require a high amount of starting material, and rely on a priori knowledge on the different proteoforms present in the samples. Intact protein and top-down MS remain limited in sensitivity and dynamic range. Furthermore, high-MW proteoforms are still very challenging to study with these techniques. Nevertheless, their ability to precisely measure proteoform MWs and fragment them in a system-wide setup already allows their application to the hypothesis-free exploration of complex samples.27 We believe
that this could open the doors to personalized medicine at the proteoform level but would rely on technological progresses that go along with an increasing need for dedicated tools to facilitate data analysis.
VisioProt-MS is an easy solution to visualize and inspect intact protein and top-down MS data. It quickly provides an overview of all the detected MWs, reflecting data quality and reproducibility regarding observed MWs, intensities, and RTs. It allows comparison of not only multiple LC-MS runs (including from different deconvolution suites), but also LC-MS and LC-MS/MS runs of the same sample. Furthermore, its dynamic features enable to pinpoint potential Figure 2. Comparison of commercial std20S and i20S using intact protein MS: (A, B) MS trace of the subunits of the std20S (A, threshold: 35%) and i20s
(B, threshold: 16%) visualized with VisioProt-MS in MS mode. The names of the identified subunits are indicated next to the corresponding signal. The subunits that are specific to the standard or immunoproteasome are indicated in blue and red, respectively. (C) overlay of the same samples for comparison of their proteoform composition (threshold: 35%). The MS trace is color-coded in function of the sample. A magnification of the area indicated with the dashed rectangular selection (“beta5 and beta5i”) is presented on the right. The names of the identified subunits are indicated next to the corresponding signal. The 3 beta5 traces correspond to the mature protein with 0, 1, or 2 oxidations. MS indicates mass spectrometry.
6 Bioinformatics and Biology Insights
new proteoforms, quickly reject wrongly assigned Proteoform Spectral Matches, and spot intense MS signals that remain unassigned.
Today, VisioProt-MS v2.0 is compatible with the following bioinformatics tools: RoWinPro,8 Intact Protein Analysis (BioPharma Finder 3.0, Thermo Fisher Scientific), DataAnalysis 4.2 (Bruker),9 TopFD (TopPIC Suite),10 and ProMex (Informed-Proteomics)11 for deconvoluted LC-MS data; and ProSight PD (Proteome Discoverer, Thermo), TopPIC (TopPIC Suite),10 and MSPathFinder (Informed-Proteomics)11 for the LC-MS/MS data. It is open source and has been developed to be easily adaptable to other formats that may materialize from future technological development. Alternatively, it can be adapted and included in more complex workflows. All the information concerning its features, com-patibility, and usages can be found in Locard-Paulet et al17 and on the associated online help (https://masstools.ipbs.fr/visio-prothelp.html).
Authors’ note
Jean Lesne is now affiliated with Centre de Biochimie Structurale, CNRS UMR5048, INSERM U1054, Université de Montpellier, Montpellier, France.
Author Contributions
MLP and JM conceived this commentary. JM and JL per-formed the experiments and MS analysis. MLP wrote the manuscript in consultation with JM, JL and MPB.
Data Availability
Raw files corresponding to the analysis of the commercial std20S (OFJMX180306_15.raw) and i20S (OFJMX180306 _18.raw) as well as immunopurified std20S in MS (OFJMX160905_42.raw) and MS/MS (OFJMX160905_30. raw) have been deposited to the MassIVE repository with the dataset identifier MSV000084069 (ftp://massive.ucsd.edu/ MSV000084069).
ORCID iDs
Julien Marcoux https://orcid.org/0000-0001-7321-7436 Marie Locard-Paulet https://orcid.org/0000-0003-2879-9224
RefeRenCeS
1. Tran JC, Zamdborg L, Ahlf DR, et al. Mapping intact protein isoforms in dis-covery mode using top-down proteomics. Nature. 2011;480:254-258.
2. Durbin KR, Fornelli L, Fellers RT, Doubleday PF, Narita M, Kelleher NL. Quantitation and identification of thousands of human proteoforms below 30 kDa. J Proteome Res. 2016;15:976-982.
3. Ntai I, Kim K, Fellers RT, et al. Applying label-free quantitation to top down proteomics. Anal Chem. 2014;86:4961-4968.
4. Smith LM, Kelleher NL. Proteoform: a single term describing protein complex-ity. Nat Methods. 2013;10:186-187.
5. Chen B, Brown KA, Lin Z, Ge Y. Top-down proteomics: ready for prime time?
Anal Chem. 2018;90:110-127.
6. LeDuc RD, Schwämmle V, Shortreed MR, et al. ProForma: a standard proteo-form notation. J Proteome Res. 2018;17:1321-1325.
7. Lermyte F, Tsybin YO, O’Connor PB, Loo JA. Top or middle? Up or down? Toward a standard lexicon for protein top-down and allied mass spectrometry approaches. J Am Soc Mass Spectrom. 2019;30:1149-1157.
8. Gersch M, Hackl MW, Dubiella C, Dobrinevski A, Groll M, Sieber SA. A mass spectrometry platform for a streamlined investigation of proteasome integrity, posttranslational modifications, and inhibitor binding. Chem Biol. 2015;22: 404-411.
9. Schmit P-O, Vialaret J, Wessels van Gool AJ, et al. Towards a routine applica-tion of top-down approaches for label-free discovery workflows. J Proteomics. 2018;175:12-26.
10. Kou Q , Xun L, Liu X. TopPIC: a software tool for top-down mass spectrome-try-based proteoform identification and characterization. Bioinformatics. 2016;32:3495-3497.
11. Park J, Piehowski PD, Wilkins C, et al. Informed-proteomics: open-source soft-ware package for top-down proteomics. Nat Methods. 2017;14:909-914. 12. Durbin KR, Tran JC, Zamdborg L, et al. Intact mass detection, interpretation,
and visualization to automate top-down proteomics on a large scale. Proteomics. 2010;10:3589-3597.
13. Plymire DA, Wing CE, Robinson DE, Patrie SM. Continuous elution proteo-form identification of myelin basic protein by superficially porous reversed-phase liquid chromatography and Fourier transform mass spectrometry. Anal Chem. 2017;89:12030-12038.
14. Lee S-W, Berger SJ, Martinović S, et al. Direct mass spectrometric analysis of intact proteins of the yeast large ribosomal subunit using capillary LC/FTICR.
Proc Natl Acad Sci U S A. 2002;99:5942-5947.
15. Carel C, Marcoux J, Réat V, et al. Identification of specific posttranslational O-mycoloylations mediating protein targeting to the mycomembrane. Proc Natl
Acad Sci U S A. 2017;114:4231-4236.
16. Parra J, Marcoux J, Poncin I, et al. Scrutiny of Mycobacterium tuberculosis 19 kDa antigen proteoforms provides new insights in the lipoglycoprotein biogenesis paradigm. Sci Rep. 2017;7:43682.
17. Locard-Paulet M, Parra J, Albigot R, et al. VisioProt-MS: interactive 2D maps from intact protein mass spectrometry. Bioinformatics. 2018;35:679-681. 18. Thibaudeau TA, Smith DM. A practical review of proteasome pharmacology.
Pharmacol Rev. 2019;71:170-197.
19. Bousquet-Dubouch M-P, Fabre B, Monsarrat B, Burlet-Schiltz O. Proteomics to study the diversity and dynamics of proteasome complexes: from fundamentals to the clinic. Expert Rev Proteomics. 2011;8:459-481.
20. Bousquet-Dubouch M-P, Baudelet E, Guérin F, et al. Affinity purification strategy to capture human endogenous proteasome complexes diversity and to identify proteasome-interacting proteins. Mol Cell Proteomics. 2009;8: 1150-1164.
21. Fabre B, Lambour T, Garrigues L, et al. Label-free quantitative proteomics reveals the dynamics of proteasome complexes composition and stoichiometry in a wide range of human cell lines. J Proteome Res. 2014;13:3027-3037.
22. Guillaume B, Chapiro J, Stroobant V, et al. Two abundant proteasome subtypes that uniquely process some antigens presented by HLA class I molecules. Proc
Natl Acad Sci U S A. 2010;107:18599-18604.
23. Ntai I, Fornelli L, DeHart CJ, et al. Precise characterization of KRAS4b proteo-forms in human colorectal cells and tumors reveals mutation/modification cross-talk. Proc Natl Acad Sci U S A. 2018;115:4140-4145.
24. Zhou M, Paša-Tolić L, Stenoien DL. Profiling of histone post-translational modifications in mouse brain with high-resolution top-down mass spectrometry.
J Proteome Res. 2017;16:599-608.
25. van de Waterbeemd M, Tamara S, Fort KL, et al. Dissecting ribosomal particles throughout the kingdoms of life using advanced hybrid mass spectrometry meth-ods. Nat Commun. 2018;9:2493.
26. Drews O, Wildgruber R, Zong C, et al. Mammalian proteasome subpopulations with distinct molecular compositions and proteolytic activities. Mol Cell
Pro-teomics. 2007;6:2021-2031.
27. Savaryn JP, Toby TK, Catherman AD, et al. Comparative top down proteomics of peripheral blood mononuclear cells from kidney transplant recipients with normal kidney biopsies or acute rejection. Proteomics. 2016;16:2048-2058.