READ THESE TERMS AND CONDITIONS CAREFULLY BEFORE USING THIS WEBSITE. https://nrc-publications.canada.ca/eng/copyright
Vous avez des questions? Nous pouvons vous aider. Pour communiquer directement avec un auteur, consultez la
première page de la revue dans laquelle son article a été publié afin de trouver ses coordonnées. Si vous n’arrivez
Questions? Contact the NRC Publications Archive team at
PublicationsArchive-ArchivesPublications@nrc-cnrc.gc.ca. If you wish to email the authors directly, please see the first page of the publication for their contact information.
NRC Publications Archive
Archives des publications du CNRC
This publication could be one of several versions: author’s original, accepted manuscript or the publisher’s version. / La version de cette publication peut être l’une des suivantes : la version prépublication de l’auteur, la version acceptée du manuscrit ou la version de l’éditeur.
Access and use of this website and the material on it are subject to the Terms and Conditions set forth at
The Performance of corrosion inhibiting systems in concrete bridge
barrier walls - 5 years of field data
Qian, S. Y.; Cusson, D.; Glazer, R.; Hoogeveen, T. J.
https://publications-cnrc.canada.ca/fra/droits
L’accès à ce site Web et l’utilisation de son contenu sont assujettis aux conditions présentées dans le site LISEZ CES CONDITIONS ATTENTIVEMENT AVANT D’UTILISER CE SITE WEB.
NRC Publications Record / Notice d'Archives des publications de CNRC: https://nrc-publications.canada.ca/eng/view/object/?id=d79f5a52-7341-414d-aabb-51b11083bf56 https://publications-cnrc.canada.ca/fra/voir/objet/?id=d79f5a52-7341-414d-aabb-51b11083bf56
The Performance of corrosion inhibiting systems in concrete bridge barrier walls - 5 years of field data
Qian, S.; Cusson, D.; Glazer, R.; Hoogeveen, T.
A version of this document is published in / Une version de ce document se trouve dans :
Infra 2002 International Conference on Urban Infrastructure, Montreal, Quebec, Nov. 25-27, 2002, pp. 1-20
www.nrc.ca/irc/ircpubs
THE PERFORMANCE OF CORROSION INHIBITING SYSTEMS IN CONCRETE BRIDGE BARRIER WALLS – 5 YEARS OF FIELD DATA S. Qian, D. Cusson, R. Glazer, T. Hoogeveen
Institute for Research in Construction, National Research Council, Canada
ABSTRACT: Repairs to corrosion-damaged reinforced concrete structures are inconvenient and expensive to the users and owners. Estimates place their cost in the billions of dollars, not including the environmental toll of repeated repairs. Corrosion inhibiting systems have long been considered one of the best solutions to the corrosion problem in steel reinforcement, but limited information is available on their actual performance and effectiveness in the field.
The NRC’s Institute for Research in Construction has been working with the Ministry of Transportation of Quebec and seven product manufacturers to study the field performance of inhibiting systems on the Vachon Bridge near Montreal. Different corrosion-inhibiting systems were applied to eight consecutive spans on one of the bridge's reconstructed barrier walls in 1996. They included concrete admixtures, reinforcing steel coatings, and concrete surface coatings/sealers. Two remaining spans of the barrier wall served as control sections. To monitor the effectiveness of the corrosion inhibiting systems, each span was equipped with embedded temperature and humidity sensors, and reference electrodes. On site corrosion surveys, including half-cell potential and corrosion rate measurements, along with concrete coring were conducted yearly. Although the corrosion rates measured on the barrier wall reinforcement were still relatively small after 5 years, the results indicate that the concrete admixtures, especially the nitrite-based type, performed better than the other systems in reducing or delaying the corrosion of reinforcement in the concrete.
INTRODUCTION
Corrosion inhibitors have been considered as one of the most user-friendly and cost-effective solutions to the wide spread problem of corrosion in reinforced concrete structures. They have been increasingly used in both new and existing reinforced concrete bridges during the last fifteen years. Earlier studies on corrosion inhibitors were focused mainly on sodium benzoate [1, 2], various nitrites (sodium, potassium and barium) and chromates/dichromates [3, 4] as concrete admixtures for the inhibition of corrosion in reinforced concrete. None of these inhibitors performed satisfactorily, often producing detrimental effects on the strength development of concrete. A study of the efficiency of calcium and sodium nitrite as corrosion inhibitors was reported in the 1970s [5]. A calcium nitrite became commercially available, it has been studied and used extensively for reinforced concrete structures subjected to chlorides [6, 7, 8]. During the 1990s, a number of organic inhibitors such as various amines, alkanolamines, their salts with organic and inorganic acids [9], and emulsified mixtures of esters, alcohols and amines [10] were developed.
Most of the corrosion inhibiting products on the market claim inhibitory mechanisms based on laboratory experiments or empirical pass/fail results obtained from periodic field tests. Data on long-term field performance and an understanding of the effects of the factors that govern the in-service mechanisms of these inhibitors are very limited in the literature.
In this paper the long-term field performance of commercial corrosion inhibiting systems were assessed in ten consecutive spans of a newly reconstructed barrier wall at the Vachon Bridge, located north of Montreal, Canada. Field corrosion measurements, such as half-cell potential, linear polarization, concrete resistivity and measurements on special embedded rebar ladders were performed. Key environmental conditions and properties of the barrier wall were continuously monitored by embedded sensors to assist the field evaluation of these inhibiting systems.
EXPERIMENTAL Field installation
The rehabilitation work for this study included rebuilding ten 34-m spans of a concrete barrier wall using different corrosion inhibiting systems installed according to the manufacturers’ requirements. Steel reinforcement of the barrier wall consisted of eight 15-mm longitudinal bars in the wall cross-section (including 4 bars near the front surface), and 15-mm transverse bars spaced at 230 mm along the wall length. The grade of steel was 400R (CAN/CSA G30.18-M), except in one of the 10 test spans (Span 12) in which epoxy-coated reinforcement was used. The concrete had a water-cement ratio of 0.36 and a 28-day compressive strength of 45 MPa tested on moist-cured 150x300 mm cylinders. More details on the field site, including the concrete mixture design and a layout of the test spans can be found elsewhere [11].
The commercial names of the corrosion inhibiting systems tested in this study were not identified to maintain confidentiality as requested by the product suppliers. As shown in Table 1, each test system has been given an arbitrary label and a brief generic description.
Table 1: Description of corrosion inhibiting systems tested
System Generic description
Control Carbon-steel reinforcement Epoxy Epoxy-coated reinforcement
A Cement-based rebar coating + cement-based concrete coating B Organic-based concrete admixture
C Organic/inorganic-based concrete admixture D Cement-based rebar coating
E Organic-based concrete admixture F Organic-based concrete admixture
G Organic-based concrete admixture + water-based concrete sealer H Inorganic-based concrete admixture
This field program was composed of: (i) continuous remote data acquisition of temperature, relative humidity, electrochemical potential and longitudinal strain with embedded sensors and (ii) on-site corrosion surveys conducted on the ten spans of the bridge barrier wall and on special rebar ladders embedded in the barrier wall. The various inhibiting systems included one, two or three of the following products: concrete admixture, rebar coating, concrete coating, and concrete sealer as summarised in Table 1. Remote monitoring system
Embedded reference electrodes (Forces Institutes Model ERE20) were used to monitor the electrochemical potential at specific locations on the steel reinforcement. Relative humidity (RH) and temperature sensors (Model Humitter 50Y by Vaisala Inc.) were installed inside and outside the barrier wall. Custom-made strain gage units were placed at key locations in the barrier wall to measure the strains in the repaired structure. All sensors used in this project were calibrated before installation in the barrier wall. The central processing unit of the data acquisition system is the Datataker DT-505, manufactured by Data Electronics Ltd. The sensors were properly protected in concrete and carried out into junction boxes and connected to the data loggers [12].
On-site corrosion measurements
On-site corrosion surveys were performed once a year on the 10 bridge spans and on the special rebar ladders. The survey included measurement of half-cell potential, corrosion rate and concrete resistivity. A saturated copper/copper sulphate reference electrode (CSE) and a Fluke multimeter 867B were used to measure the half-cell potentials following the procedure provided in ASTM C876-99. The measurements were taken at 110 mm, 345 mm, 550 mm and 780 mm from the top of the barrier walls and horizontally at 300-mm intervals over the central 15-m section the barrier wall. The half-cell potential readings were also taken at the centre point of each bar of the two special rebar ladders embedded in every bridge span. These rebar ladders had different concrete covers after being embedded in the barrier wall, with only 13 mm of concrete cover for the upper bar and 25 mm, 38 mm and 50 mm respectively for the others. This design allows for the earliest possible evaluation of the performance of applied corrosion-inhibiting systems. Corrosion rates and concrete resistivity were measured using sensors A and B of a GECOR 6 instrument (James Instruments Inc., Chicago Illinois). In each span, measurements were taken on the vertical and horizontal bars at cracked and uncracked locations. Two to three readings were taken and then averaged at each location.
RESULTS USING REMOTE MONITORING SYSTEM Overview of the field exposure conditions
Over the 5-year duration of the project, the bridge structure has experienced harsh climatic conditions, as typically encountered in Canada. Ambient temperature extremes ranged
from –25°C in the winter to +30°C in the summer. Several wet-dry cycles (30-100% RH) and up to 23 freeze-thaw cycles were measured. Furthermore, severe restrained shrinkage cracking was observed in the barrier wall just a few days after construction [13]. The transverse cracks had an average spacing of 0.8 m and a maximum width of 0.3 mm. This raised a concern for premature rebar corrosion due to moisture and salt ingress. Such cracking usually leads to early (pitting) corrosion of the reinforcing steel and eventually results in the spalling of the protective concrete cover.
Relative humidity and temperature
Reinforcement corrosion is influenced by the moisture level in the concrete, since it may affect the rate of both carbonation and chloride penetration as well as the electrical resistivity and availability of oxygen [14]. Similarly, temperature influences all the processes involved in corrosion.
For the assessment of the moisture condition in a concrete structure, relative humidity (RH) measurements are often taken as an indirect method. Measured RH, however, should not be used directly for its characterisation of the moisture content in concrete. Daily and seasonal temperature cycles strongly affect measured RH values. A procedure developed by Pruckner et al. [14] was used to correct the RH data for temperature using the following equation: − ⋅ − ⋅ = T BT A RH AT RH RH T T K 1 298 1 ) ( 100 ln exp 298 λ (1)
where RH298K (in %) is the corrected RH normalised to a temperature of 298K (25°C); RHT
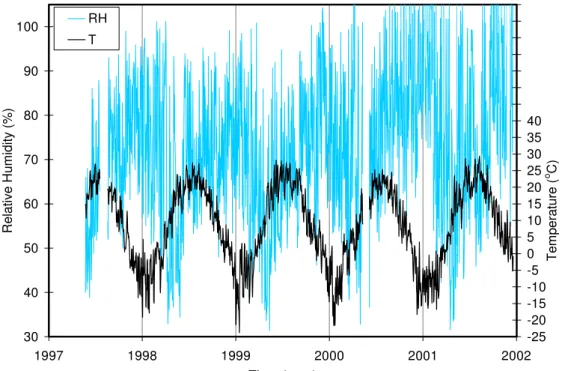
(in %) is the RH measured in concrete at a given temperature; T (in Kelvin) is the actual concrete temperature; parameters A (0.11784 N/m) and B (0.000154 N/m/K) are constants that define the surface tension of the pore water as a function of the concrete temperature; and λ (0.93) is an empirical constant calibrated using the RH and temperature data measured at the Vachon bridge. Equation 1 was not used to correct the ambient air RH. Figure 1 illustrates the ambient RH and ambient temperature measured at the bridge from May 1997 to December 2001. The ambient RH varied from 30 % to 100 % with the lower RH values occurring typically at the end of winter in April-May. It should be noted that some values of RH exceeded 100 % by about 5 %, which is within the precision of the sensor for such high levels of RH. Typically, the ambient temperature measured at the bridge varied from about –25°C in January to approximately +30°C in August.
Figure 2 shows the typical RH and temperature curves measured in concrete at the top and the bottom of the barrier wall. In general, the temperature measured over the years is
independent of the location of the sensor (top or bottom of barrier wall) and the span in which it is embedded. This indicates that the presence or type of corrosion inhibitors had no effect on the thermal properties of concrete. The concrete temperature typically varied from approximately –15°C in January to +40°C in August. The temperature in the centre of the barrier wall was about 10°C warmer than the ambient temperature at any given time of the year, as expected. This was due mainly to two factors, which contributed towards increasing the concrete temperature: solar radiation and heat capacity of concrete.
For any given span, the RH at the top of the barrier wall was generally similar to the RH measured at the bottom. The difference was usually small and never exceeded 10 %. In general, the concrete RH followed a seasonal pattern with high RH values in May-June and low RH values in December-January, which was not in phase with the ambient RH shown in Figure 1. The concrete RH also decreased over the years, as expected, from high RH values when the concrete was young and wet, to lower RH values, 5 years later, as a result of drying and further hydration of cement.
The RH in concrete was also found to differ from span to span, especially as the concrete aged. For instance, Spans E and G reached RH values as low as 70 % during the winter 2001, while the RH in Span 12 (epoxy) and Span D only decreased to 85 % during the same period of time. However, during the following summer, the concrete RH of these 4 spans increased to above 90 %.
Assessing the performance of concrete based on its rate of drying may be difficult and depends on the application for which the concrete was made. With regard to corrosion, it is usually accepted that reinforcement corrosion may not occur in concrete if the RH is kept under 70%. On the other hand, fully saturated concrete (>95% RH) can also reduce corrosion rate because the oxygen level in the concrete pores is too low. Concrete with partially saturated pores where the RH is in the range of 75-95% is most vulnerable to reinforcement corrosion, since all required elements for the initiation of corrosion are present in sufficient quantities (oxygen, water and steel). In this study, all spans had concrete RH values in the critical range (75-95%) for long periods of time.
With regard to shrinkage cracking, the smaller the change in volume, the better, especially in concrete structures where movement is severely restricted. Span 12 performed the best in that regard due to its apparently lower rate of wetting and drying. However, the different rates of wetting and drying may not be due solely to the presence or type of corrosion inhibiting system. Other factors may have contributed such as the variation in quality of the concrete from one pour to the next, and perhaps the distance between a given RH sensor and the nearest microcracks in which the moisture level may be different.
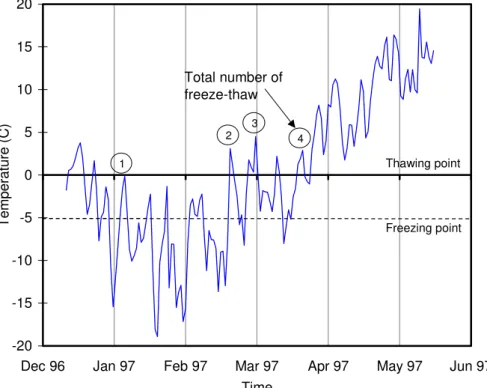
The temperature curves presented earlier were analysed further to estimate the number of freeze-thaw cycles that the concrete was subjected to during the winter season. Neville [15]
indicated that capillary water in mature concrete freezes at about -5˚C due to impurities in
long enough (few hours). Figure 3 illustrates the procedure used to calculate the number of freeze-thaw cycles. During the winter of 1997, 4 cycles were found to occur in Span 21. Figure 2 gives the number of freeze-thaw cycles that occurred during all subsequent winters in the control Span 21. Over the 5-year duration of the study, a total of 23 freeze-thaw cycles was estimated. Since the temperature is the same in all test spans at any given time, it is assumed that these statistics apply to each test section in this study.
Electrochemical potential
In order to monitor the effectiveness of the different corrosion inhibiting systems over
time, manganese dioxide (MnO2) reference electrodes were installed at the centre of all test
spans to monitor the electrochemical potential of the reinforcement.
The stability of the MnO2 reference electrodes was verified on a yearly basis by taking
several half-cell potential measurements with a calibrated reference electrode placed on the
surface of the barrier wall near the location of each embedded MnO2 electrode. It was
found that their potential shifted gradually over the years. The potential of MnO2
electrodes is known to be stable in a constant environment. When the electrodes were embedded in concrete, however, the change in the environmental conditions caused their electrochemical potential to reach a new equilibrium with the surrounding concrete. As a
result, the potential of MnO2 electrodes has been gradually shifting to a new stable value.
Half-cell potential readings of the MnO2 electrodes were taken annually in May-June at the
surface of the barrier wall with a standard external reference electrode (Cu/CuSO4). The
readings were used to correct the data measured internally by the MnO2 electrodes. For
each test span, a regression analysis was conducted on the measured calibration data to fit a non-linear equation as a function of time. Figure 4 illustrates how the internal electrode data was corrected for Span 21 (control span). The corrected half-cell potential data was obtained by subtracting the calibration data specific for Span 21 from the uncorrected
readings measured by the MnO2 reference electrode in Span 21. One can see the change in
the overall slope from positive before correction to negative after correction, which is normally expected.
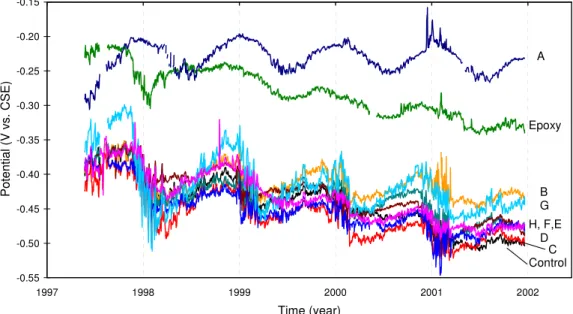
Figure 5 presents the corrected electrochemical potential data measured at the bridge from May 1997 to June 2001. In general, it is seen that all curves show a seasonal variation of the potential with the least negative values occurring during the cold winter months (November–February) and the most negative values of potential occurring in warmer weather, as expected.
The half-cell potential curves for Spans 12 and A stand above all other curves. This is probably due to the high electrical resistance induced by the presence of the coating on the reinforcement of Spans 12 and A. In this case, the input impedance of the data acquisition
system of 107 Ohms was not high enough. The current flow, which had to go through the
drop resulting in a shift of the half-cell potential towards less negative values. The above observations were validated by the potential readings taken during the annual corrosion surveys.
It is therefore important in the analysis to consider the relative changes in half-cell potential over time. In this regard, the curves of Spans A and B show the smallest overall decrease in potential over the years. This may be an indication of the effect of these corrosion-inhibiting systems in preventing corrosion initiation.
Longitudinal strains
Figure 6 shows the measured mechanical strain along with the calculated thermal strain in the longitudinal direction of the barrier wall of the control Span 21. Strain measurements in the other test sections were found to follow similar patterns and have similar range of values. The mechanical strain was measured directly by the embedded strain gauges, which were fully compensated against temperature and bending effects. The thermal strain was calculated based on the history of temperatures measured in the concrete.
The mechanical strain varied from approximately –50 µε to +50 µε over time, showing a
pattern that appears to be 180° out-of-phase with the variation in concrete RH. A crack survey conducted on Span 21 revealed the presence of a crack in the concrete barrier wall at the location of the strain gauge. The strain gauge was in effect monitoring the opening and closing of the crack as a function of the change in concrete RH. For instance, when concrete dried, the resulting shrinkage increased the crack opening, and when concrete swelled the opposite effect took place.
The thermal strain varied from approximately -350 µεto +250 µε. It was observed that the
mechanical strain was relatively small compared to the thermal strain. This is especially true when initial strains are not measured. This was the case in this study because the remote monitoring system became fully operative only in May 1997, which was about half a year after construction (the cold weather in the fall of 1996 prevented the full installation of the data loggers). However, a detailed analysis [13] was conducted using a 2D numerical model along with some available field data to estimate the extent of deformations shortly after construction of the barrier wall. It was found that strains due mainly to thermal contraction and autogenous shrinkage developed rapidly within 36 hours of construction, and resulted in high tensile stresses in the barrier wall causing it to crack.
RESULTS OF ON-SITE CORROSION SURVEYS Half-cell potential
The half-cell potentials measured along the top three horizontal bars in the barrier wall were analysed using the linear regression method and are shown in Fig. 7. The half-cell potentials show gradual shifting toward more negative values in almost all spans, due
probably to the depletion of the oxygen concentration in the concrete (since high-density concrete was used) or the initiation of reinforcing steel corrosion at cracked areas.
According to the ASTM standard (C876-99), there is a 90% probability that reinforcing
steel corrosion is occurring if half-cell potentials vs. Cu/CuSO4 are more negative than
–350 mV. This guideline is valid only when regular concrete is used and the concrete thickness is 4 cm to 6 cm, and it is not saturated by water. Under other conditions, the interpretation of the half-cell results requires modification based on knowledge of the particular corrosion conditions. For instance, oxygen depletion caused by water-saturated concrete can shift half-cell potential more negatively by 100 mV to 200 mV [16]. However, if the potential is substantially negative and overcomes the shift caused by other factors and at the same time the corrosion current shows high values, then a high probability of steel corrosion can be predicted with confidence.
For all spans, the half-cell potential values were about –350 mV starting in 1997 (except in Span 12 (epoxy) and G). Results were much more negative than –350 mV in 1998. According to the ASTM standard, all spans should be rated as having a high probability of corrosion. Obviously, it is not suitable to rate all these spans as having a high probability of corrosion within one or two years reconstruction of the barrier wall. Since high-density concrete was used, the oxygen depletion in the concrete could result in the negative potential shift. It was noticed that earlier age cracks had appeared in many spans. These cracks could cause early corrosion of reinforcing steel near these areas due to moisture, oxygen and salt ingress, leading to the localized negative potential shift.
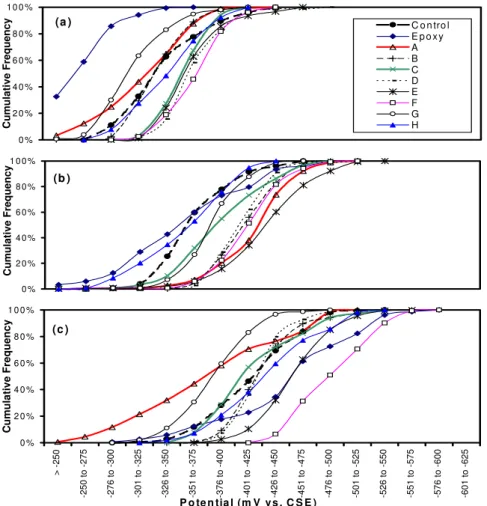
Figure 8 show the cumulative frequencies of half-cell potentials obtained from the 10 spans surveyed in 1997, 1999 and 2001. It can be seen that the half-cell potentials were less negative and spread over a narrower range (except Span 12 (epoxy)) in 1997 (Fig. 8a) than in 1999 (Fig. 8b). The half-cell potentials shifted toward a more negative value and the potentials spread over a wider range in 2001 (Fig. 8c). This indicates that the corrosion probability of reinforcement has increased. The degree of this increase is influenced by the effectiveness of applied corrosion-inhibiting systems. The cumulative frequency curve on Span 12 shows less negative half-cell potentials than all other spans in 1997 due to the high resistance of epoxy coating on the reinforcement surface. Its curve had a substantial negative shift and exhibited a shape with three plateaus in the 2001 results (Fig. 8c). This is probably due to the galvanic effect of corrosion on the epoxy-coated rebar. Some areas with damaged or scratched coatings, or near the cracked areas, would corrode more than the other areas leading to a wider potential spread.
It has also been noted that Span G showed quite high (less negative) half-cell potential readings in 1997, 1999 and 2001. This is probably related to the high resistance of the concrete due to the corrosion-inhibiting system applied on this span. Span F showed the most negative potential followed by the span with epoxy-coated rebar and Span E. The control span showed an average half-cell reading while Spans G and A showed less negative cell potential. It seems the inhibiting systems have some effect on the
half-cell potential of rebar in the concrete. Therefore, the evaluation of the corrosion in these concrete spans cannot be based on the half-cell potential values only. It is necessary to analyse the results together with other corrosion measurements.
Corrosion rate and concrete electrical resistance
The average corrosion rates obtained on 10 spans are shown in Fig. 9. They were calculated based on the results from field measurements at cracked locations (C) and uncracked locations (UC) on each span. The corrosion rates were low in all spans in 2001 although some spans showed relatively high rates in 1997 and 1998 probably due to process of the formation of the oxide film. The rates decreased with time in almost all spans probably related to the presence of the corrosion inhibiting systems or to oxygen depletion at the metal surface. Comparing the corrosion rate obtained at different locations, higher rates are observed at cracked locations than at uncracked locations in most spans, as expected. On the span with epoxy-coated rebar, the corrosion rate was small, especially at uncracked locations, but increased continuously over time, probably due to the metal oxidation at the damaged or scratched areas of the epoxy coating near the cracked areas. In Span G, equipment limitations made it impossible to measure the corrosion rates in the first three years, due to the poor conductivity of concrete as a result of the application of this corrosion-inhibiting system on the concrete. Considering the overall corrosion rates
measured in 2001, they were in the low rate category (≤0.5 µA cm2) [17] in all spans and
locations, indicating the effects of inhibiting systems. More time is needed to evaluate the effectiveness of the corrosion-inhibiting systems.
The results of on-site concrete resistivity are shown in Fig. 10. Concrete resistivity was relatively small in 1997 in most spans, probably due to the high moisture content in the new concrete. It increased with time in most spans except in Spans 12 (epoxy) and 21 (control). In Span 12, the resistivity decreased with time, probably due to the deterioration of the epoxy coating on the rebar. GECOR6 was used to measure the resistivity between the rebar surface and a counter electrode, which was placed on the top of the concrete cover. Although a pulse signal was used to perform the measurement, the resistivity of epoxy on the rebar surface was still included in the overall resistivity readings. Therefore, the coatings on the rebar can lead to a higher reading. The development of corrosion at the areas where the epoxy coating was very thin or had been scratched can lead to reduce overall resistivity. Due to some measurement difficulties, the resistivity results on Span G were not shown in Fig. 10.
Measurements on the rebar ladders
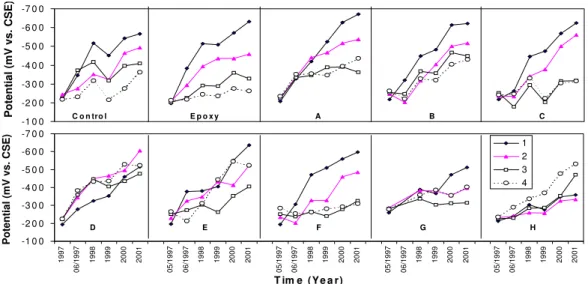
Half-cell potentials measured on the special rebar ladders in each span are shown in Fig. 11. The numbers 1, 2, 3 and 4 represent the rebar level from top to bottom with concrete cover thickness of 13 mm, 25 mm, 38mm and 50 mm, respectively. It can be clearly seen that the half-cell potentials become more negative with time in all spans. Half-cell potentials have the most significant change on the top bars (Bar 1) and the least change on
the lower bars (Bars 2, 3 and 4) in most spans (except in Spans D and H). This is because corrosion occurred sooner at the locations with a thinner concrete cover due to the salt ingress to the reinforcement. The half-cell potentials had reached –500 mV to –600 mV vs.
Cu/CuSO4 on the top bars with thinner concrete cover (oxygen depletion was not likely) in
many spans indicating a high corrosion probability. On Span D, the half-cell potential difference between the bars is the smallest, although they also shifted to more negative values. On Span H, half-cell potentials on lower bars changed more significantly than on the top ones. This was not expected. The reason behind this unusual result is still not clear. The corrosion rate was measured on the top two bars of embedded ladders in these 10 spans as shown in Fig. 12. The corrosion rate was only measured on the top two bars, because GECOR6 probe A could not fit on the areas for the measurements of the lower two bars due to the geometry of the barrier wall. The corrosion rate was much higher on the top bar than on the second bar in most spans (except in Spans D and H). This is because the top bar has a thinner concrete cover (13 mm) than the second bar (25 mm). Therefore, it takes less time for chloride to reach the reinforcing bars. On Spans E and G, a horizontal crack and a rust stain along the top rebar were noticed. This is consistent with high corrosion rates observed at these locations in 2001. The corrosion rate on Span G was not measured in the first three years due to the poor conductivity of the concrete caused by the application of this corrosion-inhibiting system.
In Spans D and H, the corrosion rate was quite low on both the top and second bars of ladders. Recall the half-cell potential behaviour (Fig. 11), which was also different from other spans. It is clear that both potential and current behaviours are related to the specific corrosion-inhibiting systems applied on the spans.
Chloride ion content and profile
Chloride ion contents were measured to assess the ability of the inhibiting systems to prevent the ingress of chloride ions. The total content of chloride ions by weight of concrete was determined by the potentiometric titration of chloride with silver nitrate described in ASTM C114-00. The test was carried out in the 10 concrete spans at four depths (0 mm to 13 mm, 13 mm to 25 mm, 25 mm to 50 mm, and 50 mm to 75 mm) and at four different times. The results are shown in Fig. 13. Each data point is the average of two tests. The initial chloride ion content was also measured on cylinders of concrete cast in the field but not exposed to de-icing salts. An average value of 0.006% (weight of concrete) and a standard deviation of 0.0009% were found, which can be considered negligible. In general, the chloride ion content increases significantly over time. In the first 13 mm of concrete, the chloride ion concentration in most spans is very high, exceeding the critical threshold value of 0.1% by mass of concrete [18] even after six months of exposure to de-icing salts (May 1997). Spans G and H seem to have better performance as their chloride concentration is about 0.4% in 2001, which was lower than for the other spans.
The chloride content also decreased significantly with the concrete depth. The range of 25 mm to 50 mm corresponds to a depth where the reinforcement would normally be located in older bridges, since most of the corrosion-inhibiting systems tested in this study can be used in rehabilitation applications as well. The chloride concentration in all spans was well below the 0.1% threshold value after the first two winters (1997-1998). Concrete in Spans A, C, E, G and H was still below the chloride threshold limit in 2000. By 2001, all concretes had exceeded the critical threshold value. Concrete E has the best performance by exceeding the corrosion threshold value by only 20% after 4.5 years at the depth of 25 mm to 50 mm.
The 50 mm to 75 mm depth is where the reinforcement is located in the Vachon Bridge barrier walls. All concretes had chloride ion concentrations below the threshold value of 0.1% after 4.5 years. Concretes E, F and H are among the ones that blocked chloride ions the most effectively at the depth of 50 mm to 75 mm based on the 2001 results.
Corrosion of reinforcing steel should not begin if the concrete cover is between 50 mm and 75 mm, since the chloride concentration is below the threshold. However, corrosion is very likely to develop with cracked concrete when the chloride concentration is high. This is probably the reason for localized corrosion causing the half-cell potential to shift to more negative values.
COMPARISON OF PERFORMANCE AND RANKING
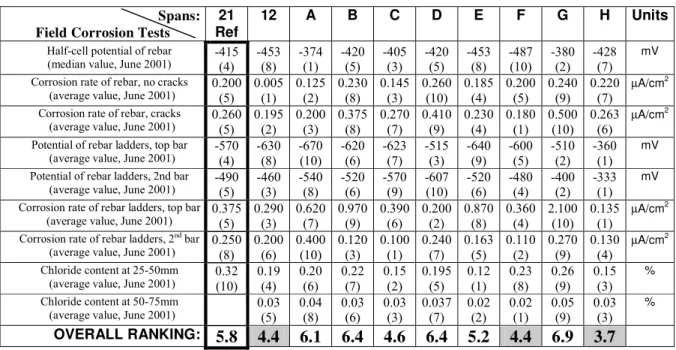
The relative performance of the corrosion-inhibiting systems varied from one test to another. Some systems performed well in one specific test but not in another. This made the identification of the effective corrosion-inhibiting systems difficult and challenging. To provide a meaningful comparison of the performance and identify the effective systems, a practical approach was used and is defined below. During the process of ranking, only the tests that directly related to the corrosion performance were selected and are listed.
The results of the tests are summarised in Table 2 along with their respective ranking, indicated in parenthesis underneath each result. For example, the first field-test listed in the table is the half-cell potential measured on the main reinforcement. For this particular test, System F had the most negative half-cell potential (the median value of –487 mV measured in June 2001) and obtained a performance ranking of 10 (worst performance). In this test, the difference in potential between the first and last systems in the group is not large, at only 113 mV. It is possible to find two systems with the same rank in a given test if their results are identical (e.g., Systems B and D in the first field-test).
An overall performance ranking of the various systems was determined. It is the arithmetic average of the ranks for a given system as shown in the row entitled “Overall ranking” in Table 2. The system with the lowest overall number is considered to be the most effective. Only best and second-best systems were marked as shaded cells in this table.
Table 2: Performance ranking of the corrosion inhibiting systems Spans:
Field Corrosion Tests
21 Ref
12 A B C D E F G H Units
Half-cell potential of rebar (median value, June 2001)
-415 (4) -453 (8) -374 (1) -420 (5) -405 (3) -420 (5) -453 (8) -487 (10) -380 (2) -428 (7) mV Corrosion rate of rebar, no cracks
(average value, June 2001)
0.200 (5) 0.005 (1) 0.125 (2) 0.230 (8) 0.145 (3) 0.260 (10) 0.185 (4) 0.200 (5) 0.240 (9) 0.220 (7) µA/cm2 Corrosion rate of rebar, cracks
(average value, June 2001)
0.260 (5) 0.195 (2) 0.200 (3) 0.375 (8) 0.270 (7) 0.410 (9) 0.230 (4) 0.180 (1) 0.500 (10) 0.263 (6) µA/cm2 Potential of rebar ladders, top bar
(average value, June 2001)
-570 (4) -630 (8) -670 (10) -620 (6) -623 (7) -515 (3) -640 (9) -600 (5) -510 (2) -360 (1) mV Potential of rebar ladders, 2nd bar
(average value, June 2001)
-490 (5) -460 (3) -540 (8) -520 (6) -570 (9) -607 (10) -520 (6) -480 (4) -400 (2) -333 (1) mV Corrosion rate of rebar ladders, top bar
(average value, June 2001)
0.375 (5) 0.290 (3) 0.620 (7) 0.970 (9) 0.390 (6) 0.200 (2) 0.870 (8) 0.360 (4) 2.100 (10) 0.135 (1) µA/cm2
Corrosion rate of rebar ladders, 2nd bar
(average value, June 2001)
0.250 (8) 0.200 (6) 0.400 (10) 0.120 (3) 0.100 (1) 0.240 (7) 0.163 (5) 0.110 (2) 0.270 (9) 0.130 (4) µA/cm2 Chloride content at 25-50mm (average value, June 2001)
0.32 (10) 0.19 (4) 0.20 (6) 0.22 (7) 0.15 (2) 0.195 (5) 0.12 (1) 0.23 (8) 0.26 (9) 0.15 (3) % Chloride content at 50-75mm
(average value, June 2001)
0.03 (5) 0.04 (8) 0.03 (6) 0.03 (3) 0.037 (7) 0.02 (2) 0.02 (1) 0.05 (9) 0.03 (3) % OVERALL RANKING: 5.8 4.4 6.1 6.4 4.6 6.4 5.2 4.4 6.9 3.7
The half-cell potentials of reinforcement given in Table 2 for the tests done on the main reinforcement are calculated based on a large number of measurement results. However, since the main reinforcement was protected by a 75 mm concrete cover, corrosion took a long time to begin and, therefore, the difference in the results in the group is not large. On the other hand, the results for the tests done on the ladders indicate the average values on two ladders in each span. Since ladder bars were protected by a thinner concrete cover (13 mm to 25 mm), corrosion began sooner and had more effect. The difference in the results for a given test is larger and provides a more significant comparison.
In general, the relative performance of a given system varied substantially from one test to another. However, the overall ranking of the field tests indicates that System H consistently had the best overall performance in the field with a score of 3.7. If only the field tests on the rebar ladders (thin concrete cover) were considered, an overall ranking of 1.75 would be obtained for System H, which would be the best of the group. Two other systems had a relatively better performance in the field, namely the system in Span 12 (epoxy-coated reinforcement) and System F. They had an overall ranking of 4.4 which is considered much better than the ranking of 5.8 obtained by the control system in Span 21. SUMMARY AND CONCLUSIONS
1. Seasonal variations of temperature had strong effects on concrete relative humidity, electrochemical potential of the reinforcement and concrete strain. The internal relative humidity for most rehabilitation techniques varied annually from 90-100% down to 70-90%, a range of RH favourable to corrosion initiation. The level of RH in concrete at a given time may be influenced by a combination of many factors such as type of
corrosion inhibitors, quality of the concrete and the distance between a given RH sensor and the nearest microcracks.
2. The long-term longitudinal strain monitored in the barrier wall showed that the total strain and the related cracking were independent of the presence or type of corrosion inhibiting systems used.
3. On-site corrosion surveys show that the half-cell potentials are shifting toward more negative values. The difference in potential from span to span is also increasing. This indicates that corrosion, or the effect of corrosion-inhibiting systems, in these spans is developing.
4. Corrosion rates measured by linear polarization method show that the rates were still
low (≤0.5 µA cm2) in all spans and were increasing. It indicates that more time is
needed to see a significant corrosion activity and to evaluate the effectiveness of the corrosion-inhibiting systems applied in these spans.
5. Half-cell potentials measured on the special rebar ladders embedded in the spans had
reached –500 mV to –600 mV vs. Cu/CuSO4 on the top bars in many spans showing
the high corrosion probability in the locations with thinner concrete cover. The potentials on the lower bars were also shifting toward more negative values, indicating the corrosion probability was also increasing.
6. Based on this five-year field study, System H has consistently given the best performance of the group. However five years is still relatively short. The performance of the different corrosion inhibitor systems will certainly change with time. Further monitoring and study are needed to corroborate these initial findings.
ACKNOWLEDGEMENTS
The NRC’s Institute for Research in Construction wishes to thank its partners for their contributions to the project, in particular: the Ministry of Transportation of Quebec, Axim Concrete Technology, Caruba Holdings, Euclid Admixture Canada, Israel Richler Trading, Master Builders Technologies, Sika Canada, W.R. Grace & Co, and the Regional Municipality of Peel. The sustained assistance of Louis Marie-Bélanger and Daniel Vézina from MTQ is also gratefully acknowledged. The authors wish to thank the following people at NRC for their scientific and technical contributions: R. Willoughby, N. Mailvaganam, B. Baldock, N. Chagnon, G. Chan, G. Pye and M. Arnott.
REFERENCES
1. Lewis, J. M., Mason, C. E. and Brereton, D. (1956): "Sodium benzoate in concrete", Civil Engineering and Public Works Review, 51(602), pp. 881-882.
2. Treadaway, K. W. and Russel, A. D. (1968): "Inhibition of the corrosion of steel in concrete - Part 2", Highways and Public Works, 36, pp. 40-41.
3. Griffin, D. F. (1975): "Corrosion inhibitors for reinforced concrete", Corrosion of Metals in Concrete, ACI SP-49, American Concrete Institute, pp. 95-102.
4. Berke, N. S. (1989): "Corrosion inhibitors in concrete", Corrosion 89, paper 445, NACE, Houston, Tx.
5. Rosenberg, A. M., Gaidis, J. M., Kossivas, T.G. and Previte, R.W. (1977): "Corrosion inhibitor formulated with calcium nitrite for use in reinforced concrete", Chloride Corrosion of Steel in Concrete, America Society for Testing and Materials, Philadelphia, STP 629, pp. 89-99.
6. Berke, N.S. and Weil, T. G. (1992): "World-wide review of corrosion inhibitors in concrete", Advances in Concrete Technology, pp. 899-924.
7. El-Jazairi, B. and Berke, N. S. (1990): "The use of calcium nitrite as a corrosion inhibiting admixture to steel reinforcement in concrete", Corrosion of Reinforcement in Concrete, Elsevier Science Publishers Ltd., Wishaw, Warwickshine, UK, pp. 571-585.
8. Hope, B. B. and Ip, A. K. C. (1989): "Corrosion inhibitors for use in concrete", ACI Materials Journal, 86(6), pp. 602-608.
9. Mäder, U. (1994): "A new class of corrosion inhibitors", Proceedings of ‘Corrosion and Corrosion Protection of Steel in Concrete’, Ed. R. N. Swamy, Sheffield Academic press, pp. 851-864.
10. Nmai, C. K., Farrington, S. A. and Bobrowski, G. S. (1992): "Organic-based corrosion-inhibiting admixture for reinforced concrete", Concrete International, 14(4), pp. 45-51.
11. Cusson, D., Qian, S., Glazer, R. and Hoogeveen, T. (2002): “Remote monitoring of a rehabilitated concrete highway bridge – 5 years of results,” 2nd Material Specialty Conference of the Canadian Society for Civil Engineering, June, 10 pp. (accepted).
12. Cusson, D., Mailvaganam, N. (1999): “Monitoring and Evaluation Techniques for Corrosion Inhibiting Systems in Reconstructed Bridge Barrier Walls,” Concrete International, 21(8), August, pp. 41-47.
13. Cusson, D. and Repette, W. (2000): “Early-age cracking in reconstructed concrete bridge barrier walls,” ACI Materials Journal, 97(4), July/August, pp. 438-446.
14. Pruckner, F. and Gjorv, O.E. (2001): “Measurements of relative humidity in concrete,” Proceedings of the 3rd Int. Conference on Concrete Under Severe Conditions, Edited by N. Banthia, K. Sakai and O.E. Gjorv, Vancouver, pp. 1489-1496.
15. Neville, A. M. (1996): “Properties of concrete,” 4th ed., Editor: John Wiley & Sons, Inc., New-York, 844 pp.
16. Qian, S.Y.; Chagnon, N. "Evaluation of corrosion of reinforcement in repaired concrete", 9th International Conference and Exhibition, Structural Faults and Repair 2001 (London, U.K. Jul, 2001), pp. 1-12, 2001.
17. Broomfield, J. P. (1996): “Field measurement of the corrosion rate of steel in concrete using a microprocessor controlled unit with a monitored guard ring for signal confinement,” In
Techniques to assess the corrosion activity of steel reinforced concrete structures, ASTM STP
1276, Ed.: N. S. Berke, E. Escalante, C. K. Nmai and D. Whiting, American Society for Testing and Materials, pp. 91-106.
18. Stoltzner, E., Knudsen, A. and Buhr, B. (1997): “Durability of marine structures in denmark,” In: Proceedings of the Int. Conf. on Repair of Concrete Structures, From Theory to Practice in a Marine Environment, Editor: Aage Blankvoll, Norway.
30 40 50 60 70 80 90 100 1997 1998 1999 2000 2001 2002 Time (year) R e lative H u m idity (% ) -25 -20 -15 -10 -5 0 5 10 15 20 25 30 35 40 45 50 55 60 65 70 75 Tem perature ( o C) RH T
Figure 1. Ambient relative humidity and ambient temperature measured at the Vachon bridge. 30 40 50 60 70 80 90 100 1997 1998 1999 2000 2001 2002 Time (year) R e la ti ve H u mi d ity ( % ) -25 -20 -15 -10 -5 0 5 10 15 20 25 30 35 40 45 50 55 60 65 70 75 T e mperat ure ( o C) RH top RH bot T top T bot
-20 -15 -10 -5 0 5 10 15 20
Dec 96 Jan 97 Feb 97 Mar 97 Apr 97 May 97 Jun 97
Time T e mper at ur e ( C ) 1 2 3 4 Total number of freeze-thaw Freezing point Thawing point
Figure 3. Temperature and freeze-thaw cycles measured during the first winter in control span. -0.6 -0.5 -0.4 -0.3 -0.2 -0.1 0.0 0.1 0.2 1996 1997 1998 1999 2000 2001 2002 Time (year) Po te n tia l ( V )
Uncorrected potential data for Span 21 (steel vs. MnO2)
Corrected potential data for Span 21 (steel vs. Cu/CuSO4)
Calibration data (MnO2 vs. Cu/CuSO4)
-0.55 -0.50 -0.45 -0.40 -0.35 -0.30 -0.25 -0.20 -0.15 1997 1998 1999 2000 2001 2002 Time (year) P o tential ( V vs. CS E ) A Epoxy B G Control C D H, F,E
Figure 5. Electrochemical potential measured at the Vachon bridge.
-400 -350 -300 -250 -200 -150 -100 -50 0 50 100 150 200 250 1997 1998 1999 2000 2001 2002 Time (year) M icroS tr ain Mech. Top Mech. Bot Thermal Top Thermal Bot
-500 -450 -400 -350 -300 -250 Time (year) control P o te n tia l ( m V v s . C S E ) Epoxy A B C 19 97 19 98 19 9 9 20 0 0 20 01 -5 00 -4 50 -4 00 -3 50 -3 00 -2 50 D 19 97 19 98 19 99 20 00 20 0 1 E 19 97 19 98 19 9 9 20 0 0 20 01 F 19 97 19 9 8 19 99 20 0 0 20 01 G 19 97 19 9 8 19 9 9 20 0 0 20 01 H
Figure 7. Half-cell potential obtained during the field surveys in 1997 to 2001 at the Vachon bridge. 0 % 2 0 % 4 0 % 6 0 % 8 0 % 1 0 0 % C u mulative Frequency C o n tro l E p o x y A B C D E F G H 0 % 2 0 % 4 0 % 6 0 % 8 0 % 1 0 0 % C u mulative Frequency 0 % 2 0 % 4 0 % 6 0 % 8 0 % 1 0 0 % > -250 -250 to -275 -276 to -300 -301 to -325 -326 to -350 -351 to -375 -376 to -400 -401 to -425 -426 to -450 -451 to -475 -476 to -500 -501 to -525 -526 to -550 -551 to -575 -576 to -600 -601 to -625 P o te n tia l (m V v s . C S E ) C u m u la ti ve Frequency (c ) (a ) (b )
Figure 8. Cumulative frequency of half-cell potential vs. potential calculated from the results obtained in June 1997 (a), May 1999 (b) and May 2001 (c).
0 . 0 0 . 2 0 . 4 0 . 6 0 . 8 1 . 0 C o n t r o l A C E G S p a n C o rro s io n ra te ( µ A c m -2) U C - 9 7 U C - 9 8 U C - 9 9 U C - 0 0 U C - 0 1 C - 9 7 C - 9 8 C - 9 9 C - 0 0 C - 0 1
Figure 9. Corrosion rate at cracked (C) and uncracked (UC) locations on the barrier wall.
0 1 0 2 0 3 0 4 0 5 0 6 0 7 0 C o n t r o l E p o x y A B C D E F H S p a n Resi st iv it y ( k o h m cm ) 1 9 9 7 1 9 9 8 1 9 9 9 2 0 0 0 2 0 0 1
Figure 10. Concrete electrical resistivity measured at the Vachon bridge.
-7 0 0 -6 0 0 -5 0 0 -4 0 0 -3 0 0 -2 0 0 -1 0 0 1997 06/ 1997 1998 1999 2000 2001 05/ 1997 06/ 1997 1998 1999 2000 2001 05/ 1997 06/ 1997 1998 1999 2000 2001 05/ 1997 06/ 1997 1998 1999 2000 2001 05/ 1997 06/ 1997 1998 1999 2000 2001 Pote nti a l (mV v s . C SE) 1 2 3 4 D E F G H -7 0 0 -6 0 0 -5 0 0 -4 0 0 -3 0 0 -2 0 0 -1 0 0 P o te nt ial ( m V vs. CS E ) C o n tro l E p o x y A B C T im e (Y e a r)
Figure 11. Half-cell potential measured on the rebar ladders (concrete cover thickness: 13mm at bar 1, 25mm at bar 2, 38mm at bar 3 and 50mm at bar 4).
0.0 0.2 0.4 0.6 0.8 1.0 1997 1998 1999 2000 2001 1997 1998 1999 2000 2001 1997 1998 1999 2000 2001 1997 1998 1999 2000 2001 1997 1998 1999 2000 2001 Time (Year) C o rro s io n ra te ( µ A c m -2 ) 1 2 0.0 0.2 0.4 0.6 0.8 1.0 C o rro s io n ra te ( µ A c m -2) Control Epoxy A B C D E F G H 2.1 µA cm-2
Figure 12. Corrosion current density measured on the rebar ladders embedded in the barrier wall (concrete cover thickness: 13mm at bar 1 and 25mm at bar 2).
0.0 0.1 0.2 0.3 0.4 0.5 0.6 Span Chl o ri de I on Cont ent ( % by wt of concr e te ) 0-13 mm 13-25 mm 25-50 mm 50-75 mm 1997 1998 2000 2001 Control A B C D E F G H 1997 1998 2000 2001 1997 1998 2000 2001 1997 1998 2000 2001 1997 1998 2000 2001 1997 1998 2000 2001 1997 1998 2000 2001 1997 1998 2000 2001 1997 1998 2000 2001