Life Cycle Inventories for the Production of Sodium Silicates
M a t t h i a s Fawer t, M a r t i n C o n c a n n o n 2, Wolfram R i e b e r 3' EMPA (Swiss Federal Laboratories for Materials Testing and Research), Ecology Department, Lerchenfeldstrasse 5, CH-9014 St. Gallen, Switzerland
2Crosfield Silicates, Warrington WAS lAB, England
3Woellner Silikat G m b H , Woellnerstrasse 26, D- 67065 Ludwigshafen, Germany
Corresponding author: Dr. Matthias Fawer; e-mail: [email protected]
Abstract
Soluble alkali silicate glasses, liquids and powders are an im- portant class of primary synthetic chemicals and are produced in large quantities both in Europe and world-wide. They are utilised in a broad range of application fields, both industrial and domestic, including detergents, chemical feedstocks, paper manufacture, civil engineering and adhesives. In order to estab- lish viable figures for the consumption of raw materials, water and energy and the emissions to air and water and solid waste generation, the production routes for five typical commercial sodium silicate products were traced back to the extraction of the relevant raw materials from the earth. Life Cycle Invento- ries for these products were compiled by EMPA St. Gallen / Switzerland on behalf of CEES, a Sector Group of CEFIC, using the data input based on the production of 1995 from 12 West European silicate producers covering about 93% of the total alkaline silicate production in Western Europe.
Keywords: Builder; cradle-to-factory-gate; cradle-to-gate; laun- dry detergents; LCA; LCI; life cycle assessment; Life cycle in- ventory; sodium silicate; software "EcoPro ~
1 Introduction
The interest in objective and scientifically based informa- tion about the environmental impacts caused by products and everyday life activities has increased with the growing concern of the general public about ecology and the envi- ronment. Detergents and cleaning agents have received spe- cific attention, mainly because of the annual consumption of about 5.5 mil. tons of detergent in the EC (situation in 1993); it has become imperative to focus on this category of products in ecological terms.
In 1992, the Association of the Swiss Soap and Detergents Industry (SWI) commissioned Life Cycle Assessments (LCAs) on detergents and cleaning agents by the LCA-Group of EMPA, St. Gallen. The SWI considers that ecobalancing the essential ingredients of these product categories is an impor- tant step in the development of the European detergent mar- ket. From this first exercise it became obvious that these LCAs are reliable if they can be sponsored by manufactur- ers of the corresponding ingredients rather than by its users.
The European Detergent Zeolite Producers (ZeoDet) have been first encouraged to carry out a life cycle study on the environmental effects of Zeolite A (FAwER, 1996). One spe- cific sodium silicate has therefore been investigated as a pre- cursor material of Zeolite A. This LCI study has raised the interest of the European Silicate Producers (CEES, Centre E u r o p & n d'Etude des Silicates) to carry out Life Cycle In- ventories (LCIs) of various sodium silicates themselves. The LCIs have accordingly been commissioned by the CEES Sec- tor g r o u p of the European Chemical Industry Council (CEFIC) involving 12 member companies.
The idea of the group was to employ an independent insti- tute to generate an authoritative LCI for silicate production in Europe based on individual data supplied by all mem- bers. This approach, using an independent 3rd-party, is now a well-established and viable technique which preserves con- fidentiality and generates meaningful and utilisable LCI data. It has already been successfully applied by the APME (Asso- ciation of Plastics Manufacturers in Europe) for their eco- profiles of polymers and by the E C O S O L (European Centre of Studies on Linear Alkylbenzene) for their LCI study on detergent surfactants. This latter w o r k has obviously a di- rect relevance for the Silicate study. The detailed LCI has been published as EMPA report N ~ 241 (F^wER, 1997). The LCIs represent average situations for the sodium sili- cate production in Western Europe in 1995 and data have been obtained from a total of 13 CEES member production plants which, produced 704,000 t as SiO z of alkaline sili- cates in 1995. This represents 93% of the total production of alkaline silicate in Western Europe (757,000 t as SIO2). The average was weighted by the output from each plant. From the supporting group, companies were chosen to pro- vide data for the 5 sodium silicate products. The LCIs are based on data covering the total annual production as out- lined in Table 1. For each of the relevant companies an indi- vidual LCI has been calculated and sent to cover their re- spective operations. Each of them will use their o w n LCI for conducting an internal bench marking of their silicate pro- duction. This will help them to identify their priorities in terms of improving their operations and processes. The av- erage LCI has been evaluated for general use and when pub- lished will serve clients, consumers and government bodies.
LCI for the Production of Sodium Silicate
LCA Case Studies
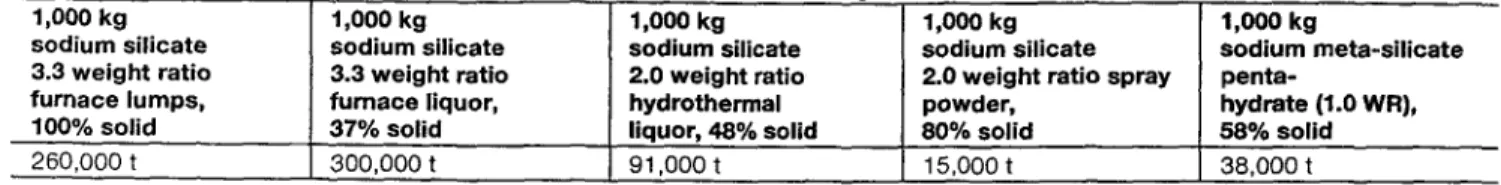
Table 1: The 5 sodium silicate products: Specification and amount (as t of SiO z) represented by LCI data suppliers
1,000 kg 1,000 kg 1,000 kg 1,000 kg 1,000 kg
sodium silicate sodium silicate sodium silicate sodium silicate sodium meta-silicate
3.3 weight ratio 3.3 weight ratio 2.0 weight ratio 2.0 weight ratio spray penta-
furnace lumps, furnace liquor, hydrothermal powder, hydrate (1.0 WR),
100% solid 37% solid liquor, 48% solid 80% solid 58% solid
260,000 t 300,000 t 91,000 t 15,000 t 38,000 t
For convenience, the inventory data are calculated on the basis of the production of 1,000 kg sodium silicate with standard solid contents of commercially available products. The functionality of the 5 different sodium silicate products is not comparable because their application and performance varies considerably.
The solid portions of the surface of the Earth consist pre- dominantly of silicon and oxygen atoms in the form of silica and silicates. The use of Earth's silica and silicate resources by human beings is the oldest technology on the planet. With the domestication of fire, the first anthropogenic silicates were introduced. The etymological root of the word ceram- ics goes back through ancient Greek to the Sanskrit verb "to burn" (RocHow, 1987).
The preparation of silicates by chemical reaction began late in the industrial revolution with the production of Portland ce- ment in the 1830s. It was shortly thereafter that soluble alkali silicates were produced on a commercial scale. By 1928, pro- cesses were being developed for the use of soluble silicates in aqueous effluent treatment from other industries. The 1940s saw the development of aqueous silica sols and the beginnings of the production of crystalline silicates by hydrothermal syn- thesis. In the following decade, silicones and organic silicates emerged as commercial products. Another decade later a rapid growth occurred in the manufacture of synthetic zeolites, crys- talline hydrated aluminosilicates, first as ion exchangers and adsorbents, then as shape selective or molecular sieves and petrochemical catalysts. Today the range of applications falls into three major groups: detergent, chemical and adhesive. Household laundry detergents incorporate sodium silicate as a builder, corrosion inhibitor and processing aid. Detergents for machine dishwashing and for industrial applications rely on the buffering, saponifying and soil suspension properties. Sodium silicate is also consumed in large quantities as a silica source for further chemical synthesis. Other chemicals re- quiring silicates for their manufacture include silica sol and titanium dioxide. Silicates are also used as a chemical auxil- iary. They perform an important stabilising role in peroxide bleaching of paper pulp and textiles.
In the third group of applications, silicates function as adhe- sives. The bonding of paper tubes and drums, for example, utilises sodium silicate as an adhesive in its own right. In other applications, the bonding or setting may be reinforced by heat or chemical reaction.
Soluble silicate glasses, powders and liquids are among the largest volume synthetic chemicals, surpassed in volume only by commodity acids and bases. They are essentially combi- nations of alkali metal oxide and silica, usually with some water. The general formula for the soluble silicates of so- dium, potassium and lithium is:
x SiO 2 M 2 0
[where M is Na, K or Li and x is the molar ratio (MR) defining the number of moles silica (SiO2) per mole of metal oxide (MzO) ].
However, the ratio can also be expressed on a weight basis. For example, a sodium silicate solution containing 36% SiO z and 18 % NazO is said to have a weight ratio (WR) of 2.0:1. Since the molecular weights of NazO (62) and SiO z (60) are similar, there is only a small difference between weight and molar ratio for sodium silicates. For convenience, all ratios in this report are expressed on a weight basis. The versatil- ity of these products stems largely from the modification of their properties made possible by varying the molar ratio and the physical form in which the product is supplied, e.g. liquid, powder, granules, etc.
2 G o a l a n d S c o p e
The idea of the study was to generate quantitative LCI in- formation for the production of 5 sodium silicate products.
This information comprises the consumption of energy and raw materials, emissions to air and water and solid waste generation and is presented as "Life Cycle Inventories for the production of Sodium Silicates". The aim was to trace back all production processes to the extraction of raw mate- rials from earth and to calculate average data for the pro-
duction processes of sodium silicates employed in Europe. Secondary company specific information may be compared with the average LCI as an internal bench marking process w h i c h helps the individual producer to recognise the major potentials of improving their production processes.
More details about the methodology applied and the gen- eral aims of a Life Cycle Inventory can be found in the full report (FAWER, 1997). It generally complies with the SETAC publication "A 'Code of Practice' - Guidelines for Life Cycle Assessment" (1993), ISO 14041 (1998) and BUWAL 250 (1996).
The LCI study covered all operations, notably the two ba- sic production processes for sodium silicate (furnace or hy- drothermal route) and the further processes (dissolving, blending, filtering, etc.) leading to the 5 commercial prod- ucts. The study therefore comprises a Chemical Material Inventory or a "Cradle-to-Factory-Gate" study. Subsequent use of sodium silicates in other products (e.g. detergents) and its final disposal were not included. Nevertheless, this basic information on sodium silicates, when combined with other data, allows one to conduct LCIs for full products at a later stage.
Using these LCIs of sodium silicates for comparative stud- ies with alternative materials, special care has to be taken of the equivalent functions. Therefore, detailed informa- tion must be collected on the performance of the com- pared products.
Soda ash production BUWAL N" 250 ining
~ I
Soda
ash
Transport BUWAL N ~ 250 ) Mixing & Melting CEES membersI
Sodium silicate 3.3 WR furnace lumps, 100% solid Dissolving & Filtering CEES membersI
Sodium silicate 3.3 WR furnace liquor, 37% solid Sand extraction B U W A L N ~ 250Sand
( T r a n s p o r t ) B U W A L N ~ 250I
NaOH production A P M E R e p o r t 6_ _ I
NaOH
( T r a n s p o r t ) B U W A L N ~ 250 Processing & Filtering CEES m e m b e r sI
Sodium silicate 2.0 WR hydrothermal liquor, 48% solidI
Spray drying C E E S membersI
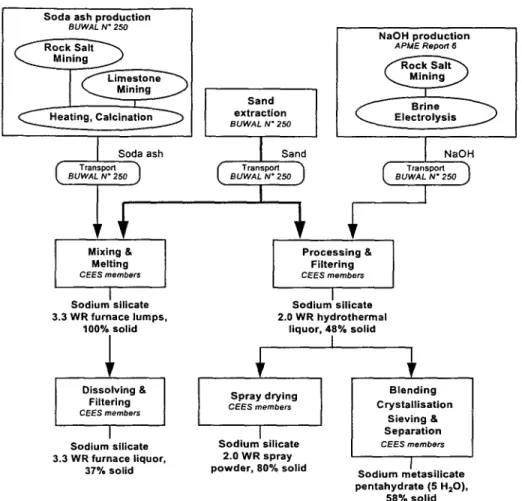
Sodium silicate 2.0 WR spray powder, 80% solid Blending Crystallisation Sieving & Separation C E E S members I Sodium metasilicate pentahydrate (5 H20), 58% solidFig. 1: Schematic flow chart for the production of 5 different sodium silicates. (Italics: Origin of data) The main production sequence is usually the easiest to iden-
tify. This includes the final processes which are under the direct control of the silicate producers and for which opera- tions specific inventory data are used (---) Fig. 1). All other processes are not under the direct control of the silicate pro- ducers and are described by average data (processes with data from B UWAL N* 250, APME report 6, ETH/ESU study for raw materials, ancillary materials and energy).
The aim, ideally, should be to allow readers and other LCI experts to duplicate the LCI in exactly the same way as the description of a laboratory experiment should allow the reader to set up the necessary equipment and perform the practical work. Only when the system is described in such detail, can the reader be sure that the system he is visualising is the same as that intended by the author.
3 P r o d u c t i o n R o u t e s
a) S o d i u m s i l i c a t e 3.3 W R f u r n a c e l u m p s
Sodium silicate glass WR 3.3 is produced by direct fusion of precisely measured proportions of pure silica sand and soda ash (theoretical values: 767.4 kg SiO 2 / 397.5 kg NazCO3) in oil or gas fired furnaces at a temperature of about 1400"C according to the reaction:
Na2CO 3 + x S i O 2 -~ x SiO 2 : Na20 + CO 2
b) S o d i u m silicate 3.3 W R f u r n a c e l i q u o r ( 3 7 % solid) From the sodium silicate lumps WE 3.3, the frequently used commercial products are gained by dissolving them in wa- ter at elevated temperature and pressure to yield a solution of 37% solid which is then filtered normally.
c) S o d i u m silicate 2 . 0 W R h y d r o t h e r m a l l i q u o r ( 4 8 % solid) This product is normally produced by hydrothermally dis- solving silica sand in sodium hydroxide solution (theoreti- cal values: 320 kg SiO 2 / 206.5 kg NaOH). the reaction takes place inside autoclaves, specially designed to withstand the extremely aggressive working conditions involved. After fil- tration, the product is obtained as a sodium silicate solution of 48% solid and a weight ratio of 2.0.
d) S o d i u m s i l i c a t e 2.0 W R s p r a y p o w d e r
Sodium silicate WR 2.0 Solutions produced according to route c) are dried in drum or spray dryers yielding hydrous powders (about 20% water) which can readily be redissolved on appli- cation (subsequent processing of the powders like compacting or granulating is not contained in the calculations).
e) S o d i u m m e t a s i l i c a t e p e n t a h y d r a t e ( 1 . 0 W R / 5 8 % dry
matter)
This substance is normally produced by blending sodium silicate solutions and additional caustic soda (NaOH) to achieve crystallisable solutions with WR 1.0. The crystallised (stoichiometric) products Na,SiO 3 x 5 H20 are separated, sieved and processed in an appropriate way.
LCI for the Production of Sodium Silicate
LCA Case Studies
Table 2: Individual net process energy consumption: weighted average figures and spread for process energy usage Net Process Energy Consumption [MJ]
Production process Average . Spread
(1,000 kg output)
Furnace process (mixing & melting) 4,183 3,700 - 5,320
Furnace lumps dissolving & filtering 487 345 - 920
Hydrothermal liquor process (processing & filtering) 553 350 - 680
Na-silicate spray drying process 7,000 4,100 - 13,540
Metasilicate process (blending, crystallisation, sieving & separation) 945 440 - 1,551
R e m a r k s to Table 2:
The spread in terms of process energy consumption is due to several parameters which vary over the individual production processes of the five silicate products, Nevertheless, one has to realise that such a spread is not unexpected for the silicate production. It is rather an obvious occurrence when creating average figures over the European production of certain goods involving several plants. In this respect, the spread in energy consumption shown in Table 2 lies within the expectations. However, a few reasons partly explaining the deviation are given below. The following comments are somehow applicable to all described processes.
For instance a higher use of energy may be related to a certain product performance which goes beyond the described functional unit (special filtering step, temperature of sold product, etc.). Furthermore, companies may achieve a higher production yield to avoid the production of waste which also needs additional energy. Another reason for slightly higher energy consumption may be due to spare capacities which necessitates more start-upS and shut- downs of the process.
On the other hand, there may be differences in terms of age and technology of certain installations which result in diverse efficiencies of the systems (heat recovery, energy regime, insulation). A low specific energy consumption can only be achieved with an optimised size of the installation and a perfect energy recovery via steam and electricity generation. Enhanced process design, as for example the dissolving of the lumps straight from the furnace, may also lead to some energy savings. But obviously not all measures are suitable for all production facilities. Therefore, each production site is unique in the way it has developed, has been designed and has been linked to other parts of the plant.
4 I n v e n t o r y R e s u l t s
4.1 Average inventory of a unit process
One purpose of such an LCI study is to help individual com- panies to compare their specific information with average data of a unit process to elaborate an internal bench-mark- ing process. Therefore, the average input and output figures of the major production (unit) processes for Na-silicate are calculated separately to be compared with company spe- cific data. A special chapter describes the sodium silicate pro- duction processes. It is a precise look at an average process that is very useful for engineers of the companies. In contrast to a full LCI, these figures focus on a defined process and the input materials are n o t traced back to its origin. The average process energy consumptions are shown in Table 2.
4.2 Average Life Cycle Inventory (LCl)
(4 Table 3, Appendix)
The Life Cycle Inventory results are presented in a complete input-output table. They display results for raw materials and water consumption, electricity and thermal energy use, emissions to air and water and solid waste generation (in- cluding the consumptions and emissions caused by interme- diates and energy production and transport).
The whole LCIs have been calculated using EMPA software "EcoPro 1.4". This newly developed software contains stan- dard data modules which may be combined with additional figures from industry.
5 C o n c l u s i o n s
The LCIs of sodium silicates were carried out using the lat- est information about silicate production processes and the precombustion of required intermediates and energies. The
data presented here for the manufacture of sodium silicates are therefore a good representation of average European practice during the year 1995. The methodology applied in this study is in compliance with the described standard pro- cedures of SETAC and ISO.
These LCIs for sodium silicates are an important step within a Life Cycle Assessment (LCA), providing data on defined processes. They take into account material and energy in- puts and outputs such as emissions to land, air and water. These LCIs are not an LCA study in their own right, but provide the raw data on which such studies, including com- parisons and assessments, can be based. Each of the compa- nies involved knows their own LCI and is therefore able to compare their figures with the average LCIs for sodium sili- cates and to determine any ecological weak points or iden- tify any production process improvement opportunities (Hot spot analysis). This identification of critical aspects of the silicate production processes was already part of an itera- tive data collection procedure. With each iteration step (3 in total) an increasing level of detail and reliability was attained. The level of detail was increased on points where the previous iteration pointed out key issues for further analysis. Issues like raw material use, energy consumption, steam partition within one site and functional units (e.g. solid content and weight ratio of final products) were especially addressed during this iterative procedure. Furthermore, such a data collection is considered to be a dynamic activity and, ideally, should be repeated periodically approximately every 5 years.
The LCI data generated in this study may subsequently be used to conduct full LCAs for a variety of systems, for in- stance detergent products. In particular, they can provide a basis for comparing the environmental characteristics of dif- ferent systems. Above all, this necessitates the correct speci- fication of the functional unit of such systems in a way that the performances delivered are equivalent. Defining such
functionality is a specialised undertaking in which all perti- nent attributes of the systems and of the products them- selves must be considered.
A c k n o w l e d g e m e n t s
This compilation of LCIs has been commissioned and sponsored by CEES (Centre Europ~en d'Etude des Silicates) involving the following member companies most of whom have also supplied their specific process data:
AKZO-PQ Silica Vof Amersfoort Netherlands
Ausimont Bollate Italy
Crosfield Ltd. Warrington England
FMC foret S.A. Barcelona Spain
Henkel KGaA D0sseldorf Germany
IQE S.A. Zaragoza Spain
Rhodia Courbevoie France
(former RhSne-Poulenc S.A,)
SILMACO S.A Lanaken Belgium
Clariant Cuise-Lamotte France
(former Societ~ Fran~aise Hoechst)
Van Baerle GmbH Gernsheim Germany
Van Baerle & Cie AG M0nchenstein Switzerland
Woellner Silikat GmbH Ludwigshafen Germany
7 References
BOUSTF.AD, I. (1992): Eco-profiles of the European polymer indus- try, Report 1: Eco-balance methodology for commodity ther- moplastics. Association of Plastics Manufacturers in Europe (APME), Brussels
BOUSTF.AD, I. (1994): Eco-profiles of the European polymer indus- try, Report 6: Polyvinyl chloride. Association of Plastics Manu- facturers in Europe (APME), Brussels
BUWAL (1996): Environmental Inventories of packaging materi- als. Environmental Series N ~ 250. Swiss Federal Office of Envi- ronment, Forests and Landscape (BUWAL), Bern
FALCOXE Jr., J.S.; BLUXtBERC, J.G. (1992): Anthropogenic silicates, in: The Handbook of Environmental Chemistry, Vol. 3, Part F, Springer, Berlin Heidelberg New York
FAWER, M: (1996): Life Cycle Inventory for the production of Zeo- lite A for detergents. EMPA report Nr. 234, Diibendorf. Com- missioned by ZeoDet, a sector group of CEFIC
FAWER, M. (1997): Life Cycle Inventory for the production of So- di um Silicates. E~ IPA report Nr. 241, Diibendor f. Commissioned by CEES, a sector group of CEFIC
FRISCHKNECHT, R. et al. (I 993): Environmental Life Cycle Invento- ries for energy systems. Swiss Federal Institute of Technology ETH Zurich, Institute fiir Energietechnik (ESU)
ISO 14040 (1997): Environmental management - Life cycle assess- ment - Principles and guidelines
ISO 14041 (1998): Environmental management - Life cycle assess- ment - Goal and scope definition and inventory analysis RocHow, E.G. ( 1987): Silicon and silicones, Springer, Berlin Heidel-
berg New York
SETAC (1993): A 'Code of Practice'. Guidelines for Life-Cycle As- sessment. Society of Environmental Toxicology and Chemistry (SETAC). Outcome of Workshop in Sesimbra, Portugal SPOLD (1996): Introduction into a common format for life cycle
inventory data, prepared by Axel Singhofen, Brussels; Int. J. LCA 1 (3) 171-178 (1996)
Received: May 19th, 1999 Accepted: june 23, 1999
Appendix
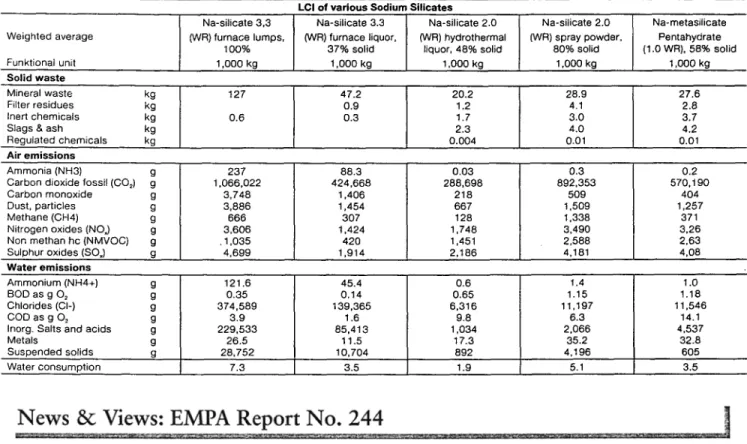
Table 3: Average LCIs for the production of the five sodium silicate products
LCI of various Sodium Silicates
Na-silicate 3,3 Na-silicate 3.3 Na-silicate 2.0 Na-silicate 2.0 Na-metasilicate Weighted average (WR) furnace lumps, (WR) furnace liquor, (WR) hydrothermal (WR) spray powder, Pentahydrate
100% 37% solid liquor, 48% solid 80% solid (1.0 WR), 58% solid
Funktional unit 1,000 k 9 1,000 kg 1,000 kg 1,000 kg 1,000 kg
Raw materials
Rock salt kg I 638 237 123 214 224
Sand k9 I 772 287 325 562 293
Lime stone kg 510 190 2.2 3.8 4.0
Intermediates for Na-silicate prod.
Washed sand (100% dry I kg I 772 287 325 562 293
Soda kg ] 400 149
NaOH (100%) kg 209 362 380
Auxil. Materials for Na-silicate prod.
Water for steam prod. m 3 ] 7.3 J 115 142.8 815.3 343.1
Compressed air [8 bar I Nma I 9.6 ] 8.4 4.0 115.9 28,6
*Additives kg 0.1 0.7 0.7 1.6 0.6
Energy Flow (delivered energy)
Electricity MJ Coal MJ Oil heavy MJ Oil average/light Diesel oil MJ Gas MJ Others MJ Sub-total MJ Recovered energy MJ T o ~ l MJ 477 4,501 2,981 297 157 3,243 7 11,661 708 10,953 212 1,710 1,310 110 57 1,404 61 4,865 242 4,623 3,118 296 9 456 144 1,270 78 5,371 5,371 7,075 517 12 789 211 8,290 1,097 17,992 17,992 6,41 487 6 715 262 2,66 36 10,57 10,57 Recyclable materials Water kg I 67.5 75.3 68.6 502 Filter residues kg I 1.0 0.7 510,7 0,8
LCI for the Production of Sodium Silicate
LCA Case Studies
Table 3 continued
LCI of various Sodium Silicates Weighted average Funktional unit Na-silicate 3,3 (WR) furnace lumps, 100% 1,000 kg Na-silicate 3.3 (WR) furnace liquor, 37% solid 1,000 kg Na-silicate 2.0 (WR) hydrothermal liquor, 48% solid 1,000 kg Na-silicate 2.0 Na-metasilicate
(WR) spray powder, Pentahydrate
80% solid (1.0 WR), 58% solid 1,000 kg 1,000 kg Solid waste Mineral waste kg Filter residues kg Inert chemicals kg
Slags & ash kg
Regulated chemicals kg 127 0.6 47.2 0.9 0.3 Air emissions Ammonia (NH3) g
Carbon dioxide fossil (CO2) g
Carbon monoxide g
Dust, particles g
Methane (CH4) g
Nitrogen oxides (NO,) g
Non methan hc (NMVOC) g
Sulphur oxides (SO,) g
237 1,066,022 3,748 3,886 666 3,606 ,1,035 4,699 88.3 424,668 1,406 1,454 307 1,424 420 1,914 Water emissions Ammonium (NH4+) g BOD as g 02 g Chlorides (CI-) g COD as g 02 g
Inorg. Salts and acids g
Metals g Suspended solids g 121.6 0.35 374,589 3.9 229,533 26.5 28,752 45.4 0,14 139,365 1.6 85,413 11.5 10,704 Water consumption 7.3 3.5 20.2 1.2 1.7 2.3 0.004 0.03 288,698 218 667 128 1,748 1,451 2,186 0.6 0.65 6,316 9.8 1,034 17.3 892 1.9 28.9 27.6 4.1 2.8 3.0 3.7 4.0 4.2 0.01 0.01 0.3 892,353 509 1,509 1,338 3,490 2,588 4,181 0.2 570,190 404 1,257 371 3,26 2,63 4,08 1.4 1.15 11,197 6.3 2,066 35.2 4,196 1.0 1.18 11,546 14.1 4,537 32.8 6O5 5.1 3.5
Life Cycle Inventories for the Production of Detergent Ingredients
Silvio Dall'Acqua, Dr. Matthias Fawer, Renato Fritschi, Caroline Allenspach
1999, 109 pages, bound, incl. 3.5" diskettes with excel data files, CHF 100.4 Euro 62.-
Engl.: ISBN 3-905594-09-9; Germ.: ISBN 3-905594-08-0; ISSN 0258-9745 This study (commissioned by the German Federal Environmental Agency, UBA Berlin and the Okoinstitut Freiburg, Germany) pre- sents basic data on the production of the most important ingredi- ents for detergents. These data have been harmonised and updated and are published as life cycle inventories.
Two different groups are targeted. The first is the users of these LCIs from the detergent industry. The second target group con- sists of the LCA experts in general, The problem of LCIs that are incompatible due to the use of varied methodologies and basic data is a common one. This study can be helpful in dem- onstrating solutions for these problems.
Applying the data published here eliminates concerns over whether the data are compatible with each other, and they can therefore be combined quickly and simply. Users of these data can be sure that:
9 A uniform methodology, which is compliant with ISO 14 000 ff, has been applied in the life cycle inventories
9 Joint basic data on energy production, transport and basic chemicals have been used
9 The LCI parameters are compatible with each other 9 The structure of the individual LCIs is constant
It is thus possible for users to obtain reliable and meaningful results. Through the qualitative descriptions in the individual inventories, they can also quickly recognise whether the data are appropriate to their needs.
S u m m a r y o f t h e T a b l e o f C o n t e n t s
9 Basic introduction in the field of detergent ingredients 9 Detailled description of the LCI methodology applied 9 Description of the individual ingredients and performed
amendments and methodological variations 9 Basic data and life cycle inventories
9 Critical review report by Dr. Rolf Bretz, Ciba SC 9 Statement on the critical review report
9 Comparison of different terms used for parameters 9 Glossary of terms
9 Standard questionnaire for collecting data
![Table 2: Individual net process energy consumption: weighted average figures and spread for process energy usage Net Process Energy Consumption [MJ]](https://thumb-eu.123doks.com/thumbv2/123doknet/14835464.621990/4.918.88.830.134.301/individual-process-consumption-weighted-average-figures-process-consumption.webp)