RETINAL IMAGE QUALITY ASSESSMENT USING SUPERVISED
CLASSIFICATION
MAHNAZ FASIH
DÉPARTEMENT DE GÉNIE INFORMATIQUE ET GÉNIE LOGICIEL ÉCOLE POLYTECHNIQUE DE MONTRÉAL
MÉMOIRE PRÉSENTÉ EN VUE DE L’OBTENTION DU DIPLÔME DE MAÎTRISE ÈS SCIENCES APPLIQUÉES
(GÉNIE INFORMATIQUE) AOÛT 2014
ÉCOLE POLYTECHNIQUE DE MONTRÉAL
Ce mémoire intitulé :
RETINAL IMAGE QUALITY ASSESSMENT USING SUPERVISED
CLASSIFICATION
présenté par : FASIH Mahnaz
en vue de l’obtention du diplôme de : Maîtrise ès Sciences Appliquées a été dûment accepté par le jury d’examen constitué de :
M. QUINTERO Alejandro, Doct., président
Mme CHERIET Farida, Ph.D., membre et directrice de recherche
M. LANGLOIS J. M. Pierre, Ph.D., membre et codirecteur de recherche M. BILODEAU Guillaume-Alexandre, Ph.D., membre
DEDICATION
ACKNOWLEDGEMENTS
I would like to express sincere gratitude to my adviser, Professor Farida Cheriet and Professor Pierre Langlois for their patience, motivation, useful comments, remarks and engagement through the learning process of this master thesis. Their guidance helped me in all the time of research and writing of this thesis.
I would like to thank my family for their love and support throughout my study. I would like to thank my office mates at the Liv4D which we shared unforgettable memories during the study. Also, I would like to thank Diagnos inc. for providing the required data during this research work.
A great thank you also goes to my colleague Mitchel Benovoy for his great help and comments that improve my French writing. In addition, I would like to thank my dear friends who provided helps for this study, in particular Samira Ebrahimi Kahou.
RÉSUMÉ
L’évaluation de la qualité d’images de la rétine est une étape importante dans le diagnostic automatisé des maladies de l'œil. La précision du diagnostic est dépendante de ce critère, car une mauvaise qualité de l'image peut empêcher l'observation de caractéristiques importantes de l'oeil et des manifestations pathologiques. Un algorithme robuste est donc nécessaire afin d'évaluer la qualité des images dans une base de données. Les méthodes existantes sont généralement basées sur des paramètres de qualité d'image génériques ou des critères structurels. L’évaluation de la qualité de l'image en fonction de paramètres génériques exploite la plupart des paramètres tels que les caractéristiques de contraste, netteté, éclairage, et la texture. Ces méthodes évitent généralement les procédures de segmentation des structures de l'oeil. Le grand avantage de ces méthodes est leur faible complexité de calcul par rapport à celles mises au point sur la base de critères structurels. En revanche, les systèmes basés sur des critères structurels exigent l'identification de structures anatomiques, y compris le disque optique et le réseau vasculaire de la macula. Ces méthodes ont tendance à manquer de robustesse lorsqu'elles traitent des images de mauvaise qualité. Bien que les algorithmes d'évaluation de la qualité de l'image précédemment développé montrent de bonnes performances, ils ont été mis en place sur différentes bases de données en s'appuyant sur des critères différents. Une nouvelle mesure est donc nécessaire.
Nous avons développé un algorithme d'évaluation de la qualité de l'image rétinienne basée sur l'extraction de caractéristiques génériques sans segmentation a priori de l’image. La nouveauté de cet algorithme est sa simplicité et son faible coût de calcul, ainsi que sa capacité à s’adapter sur la région d'intérêt locale. Les caractéristiques génériques sont constituées de la netteté locale, le ratio de bordure, les caractéristiques de texture et l’histogramme de couleur. La probabilité cumulée de flou métrique de détection et l'algorithme de codage de longueur variable ont été utilisés pour mesurer la netteté et les caractéristiques texturales, respectivement. Les caractéristiques extraites sont combinés pour évaluer la convenance de l'image à des fins de diagnostic. Basé sur le fait que les experts médicaux se concentrent davantage sur certaines structures anatomiques telles que la macula et le disque optique, nous avons décidé de comparer les approches globales et locales. Un « support vector machine » avec un « kernel » de fonctions
de base radiales a été utilisé comme un classificateur non linéaire afin de classer les images pour les groupes utilisables et non-utilisables. La méthodologie développée a été appliquée sur 100 images avec des tailles différentes classées par un expert médical. L'expert a évalué 50 images comme mesurable et 50 comme non-mesurable. Les résultats indiquent un très bon accord entre les prédictions de l'algorithme proposé et le jugement de l'expert médical: la sensibilité et la spécificité de l'approche locale sont respectivement 94% et 92% alors qu'il était de 87% et 89% pour l'approche globale.
ABSTRACT
Retinal image quality assessment is an important step in automated eye disease diagnosis. Diagnosis accuracy is highly dependent on the quality of retinal images, because poor image quality might prevent the observation of significant eye features and disease manifestations. A robust algorithm is therefore required in order to evaluate the quality of images in a large database. Existing algorithms for estimating the retinal image quality are generally based on generic image quality parameters or structural criteria. Image quality assessment based on generic parameters mostly exploits parameters such as contrast, sharpness, illumination, and texture features. These methods generally avoid eye structure segmentation procedures. The great advantage of these methods is their low computational complexity compared to those developed based on structural criteria. In contrast, systems based on structural criteria require identification of anatomical structures including the optic disc, macula and vascular network. These methods tend to lack in robustness when dealing with poor quality images. Although previously developed image quality assessment algorithms shows good performances, they have been implemented on different databases and relying on different criteria and a new metric is required to be developed.
We developed an algorithm for retinal image quality assessment based on the extraction of generic features without images segmentation. The novelty of this algorithm is its simplicity and low computational cost and also its capability to apply on local region of interest associated with retinal images. The generic features consisting of local sharpness, edge ratio, textural features and color histogram were measured. The cumulative probability of blur detection metric and the run-length encoding algorithm were used to measure the sharpness and textural features respectively. The extracted features are combined to evaluate the image suitability for diagnosis purposes. Based on the fact that medical experts focus more on some anatomical structures such as macula and optic disc, we decided to compare global and local approaches. A support vector machine with radial basis functions was used as a nonlinear classifier in order to classify images to gradable and ungradable groups. The developed methodology was applied on 100 images with various sizes graded by a medical expert. The expert evaluated 50 images as gradable and 50 as ungradable. The results indicate a very good agreement between the proposed algorithm’s predictions and the
medical expert’s judgment: the sensitivity and specificity for the local approach are respectively 94% and 92% while it was 87% and 89% for the global approach.
CONTENTS
DEDICATION………...iii ACKNOWLEDGEMENTS ………..………iv RÉSUMÉ………v ABSTRACT………..………vii CONTENTS ………..ixLIST OF TABLES ………xii
LIST OF FIGURES ……….xiii
LIST OF ACRONYMS ………...xvi
LIST OF APPENDIX. .………xix
CHAPTER 1 INTRODUCTION ... 1
1.1 Motivation ... 1
1.2 Objectives ... 2
1.3 Thesis outline ... 3
CHAPTER 2 MEDICAL BACKGROUND AND RETINAL IMAGE ACQUISITION ... 4
2.1 Eye Anatomy ... 4
2.2 Retinal Manifestations of Systemic and Eye Diseases ... 6
2.3 Retinal Imaging Modalities ... 10
2.4 Conclusion ... 15
CHAPTER 3 LITERATURE REVIEW ... 16
3.1 Image quality assessment ... 16
3.1.1 Full-reference IQA: ... 16
3.1.2 Reduced-Reference IQA (RR-IQA): ... 18
3.2 Retinal Image Quality Assessment ... 19
3.2.1 Retinal IQA with Histogram based Methods ... 20
3.2.2 Retinal IQA based on Generic Image Quality Parameters ... 22
3.2.3 Retinal IQA based on Structural Criteria ... 25
3.2.4 Retinal IQA based on Generic and Structural Criteria ... 29
3.3 Conclusion ... 32
CHAPTER 4 METHODOLOGY ... 33
4.1 Preprocessing ... 33
4.1.1 Image masking ... 34
4.1.2 Image cropping ... 35
4.2 Generic features extraction ... 35
4.2.1 Sharpness feature ... 36
4.2.2 Edge ratio feature ... 38
4.2.3 Texture analysis ... 40
4.2.4 Color features ... 43
4.3 Feature selection ... 46
4.4 Classification ... 47
4.4.1 Training and testing data selection ...………47
4.4.2 Determining optimum parameters ... 48
4.4.3 Evaluation ... 49
4.5 Local and global evaluation ... 50
CHAPTER 5 RESULTS AND DISCUSSION ... 51
5.1 Data set ... 51
5.2 Experimental results ... 51
5.3 Classification strategies ... 52
5.4 Texture features selection ... 52
5.5 RLM’s direction selection ... 53
5.7 SVM kernel parameters adjustment ... 54
5.8 Classification results ... 55
5.9 Comparison of global and local approaches ... 55
5.10 Features classification performance ... 57
5.11 Computational efficiency of algorithm ... 58
5.12 Alternative experiment ……….76
CHAPTER 6 CONCLUSION ... 60
REFERENCES ... 62
LIST OF TABLES
Table 3.1:List of features used by David et al. ... 24
Table 3.2: Field definition metric and constraints required for adequate field definition ... 26
Table 3.3: Performance comparison between Giancardo et al.’s method and Niemeijer et al approach ... 28
Table 3. 4: Range of for five quality categories [40] ... 29
Table 3. 5: Performance of Paulus et al. method using different features [30] ... 31
Table 3. 6: Results of the classifier using different features for total 1884 images ... 32
Table 4.1: Run length features ... 41
Table 4.2: Haralick features ... 42
Table 4.3: Determining optimum parameters steps ... 49
Table 5.2 : The accuracy of RLM in different directions ... 53
Table 5.3: Selected RLM features in each iteration ... 54
Table 5.4: The best obtained parameters of SVM in the each iteration ... 55
Table 5.5: Accuracy of the proposed method in each iteration ... 55
Table 5.7 : Sensitivity and specificity of each class of features ... 57
Table 5.8: Time consumed for different phases of algorithm ... 59
Table 5. 9: The best obtained parameters ... 59
Table 5. 10: RLM features selected ... 59
LIST OF FIGURES
Figure 1.1: Gradable and ungradable retinal images. (a) Gradable, (b) Blur, (c) Low contrast, (d)
Poor visibility of macula region and uneven illumination ... 2
Figure 2.1: Front view of eye structures (waiting for permission) [5] ... 4
Figure 2.2: Side view of eye structures (waiting for permission) [5] ... 5
Figure 2.3: Retinal image components ... 6
Figure 2.4: Effect of non-proliferative diabetic retinopathy on retina. Yellow spots are exudates and red dots are leaking blood (waiting for permission) [8] ... 7
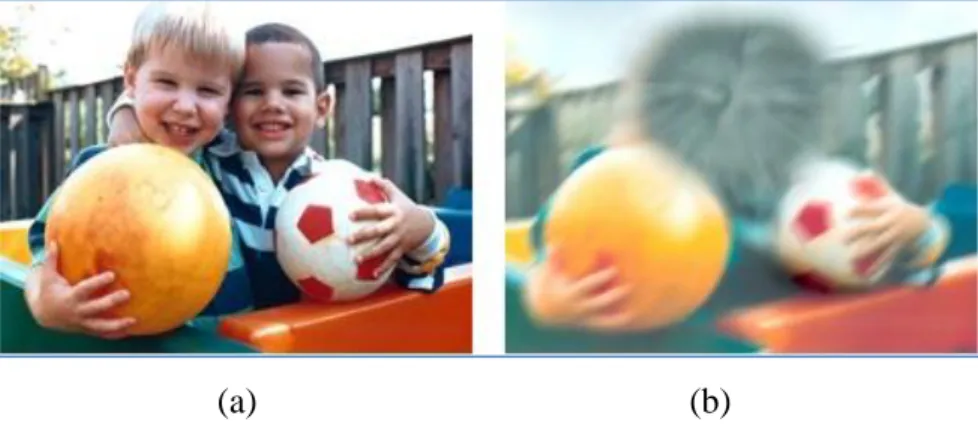
Figure 2.5: Effect of diabetic retinopathy in human vision: (a) normal vision (b) vision of person with diabetic retinopathy (permission obtained from authors) [10] ... 7
Figure 2.6: Effect of Glaucoma in human vision: (a) normal vision (b) vision of person with glaucoma (permission obtained from authors) [10] ... 8
Figure 2.7: Effect of glaucoma on the optic disc: (a) normal optic disc, (b) optic disc damaged by glaucoma (waiting for permission) [11] ... 9
Figure 2.8: Effect of Age-Related Macular Degeneration on macula region: (a) dry AMD, (b) wet AMD (waiting for permission) [12] ... 10
Figure 2.9: Effect of AMD in human vision: (a) normal vision (b) vision of person with AMD (permission obtained from authors) [10] ... 10
Figure 2.10 : retinal images taken by (a) fluorescein angiography [13], (b) optical coherence tomography (waiting for permission) [14] ... 11
Figure 2.11: Fundus camera (permission obtained from authors) [10] ... 12
Figure 2.12: (a) A scheme of angle of view; retinal image captured by angle of view of (b) 20° (c) 40° and (d) 60° (waiting for permission) [15] ... 13
Figure 3.1: Examples of gradable (left) and ungradable (right) retinal images with the
corresponding edge distributions (waiting for permission) [24] ... 21
Figure 3.2: Scatter plot showing the separability of the three classes “Good”, “Fair” and “Bad” retinal images (waiting for permission) [24] ... 22
Figure 3.3: The regions where the features are calculated (waiting for permission) [26] ... 24
Figure 3.4: Feature vector composition reported by Giancardo et al.[38], (a) Original Image, (b) Mask detected and fitted ellipse (dashed line), (c) Vessel Segmentation, (d) Local window in polar coordinates and (e) Color histogram (waiting for permission) [38] ... 27
Figure 4.1: Preprocessing steps ... 33
Figure 4.2: (a) Orginal color retinal image and (b) masked retinal image ... 34
Figure 4.3: (a) original retinal image and (b) cropped retinal image ... 35
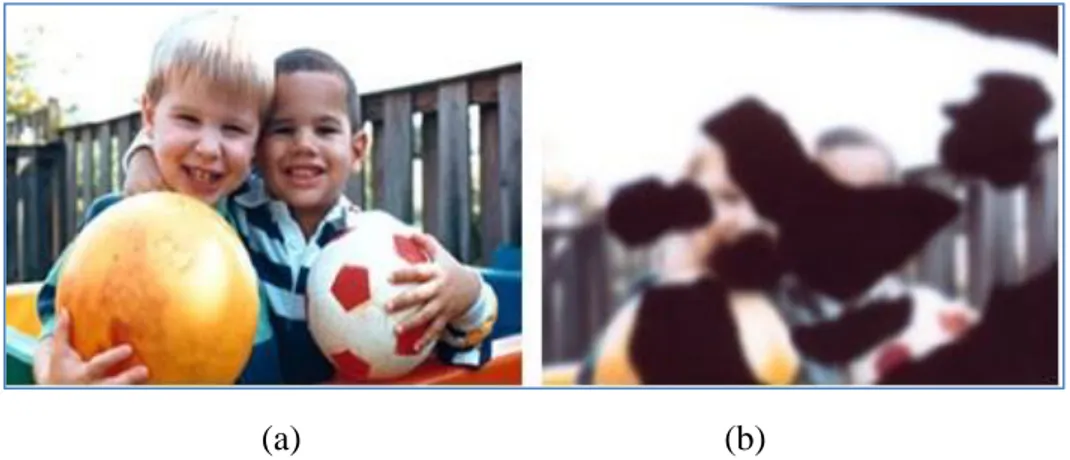
Figure 4.4: Sharp retinal image. (b) Blurred retinal image due to incorrect lens focus. (c) Blurred retinal image due to motion blur. (d) Blurred retinal image due to dirty lens ... 36
Figure 4.5: One row of the blurred image ... 37
Figure 4.6: Gradable (a) and ungragable (b) images and corresponding edge maps (c and d) ... 39
Figure 4.7: Run length matrix calculation of small neighborhood image for four different directions ... 40
Figure 4.8: Local co-occurrence matrix calculation (a) small neighborhood image of size 5 × 5 centered at a pixel marked in red letter; (b) the corresponding co-occurrence matrix ... 42
Figure 4.9: HSV color space (waiting for permission) [54] ... 43
Figure 4.10: Three histograms hue, saturation and value of the gradable retinal image ... 44
Figure 4.11: illustrate saturation and value indexes of different image quality ... 45
Figure 4.12: Different retinal images that belong to different ethnic origins ... 46
Figure 4.13: Classification steps ... 48
Figure 4.14: Procedure of 10-fold cross validation ... 50
Figure 5.1: Examples of bad quality images but classified as gradable by medical expert ... 56 Figure 5.2 : The time consumed for processing different size of images ... 58
LIST OF ACRONYMS
AMD Age-related macular degeneration BIQI Blind image quality index
CPBD Cumulative probability of blur detection DCT Discrete cosine transformation
DR Diabetic retinopathy
FR-IQA Full-reference image quality assessment
FS Feature selection
GLN Grey level non-uniformity HGRE High gray-level run emphasis HSV Hue Saturation Value
IQA Image Quality Assessment ISC Image structure clustering JNB Just noticeable blur
GGD Generalized Gaussian distribution KLD Kullback Leibler distance
KNNC K-nearest neighbor classifier LDC Linear Discriminate Classifier LRLGE Long run low gray level emphasis
LRE Long run emphasis
LRHGE Long run high gray level emphasis LGRE Low gray-level run emphasis
MSE Mean Squared Error
MS-SSIM Multi-Scale Structural SIMilarity
NN Neural Network
NPDR Non-proliferative diabetic retinopathy NR-IQA No-reference image quality assessment NSS Natural Scene Statistics
OCT Optical Coherence Tomography
1DD One disc diameter
PLS Partial Least Squares PSNR Peak Signal-to-Noise Ratio PDR Proliferative diabetic retinopathy QDC Quadratic Discriminate Classifier
RR-IQA Reduced-reference image quality assessment RRED Reduced-reference entropic differences
RLM Run-length matrix
RLN Run-length non-uniformity
RP Run percentage
RGB Red Green Blue
ROI Region of interest RBF Radial basis function
ROC Receiver operating characteristic SSIM Structural SIMilarity
SVM Support vector machine
SFFS Sequential forward floating system
SRE Short run emphasis
SRGE Short run low gray level emphasis SRHGE Short run high gray level emphasis
LIST OF APPENDIX
Appendix A - Texture Analysis ………...……….67 Appendix B – Classification………..75
CHAPTER 1
INTRODUCTION
Eye diseases affect a large number of human beings and their prevalence is expected to increase in the near future [1] [2]. Proper detection and treatment of eye diseases prevents visual loss in more than 50% of patients [3]. Retinal images have been demonstrated to be very efficient tools for disease diagnosis. For instance, medical experts use ophthalmology photos taken from the retina in order to diagnose eye and systemic diseases. Eye diseases such as Diabetic Retinopathy (DR) and Age-related Macular Degeneration (AMD) manifest themselves on the retina. They are detectable by analysis of retinal images and may be treatable if detected at an early stage. Retinal images are typically captured using digital fundus photography. Factors such as operating personnel’s level of experience, patient head or eye movement and blinking can significantly influence the quality of retinal fundus images. They might reduce image quality and therefore cause several undesirable effects such as uneven illumination, poor contrast, blurriness and poor visibility. Misalignment can result in the incorrect estimation of the position of important anatomical features such as the macula and optic disc.
1.1 Motivation
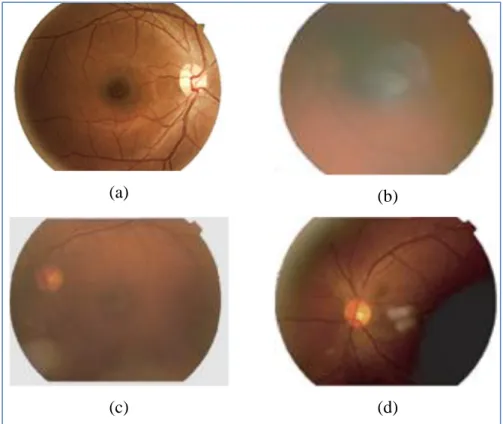
Photos of poor quality might lead to incorrect automatic diagnosis of a disease and the grading of its severity. Thus, an expert must first visually classify the images as gradable or ungradable. A retinal image is deemed ungradable if it is impossible to make a reliable clinical judgment regarding the presence or the type of disease. Figure 1.1 shows examples of one gradable and three ungradable retinal images. Visual analysis of large databases of retinal images is a time consuming task that can be spread among a large number of experts. However, this may lead to inter-variability between results in the quality assessment or in the diagnosis provided by different experts. Automatic analysis of retinal images is thus a possible solution for the shortage of human experts and for reproducible clinical assessment. Moreover, in order to better understand the cause and progress of diseases, one may need to analyze many images over a long period of time. Automated retinal images quality analysis can reduce the need for human intervention and provide better conditions for more studies, hence increasing the functionality of retinal disease diagnosis [4].
Figure 1.1: Gradable and ungradable retinal images. (a) Gradable, (b) Blur, (c) Low contrast, (d) Poor visibility of macula region and uneven illumination
1.2 Objectives
The main objective of this thesis is to propose an automatic image quality assessment approach to classify retinal images as gradable or ungradable. This general objective is divided into six specific objectives that together achieve the overall goal of the project.
i. Develop an algorithm to identify a region of interest for further analysis. Under this objective, the project will result in an algorithm to remove irrelevant image information in color retinal images that consist of a circular region (foreground) on a black background. ii. Propose an approach to measure generic features containing textural, local sharpness,
edge ratio and color histogram features. These extracted features are used for the classification of the images as gradable or ungradable.
(a) (b)
iii. Propose a feature selection technique to reduce the dimensionality of the features vector by selecting only a subset of measured features. The goal of feature selection is to improve the effectiveness and efficiency of the classification.
iv. Construct an algorithm capable of classifying images as gradable or ungradable, according to measurements performed in the previous stages.
v. Evaluate the sensitivity and specificity of the algorithm based on experimental (visual) observations of eye experts.
vi. Evaluate the proposed method on a region including the main anatomical structures. Since experts commonly consider the macula and optic disc regions as the most useful portions of retinal images, we investigated the difference between a local and a global assessment approaches.
1.3 Thesis outline
This thesis is organized as follows. Chapter 2 introduces necessary medical background and presents information on structure of human eye, the retinal image acquisition process and retinal manifestations of systemic and eye diseases. Chapter 3 presents a literature survey and presents some recent approaches on retinal image quality assessment. Chapter 4 describes the different steps of the proposed methodology and provides some theoretical principles. Chapter 5 presents the datasets used in this study and the obtained results. These results are then discussed. The thesis ends with concluding remarks in Chapter 6.
CHAPTER 2
MEDICAL BACKGROUND AND
RETINAL IMAGE ACQUISITION
This chapter presents brief reviews of the eye structure, of retinal manifestations of systemic and eye diseases, and of retinal imaging.
2.1 Eye Anatomy
The eye is made up of several structures whose collaborative action makes it possible for us to see. Several structures that compose the human eye can easily be seen by looking into a mirror (see Figure 2.1):
Figure 2.1: Front view of eye structures (waiting for permission) [5]
Iris: The iris is the colored part of the eye; it controls the amount of light entering the eye. The
iris’ color of each person is inherited from their parents.
Pupil: The pupil is the hole at the center of the iris that allows light to enter the eye.
Sclera: The sclera is the white part of the eye and it protects the outer layer of the eye.
The internal structure of the eye is essentially made up from a number of optical components and neural components shown in . In order to introduce these internal eye structures, let us assess the action of seeing.
Figure 2. 2: Side view of eye structures (waiting for permission) [5]
In general in order to see, light reflects off an object and enters the eye. The light first touches a thin veil of tears that coats the front of the eye and continues its way through the cornea. The cornea helps to focus the light. On the other side of the cornea is a watery fluid called the aqueous humor. It keeps a constant pressure within the eye. Then light passes through the pupil. The iris controls the amount of light entering the eye by shrinking or widening. The light then continues through the lens. Depending on the distance of the object from the eye, the lens changes its shape in order to change the focal distance of the eye. Then light beams through the center of the eye known as the vitreous humor that surrounds the retina on which the light is focused. The retina is a light-sensitive tissue located at the back of the eye (). There are two types of nerve cells in the retina: rods and cones. The retina contains approximately 6.5 million cones and 120 million rods. The cones cells have their highest concentration in the macula. The cones cells give the brain the ability to see color and fine detail of objects while the rods cells give the brain the ability of seeing in dark places; they are not sensitive to the color of object. These two types of nerve cells convert light into electrical impulses (signals). These signals are sent from the photoreceptors of the retina to a nerve bundle that is called the optic nerve. The signals are sent by the optic nerve to the visual center in the back of the brain, allowing one to see an image. It is important to notice that the point of departure of the optic nerve through the retina does not have any rods or cones, and thus is a blind spot (optic disc). Also in the retina, there are two other important components, namely the macula and fovea (Figure 2.3). The fovea is located in the
center of the macula region. This tiny area is responsible for the sharpest vision and has a very high concentration of cones [6].
Figure 2.3: Retinal image components
2.2 Retinal Manifestations of Systemic and Eye Diseases
Retinal manifestations of systemic and eye disease are diagnosable by analyzing retinal images. These diseases are characterized through lesions which appear on the retina.
The diabetes disease can damage nerve cells and also small and large blood vessels, and consequently damage the heart, brain, kidneys and eyes, and results in a retinal complication of diabetes called diabetic retinopathy [7].
Diabetic Retinopathy: Diabetic retinopathy is the most common diabetic eye disease and a
leading cause of blindness. Diabetic retinopathy can be developed in anyone who has diabetes. Diabetic retinopathy damages the blood vessels in the retina and can cause vision loss. Diabetic retinopathy is classified into two types:
I. Non-proliferative diabetic retinopathy (NPDR) is the early stage of the disease. In NPDR, the blood vessels in the retina are weakened and lead to leaking fluid into the retina, which may then lead to swelling of the macula (Figure 2.4).
II. Proliferative diabetic retinopathy (PDR) is the more advanced form of the disease. In an attempt to improve blood circulation in the retina, fragile blood vessels begin to grow in the retina. These fragile, abnormal blood vessels leads to leaking fluid into the back of the eye and block vision. PDR can cause severe vision loss and even blindness.
Figure 2.4: Effect of non-proliferative diabetic retinopathy on retina. Yellow spots are exudates and red dots are leaking blood (waiting for permission) [8]
In diabetic retinopathy, at first the vision doesn’t change, but over time, diabetic retinopathy can get worse and cause vision loss [9]. Figure 2.5 shows the normal vision and vision of a person with diabetic retinopathy.
(a) (b)
Figure 2.5: Effect of diabetic retinopathy in human vision:
(a) normal vision (b) vision of person with diabetic retinopathy (permission obtained from authors) [10]
Other manifestations of eye diseases can be detected on retinal images:
Cardiovascular Disease: Hypertension is one of the factors in cardiovascular disease.
Hypertension can cause the thinning of the arteries and the widening of the veins, which increases the risk of stroke and myocardial infarction. Cardiovascular disease manifests itself in the retina such as arterial and venous occlusions, cotton wool spots and choroidal infarcts visible as deep retinal white spots. The cotton wool spots are conspicuous lesions on the retina that appear as yellow-white spots. The venous occlusion is a blockage of the small veins that carry blood away from the retina [7].
Glaucoma: Glaucoma is a condition that causes damage to the eye's optic nerve by excess fluid
pressure in the eyeball, which will cause loss of vision (Figure 2.6). Without treatment, glaucoma can cause total blindness within a few years. Early diagnosis from retinal image analysis may minimize the risk of visual loss that [7, 9].
(a) (b) Figure 2.6: Effect of Glaucoma in human vision:
(a) normal vision (b) vision of person with glaucoma (permission obtained from authors) [10]
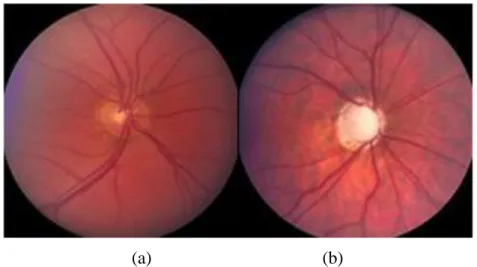
The optic nerve head changes in the early stages of glaucoma. The cup to disc ratio is a criteria used in order to determine the risk of glaucoma. The average value for cup to disc ratio is 0.3. A large cup is a potential sign of glaucoma. The whitish area in the center of the optic disc is known as cup. Figure 2.7 shows a normal sized cup on the left and a large cup on the right damaged by glaucoma.
(a) (b)
Figure 2.7: Effect of glaucoma on the optic disc:
(a) normal optic disc, (b) optic disc damaged by glaucoma (waiting for permission) [11]
Age-Related Macular Degeneration: Age-Related Macular Degeneration (AMD) is a common
eye condition and a leading cause of vision loss among people aged 50 and older. It causes damage to the macula. There are two types of AMD: dry and wet. The dry form is more common and affects about 90% of patients with AMD. The wet form is much less common, but it progresses more quickly and is more severe [9].
Wet AMD occurs when new abnormal blood vessels start to grow in an area, such as the macula, where they are not supposed to be. These new blood vessels are very fragile and often leaking fluid that can cause damage to the macula rapidly.
Dry AMD is an early stage of the disease. It occurs when the light-sensitive cells in the macula slowly break down. Dry AMD generally affects both eyes and patients may see a blurred spot in the center of their vision.
(a) (b)
Figure 2.8: Effect of Age-Related Macular Degeneration on macula region: (a) dry AMD, (b) wet AMD (waiting for permission) [12]
AMD leads to a blurred area near the center of vision or it may develop blank spots in the central vision, and also objects may not appear as bright as they used to be. Figure 2.9 shows the normal vision and vision of person with AMD.
(a) (b)
Figure 2.9: Effect of AMD in human vision:
(a) normal vision (b) simulated vision of person with AMD (permission obtained from authors) [10]
2.3 Retinal Imaging Modalities
There are various approaches to visualize the retina including fluorescein angiography (FA), optical coherence tomography (OCT) and fundus imaging. Each of these modalities has its own advantage and disadvantage. Ophthalmologists usually use each of these approaches in conjunction with another to provide sufficient diagnosis. Each of these modalities are described in the following.
The FA use camera and spatial dye to visualize the blood vessels of retina (Figure 2.10 (a)). In this imaging modality, a florescent dye is injected into bloodstream that fluorescein leaks from damaged retinal vessels. This can be useful for diagnosis of macular edema, diabetic retinopathy and venous occlusions. Some complications may happen when using FA such as transient nausea, vomiting and pruritis.
The OCT uses reflected infrared light to take cross-section pictures of the retina with high resolution (Figure 2.10 (b)). With OCT, each of the retina’s distinctive layers can be seen. This can be useful to diagnose many conditions, including diabetic retinopathy and macular degeneration [7]. The OCT cannot illustrate entire extent of surface over which puckering may occur.
Fundus imaging still remains an important imaging modality. A fundus image is a color picture of the interior components of the eye, including the retina, optic disc and macula (as shown in Figure 2.3). The fundus images are used for diagnosis eye disease including diabetic retinopathy, glaucoma and age-related macular degeneration. Although fundus imaging is widely used, it is not suitable for fundus tomography.
Figure 2.10 : retinal images taken by (a) fluorescein angiography [13], (b) optical coherence tomography (waiting for permission) [14]
Fundus images are taken by a digital fundus camera (Figure 2.11). The operator focuses and aligns the fundus camera and the required fundus image is created. The alignment, i.e. centering the eye horizontally and vertically, is done by moving the camera stage and high adjustment ring, respectively. The pupil must be located on the central circle on the monitor. The pupil is made to appear perfectly round by moving the camera joystick forward and backward to a position in which proper alignment is achieved. Nowadays, using modern cameras, the alignment is accomplished automatically. Retinal imaging is painless and takes a few seconds to be completed.
Figure 2.11: Fundus camera (permission obtained from authors) [10]
Fundus cameras are commonly characterized by their angle of view. A typical camera having 30° angle of view provides a magnification of 2.5 , and those with wide angle of view (between 45° and 140°) provide magnification factors between and 0.5 . A range of narrow angle of view is less than 20°, which provide relatively a higher retinal magnification. Figure 2.12 shows some examples of retina fundus obtained with different angles of view. Most of the digital cameras come with adjustable magnification. Higher magnification allows a narrow angle of view as well as a more detailed image, which is quite useful when there are more anatomical features in the shot.
Figure 2.12: (a) A scheme of angle of view; retinal image captured by angle of view of (b) 20° (c) 40° and (d) 60° (waiting for permission) [15]
Retinal imaging can help ophthalmologist to diagnose eye diseases such as diabetic retinopathy and macular degeneration (as described in Section 2.2). The provided image may also help the physician to diagnose whether a disease is getting worse or treatment is effective. Furthermore, a digital photography can be enhanced, saved and retrieved very easily. It can be transferred electronically to a trained optical technician or retinal specialist so as to detect disease of a patient at a remote location.
For the purpose of ensuring a reliable diagnosis and a valid automated processing, one should have sufficient image quality. In fact, photos of poor quality should not be further used for diagnosis. The quality of the captured images may highly vary, since the operating personnel’s level of experience differs from one person to another. There are number of factors that may cause fundus images to be classified as having low visual quality:
Lashes/Blink: Patient’s eye blinking during image acquisition may cause eyelashes or an
eyelid to be imaged during image acquisition. Lashes or a partial blink may lead to shadow or bright reflectance in the retinal image (Figure 2.13 (a)).
Haze: Haze is a white/yellow halo that appears at the edge of a retinal image and may
extend toward the center of image (Figure 2.13(b)). Haze can be a consequence from incorrect camera alignment.
Dust: Dirty lens may produce blurred retinal images and may lead to white dots with
varying sizes on the retinal images (Figure 2.13 (c)).
Uneven illumination over macula/optic disc: Retinal images are classified as
ungradable images if the macula or the optic disc region is lightly/darkly shadowed or totally obscured. Figure 2.13 (d) shows an example of invisibility of macula region. Blurriness: Patient’s head or eye movement might lead to out-of focus images, iris
appearing in the image and uneven illumination. Also, movement of imaging system or defocus aberration may cause blurred retinal images. Figure 2.13 (e) shows an example of a blurred retinal image.
Arc: Incorrect distances of patient and camera might cause arc shape to appear on the
Figure 2.13 : Examples of ungradable retinal images due to (a) patient’s eye blinking, (b) incorrect camera alignment, (c) dirty lens, (d) poor visibility of macula, (e) patient movement, (f)
Incorrect distances of patient and camera
2.4 Conclusion
Retinal images are used for diagnose eye diseases such as diabetic retinopathy, glaucoma and macular degeneration. Automatic diagnosis must be robust enough to establish the disease’s existence and to classify it. The performance of automated methods strongly depends on the quality of the images. Factors such as operating personnel’s level of experience, patient head or eye movement and blinking can significantly influence the quality of retinal fundus images. Photos of poor quality might lead to incorrect diagnosis of eye disease and the grading of its severity. Thus, an expert must first classify the images as gradable or ungradable. A retinal image is deemed ungradable when it is difficult or impossible to make a reliable clinical judgment regarding the presence and type of disease it contains. Major factors that reduce image quality include uneven illumination, poor contrast, blurriness and poor visibility of important components such as the macula and optic disc. Challenge of this project is to detect these factors indicating an image of poor quality.
CHAPTER 3
LITERATURE REVIEW
This chapter presents the body of knowledge necessary to build a state-of-the-art for retinal image quality assessment, aimed at assisting automated retinal image classification.
Firstly, section 3.1 broadly describes image quality assessment techniques and their types. Section 3.2 is devoted to the state-of-art for retinal image quality assessment.
After reading this chapter, the reader should have a good idea of the state-of-the art in retinal image quality assessment, how they are built as well as the challenges to overcome in order to provide useful approaches for retinal image quality assessment.
3.1 Image quality assessment
Images can be distorted during preliminary acquisition process, compression, restoration and displaying. Image Quality Assessment (IQA) plays a significant role in several image applications. IQA in medical fields can be used in term of how well desired information can be extracted from the image. Images with acceptable quality are those that can display the image contents sufficiently. Hence, IQA is an important step before image analysis.
For several years, IQA has been performed based on subjective evaluation. In fact, The quality of fundus images is normally evaluated by human experts. That process is therefore very expensive, tedious and slow. While objective IQA evaluation compute the quality of image automatically. The goal of objective method is to evaluate the quality of an image as closely as to the human judgment. Objective IQA methods can be classified into three categories: Full-Reference IQA (FR-IQA), Reduced-Reference IQA (RR-IQA) and No-Reference IQA (NR-IQA).
3.1.1 Full-reference IQA:
The FR-IQA method evaluates the quality of an image by comparing with a reference image, which is assumed to be high quality. The simplest FR-IQA is the Mean Squared Error (MSE). The MSE is the averaged squared difference between the intensity of a reference image and a distorted image. It is computed pixel by pixel, by adding up the squared differences of all pixels intensity and dividing by the total pixel count.
For images A = { } and B = { }, with and as pixels intensities:
(3. 1)
where N is the number of pixels.
Peak Signal-to-Noise Ratio (PSNR) is a popular FR-IQA. PSNR is the ratio between the reference signal and the distorted signal in an image, given in decibels. The higher the PSNR, the closer the distorted image is to the reference. For a reference image A = { } and a distorted image B = { }, PSNR is calculated by:
(3. 2)
where MAX is the maximum possible intensity pixel value.
The other method is the Structural SIMilarity (SSIM) index proposed by Wang et al. [16] which combines the luminance, contrast and structure in order to measure image quality. The SSIM between two images x and y of size N×N is calculated by the following equation:
(3. 3)
where luminance comparison function , contrast comparison function and structural comparison function are defined by:
(3. 4) (3. 5) (3. 6)
and are the average pixel intensity values of images x and y, and are the standard deviation of images x
and is covariance matrix between image x and image y and , and are small constants.
Although the SSIM index is a very useful index in many experiments in some cases the measured quality does not match properly with the subjective assessment method. Wang et al.[17] introduced a Multi-Scale SSIM (MS-SSIM) approach in order to improve the SSIM method. In the MS-SSIM method low pass filtering and downsampling is applied iteratively and the original image is indexed as scale 1 and the finest scale M is obtained after M − 1 iterations. At each scale j, the given image contrast and structure is compared using (x, y) and (x, y) respectively. The luminance comparison is performed only at scale M and is represented as (x, y). The overall quality is evaluated by combining the measurements over scales. However, determining an appropriate reference for retinal images is quite difficult, since natural large variety of retinal images may be obtained from image acquisition.
3.1.2 Reduced-Reference IQA (RR-IQA):
In the RR-IQA methods the reference image is not completely available. Instead, certain features are extracted from the reference image and these features are employed to help evaluate the quality of the test image. Several methods have been proposed for RR-IQA: Wang et al. [18] proposed RR-IQA in which they used the wavelet transform domain based on natural image statistic model. They used the Kullback Leibler Distance (KLD) between the probability distributions of wavelet coefficients of the distorted and reference images as a measure of image quality. A Generalized Gaussian Distribution (GGD) model is employed to summarize the marginal distribution of wavelet coefficients of the reference image, so that only a relatively small number of features are needed for quality assessment. Soundarajan et al. [19] proposed a method for quality assessment based on Reduced-Reference Entropic Differences (RRED). This method measures differences between the entropies of wavelet coefficients of reference and distorted images for image quality evaluation. One of the remarkable features of the RRED indexes is that this method does not depend on any parameters to be trained on databases. However, similar to the FR-IQA acquiring an appropriate reference for retinal images is not simple. In addition, using features to develop a final quality score is much more difficult than FR-IQA.
3.1.3 No-reference IQA (NR- IQA):
NR-IQA or blind IQA is much more difficult to implement, because quality assessment should be performed without using any reference. Most of NR- IQA relies on learning procedures to estimate image quality from training samples, for which human subjective quality scores are available. These methods contain two step frameworks: first step is extraction of features most of which are Natural Scene Statistics (NSS) and second step is model regression in machine learning such as logistical regression, probabilistic model, Support Vector Regression (SVR) and Neural Network (NN).
Moorthy et al. [20] proposed blind image quality index (BIQI), in which, the generalized Gaussian distribution is used to describe the distorted image. The distorted images are then classified into five different distortion categories(noise, blur, JPEG, JPEG2000 and fast fading) using Support Vector Machine (SVM). The final image quality is then calculated by SVR for each distortion category. Saad M.A. et al. [21] introduced BLIINDS BLind Image Integrity Notator using Discrete cosine transformation Statistics index which is a NR-IQA method. BLIINDS extract four image statistic features from the discrete cosine transformation (DCT) coefficient. Image is first divided into blocks and generalized Gaussian distribution is fitted to each block of DCT coefficients. Model parameters retrieved from each block are pooled across space to retrieve features representative of visual quality. Probabilistic model based on multivariate generalized Gaussian density is then applied for mapping computed features to image quality. Even though NR-IQA is potentially a useful approach (since there is no need for refrences), creating an algorithm for predicting visual quality, particularly without any information about original image, is difficult.
3.2 Retinal Image Quality Assessment
Existing algorithms for estimating retinal image quality are usually NR-IQA developed relying on image histogram analysis [22, 23], generic image quality parameters [24, 25], structural criteria [26-28] or both generic and structural image quality criteria [29, 30]. Image quality assessment based on generic features mostly exploits contrast, sharpness, illumination and texture features. These methods generally avoid eye structure segmentation procedures. The great advantage of these methods is their low computational complexity compared to those developed
based on structural criteria. Systems based on structural criteria require the identification of anatomical structures including the optic disc, macula and vascular network. These methods tend to lack in robustness when dealing with poor quality images.
3.2.1 Retinal IQA with Histogram based Methods
In 1999, the first approach was presented by Lee et al. [22]. They proposed a method based on measure of similarity between a template histogram and histogram of a given retinal image. They selected a set of 20 images (from a set of 360 images) with perfect quality (as desired images) and obtained their average intensity histogram, which were referred to as template intensity histogram. The quality index Q was then obtained by convolving the template histogram with the intensity histogram of a given image. The index Q is between 0 and 1, such that Q=0 means the image is ungradable and Q=1 means the image is gradable. However, the paper not include any result. In 2001, Lalonde et al. [23] demonstrated that measuring similarity of images histograms is not sufficient for quality assessment of retinal images. In fact, they found some ungradable and gradable retinal images with similar histograms shapes. Hence, they presented a different histogram based method that was based on two criteria:
1. Distribution of the edge magnitudes in the image (dedge).
2. Local distribution of pixel intensity (dintensity).
With regard to the first criterion, they found that distributions of edge magnitude of gradable retinal images have shapes that are similar to a Rayleigh distribution with smooth fall as the intensity increases. In contrast, distribution of edge magnitude of ungradable retinal images has shapes that are similar to a Rayleigh distribution but fall rapidly as the intensity increases, as Figure 3.1 shows. They used this criterion in order to measure the focus of image, since a sharper image has higher edges magnitudes. The second criterion, inspired from histogram of Lee et al. [22], considers a region based approach instead of global approach. They segment the global histogram into uniform region by standard histogram splitting algorithm from Ohlander et al. [31].
Figure 3.1: Examples of gradable (left) and ungradable (right) retinal images with the corresponding edge distributions (waiting for permission) [23]
This criterion is used in order to measure the illumination of images since gradable images should not have many dark and light pixels. By considering these two criteria, Lalonde et al. [23] tried to find the best decision border to classify images into three different categories: “Good”, “Fair” and “Bad”. Their results for 40 retinal images are shown in Figure 3.2. As shown in Figure 3.2, both criteria are able to discriminate good and bad retinal images. However, this method was implemented on only 40 retinal images that are not enough for evaluating the efficiency of the method.
Figure 3.2: Scatter plot showing the separability of the three classes “Good”, “Fair” and “Bad” retinal images (waiting for permission) [23]
3.2.2 Retinal IQA based on Generic Image Quality Parameters
In 2009, Bartling et al. [24] developed a quality assessment method based on two generic image quality parameters: sharpness and illumination. Firstly, the images were converted to 8-bit gray scale and resized to a common resolution of 1024 pixels in width. Afterwards, the images were divided into smaller squares with pixels, each square assessed separately.
The sharpness degree was measured on only sub-image squares having sufficient structural content. Evaluation of structural content was initiated by applying a Laplacian operator and the standard deviation of the pixel values was then calculated. The resulting value is an estimation of degree of structure content in each sub-image square. Sub-image squares with sufficient structural content were chosen based on an empirically determined threshold. These sub-image squares were then analysed in term of the spatial frequencies, since high spatial frequencies correspond to sharp image. Hence, Bartling et al. [24] used two dimensional discrete wavelet
transform (DWT2) using eight element Daubechies wavelet function. Finally, the mean value of all sub-image sharpness values was considered as the final value of the sharpness of the retinal image. Bartling et al. measured the image illumination through measuring image contrast and image brightness. These two parameters were measured individually in each sub-image square. They generated two weighting functions so as to measure image contrast and image brightness. Hence, contrast was calculated by using standard deviation of the pixel intensity with respect to its relevant weighting function. The image brightness was measured by using mean intensity value of each sub-image square with respect to its relevant weighting function. The final value of sub-image illumination was measured by simple addition of both measures. Sub-image squares classified by two groups (acceptable and not acceptable) based on their value of illumination. This classification was performed by an empirically determined threshold. Finally, the illumination of the whole image was determined by dividing the total number of acceptable sub-image squares by total number of sub-sub-image squares. This value is between 0 and 1.
Score for retinal image quality was defined by the combined quality parameters (sharpness value multiplied byillumination value). Images based on their score were classified in four groups (not acceptable, acceptable, good and very good). This retinal quality measurement method was applied on 1000 retinal images and also, six independent observers classified these images into the corresponding quality groups. Hence, by comparing automatic and human quality scores, the Kappa values [32] were calculated. The median Kappa value was 0.64. The result showed that their method was not efficient enough such that the obtained results were not in agreement with medical expert judgment.
In 2009, Davis et al. [25] developed a retinal image quality assessment procedure based on seventy computationally simple features. They divided a retinal image into seven regions as shown in Figure 3.3. They converted the image from RGB color space to CIELab [33] image space. Hence, features were calculated in each color channel of CIELab space and extracted from each region. All features used by Davis et al. are listed in Table 3.1. These features were calculated in order to evaluate the color, luminance and contrast of the retinal image. They used first Quartile and third Quartile in order to evaluate the color image. They also applied mean intensity, skewness and kurtosis features in order to assess image luminance. The mean intensity feature was used for characterizing dark and light image. The skewness feature is a measure of asymmetry of the intensity histogram and kurtosis is a measure of whether the histogram of pixel
intensities is peaked or flat. Moreover, they evaluated image contrast by using variance of the intensity, generic contrast and entropy features from Haralick features and spatial frequency.
Figure 3.3: The regions where the features are calculated (waiting for permission) [25]
Table 3.1:List of features used by David et al.
Mean intensity Skewness Entropy Spatial frequency 1st Quartile Median Variance Kurtosis 8 Haralick features 3rd Quartile
They used variance of the intensity because of the fact that low variance tends to reflect low contrast, and the reason of using entropy is the fact that high contrast images have the largest entropy value. Partial Least Squares (PLS) was used for quality assessment, in which 398 images from the University of Iowa database [34] including 200 good quality images and 198 bad quality images were used in order to assess the procedure performance. They achieved 100% sensitivity and 96% specificity for identifying ungradable images. Satisfactory results can be obtained even though this method uses simple features. The only drawback of this method, however, is that it uses so many features (357 features) and does not use a feature selection algorithm.
3.2.3 Retinal IQA based on Structural Criteria
In 2003, Usher et al. [26] developed a first retinal image quality assessment method based on eye structures. They developed unique features for retinal image quality assessment. They noticed that higher visibility of retinal vessel implies higher retinal image quality. In fact, in a blurred image, the small vessels are not visible and also if the illumination of a retinal image is uneven, parts of the vascular network are not visible. Hence, they used a vessel segmentation algorithm within the macula region and measured the area of detected vessels. They classified images into two groups of good and bad quality by using a threshold value while this threshold value was empirically obtained. The algorithm was tested on a dataset of 1746 retinal images and it achieved 84.3% sensitivity and 95.0% specificity. The major problem of this method occurs when dealing with the distorted retinal images having some undetectable vessels outside one optic disc diameter (1DD) around the macula, while the vessels within this region are clear and sharp [35].
In 2006, Niemeijer et al. [27] developed a method based on image structure clustering (ISC). The proposed method aimed at obtaining a set of clusters using filterbanks to describe the local image structures. The features used in the final system consist of 5 bins of normalized histogram of image structure clusters in R, G and B color space. In fact, 20 features were extracted from each retinal image and features selection was employed in order to reduce the feature set. The Sequential Forward Floating System (SFFS) [36] algorithm was used for feature selection. 1000 retinal images including 500 images with normal quality and 500 images with low quality were used for the training step. They tested 1000 retinal images with different classifier methods such as SVM, Quadratic Discriminate Classifier (QDC)[37], k-Nearest Neighbor Classifier (kNNC)[37] and Linear Discriminate Classifier (LDC)[37]. The best result was obtained from SVM classifier without using feature selection algorithm. They achieved an area under the Receiver Operating Characteristic (ROC) of 0.9968 which is close to optimal. The result shows that this method can verify retinal image quality well but the authors reported a running time for an each image of approximately 30 seconds, therefore the software had not been optimized. In 2006, Fleming et al. [28] developed a retinal image quality assessment method based on two aspects: image clarity and field definition. They calculated the total length of vessels as a measure to describe the clarity of retinal image. Therefore, they applied a vessels segmentation
algorithm within a region centered on the fovea instead of the whole image. The second aspect discussed was field definition. An image was defined as having adequate field definition if it respects all of the constraints listed in Table 3.2:
Table 3.2: Field definition metric and constraints required for adequate field definition
Field Definition Metric Constraint
, the distance between optic disc and the edge of the
circular image
, the distance between fovea and the edge of the
circular image.
, the angle of the line joining the center of the optic
disc to the fovea
the length of the vessel arcades
They used disc diameter (DD) as a dimensional unit (246 pixels). Hence, for the purpose of implementing field definition aspect, retinal components segmentations are necessary. The Hough transform was applied to detect arcade vessel by employing semielliptical template. And also the Hough transform was applied to detect the optic disc with a circular template. The fovea was detected by identifying maximum cross-correlation between the image and predefined fovea template.
They employed 1039 retinal images which were graded by a medical expert for image clarity and field definition. They reported a sensitivity of 100% and specificity of 90.9% for the detection of inadequate image clarity, a sensitivity of 95.3% and specificity of 96.4% for the detection of inadequate field definition and a sensitivity of 99.1% and specificity of 89.4% for the detection of inadequate overall quality. According to the obtained results this method enables to classify retinal images in two groups: good and bad quality. In 2008, Giancardo et al. [38] presented a method inspired from the method of Niemeijer et al. [27]. They only focused on eye vessels as shown in Figure 3.4.
Figure 3.4: Feature vector composition reported by Giancardo et al.[38], (a) Original Image, (b) Mask detected and fitted ellipse (dashed line), (c) Vessel Segmentation, (d) Local window in
polar coordinates and (e) Color histogram (waiting for permission) [38]
The mathematical morphology method presented by Zana and Klein [39] was used in order to detect the visible eye vessels. Afterward, as shown in Figure 3.4 (d), the retinal image was divided into eighteen polar windows. The vessel density of each window was computed by Equation and was stored in the feature vector.
(3. 7)
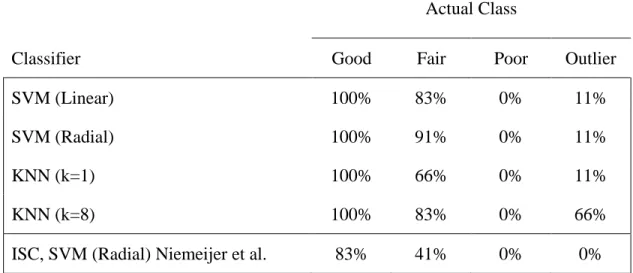
Moreover, 5 bins normalized histogram in RGB color spaces were stored in the feature vector. The obtained feature vector was considered as the input of a classifier algorithm. Four different classifier methods were compared: Support Vector Machines (SVM) and K-Nearest Neighbour (KNN). The employed dataset consisted of 84 macula centered fundus images from which 24 images (12 “Good” and 12 “Poor”) were extracted and used for training phase. These images
were classified by medical expert in 4 classes: “Good”, “Fair”, “Poor” and “Outliers” in order to evaluate performance of the method. Table 3.3 shows the accuracy obtained for each classifier.
Table 3.3: Performance comparison between Giancardo et al.’s method and Niemeijer et al approach
Actual Class
Classifier Good Fair Poor Outlier
SVM (Linear) 100% 83% 0% 11%
SVM (Radial) 100% 91% 0% 11%
KNN (k=1) 100% 66% 0% 11%
KNN (k=8) 100% 83% 0% 66%
ISC, SVM (Radial) Niemeijer et al. 83% 41% 0% 0%
These results show that Giancardo et al.’s method is suitable for good quality images. However, it cannot be used as a reliable strategy for outlier and poor quality images, since the method is based on vessel segmentation being prone to error when dealing with these kinds of images. The time consumed for quality assessment of each retinal image was around 4 seconds on a 2.4 GHz machine (with 2 GB of memory).
In 2011, Hunter et al. [40] proposed a retinal image quality assessment method based on measuring contrast and quantity of visible blood vessels. The contrast between the fovea region and retina background was calculated. The amount of contrast ( was considered as the first indicator of retinal image quality assessment. Hence, the contrast calculated between the average intensity of region with ten pixels radius ( ) and a doughnut-shaped region with an inner and an outer radii and . The visibility of small blood vessels within one Disc Diameter (1DD) of the fovea was considered as a second indicator of quality assessment. Hence, the fovea was first located by the algorithm presented by Lowell et al. [41]. The retinal vessels were then segmented by using previously proposed algorithm of Hunter et al.[42]. Therefore, a vascular metric was defined by:
(3.8)
where , S is the number of vascular segment, is the number of pixels in the segment, is the local contrast with local background retina and is the average distance of pixels from the macula center.
The overall image quality was measured by:
(3.9)
These images were first classified in five groups by medical experts. Table 3. 4 shows the range of for five quality categories. The thresholds were empirically determined to minimize the category error using a reference set of 100 images categorized by medical expert. Hunter et al. used 200 retinal images with 760×570 pixels in order to evaluate the developed method. They achieved 100% sensitivity and 93% specificity.
This method focused only on the macula region, and not on the other eye components such as clarity of optic disc. Information about computation time for this methodology was not reported.
3.2.4 Retinal IQA based on Generic and Structural Criteria
In 2010, Paulus et al. [29] introduced a new approach, for evaluating retinal image quality based on both generic and structural criteria. They focused on structural information of relevant
Table 3. 4: Range of for five quality categories [40] Category Minimum Maximum
1 331 -
2 101 330
3 36 100
4 6 35
component but without using segmentation method. They applied k-mean clustering on the pixels intensity in order to incorporate structural criteria. They chose k=5 for clustering approach empirically. Afterwards, two types of features i.e. cluster size and inter cluster differences were calculated in order to measure the recognazibility and differentiability of important components. Moreover, a sharpness metric was used to calculate the number of sharp edges and average strength of edges in order to evaluate edges’ strength and detect how clearly the components are separated from each order. The sharpness metric was defined as bellow:
(3.10) (3.11)
where is the number of sharp edges, is the average strength of edges, is the gradient magnitude image that are normalized into range [0;1] and n and m are the input image sizes. To incorporate generic image quality, three Haralick features [43] were used. They used energy feature in order to describe image homogeneity, entropy feature as a description of common image sharpness and contrast feature. Five measured size of cluster, ten inter cluster differences, two sharpness metrics and three Haralick features were combined in one feature vector. Afterward, SVM with radial basis function was used as a classifier approach. The leave-one-out strategy was used to evaluate the functionality of the method. The data set used for evaluation step contained 301 retinal images (65 images with bad quality and 236 images with good quality). They tested different combination of features. The best performance was achieved when using the combination of clustering and sharpness metric and Haralick features as shown in Table 3. 5. This method is based on combination of generic and structural features and exploits the best set of generic features such as sharpness and textural features. Although this method analyzes the structural components, it does not use any segmentation algorithm. In 2012, Yu et al. [30] proposed an algorithm based on local and global features including two main steps. The first one was features extraction, in which the global histogram features, textural features and vessel density as well as local sharpness metric were extracted from retinal images. The vessel densities were measured in order to evaluate the sharpness of dark vessels because the vessel segmentation
methods are sensitive to blurry vessels. The retinal vessels were segmented using previously proposed algorithm of Yu et al. [44].
Table 3. 5: Performance of Paulus et al. method using different features [29]
Features Sensitivity Specificity
Haralick 90.7% 89.7% Sharpness 46.2% 79.4% Clustering 89.2% 86.3% Clustering+ sharpness 87.7% 86.4% Haralick+ sharpness 95.4% 91.0% Haralick+ clustering 93.9% 90.4%
Haralick+ clustering+ sharpness 96.9% 91.7%
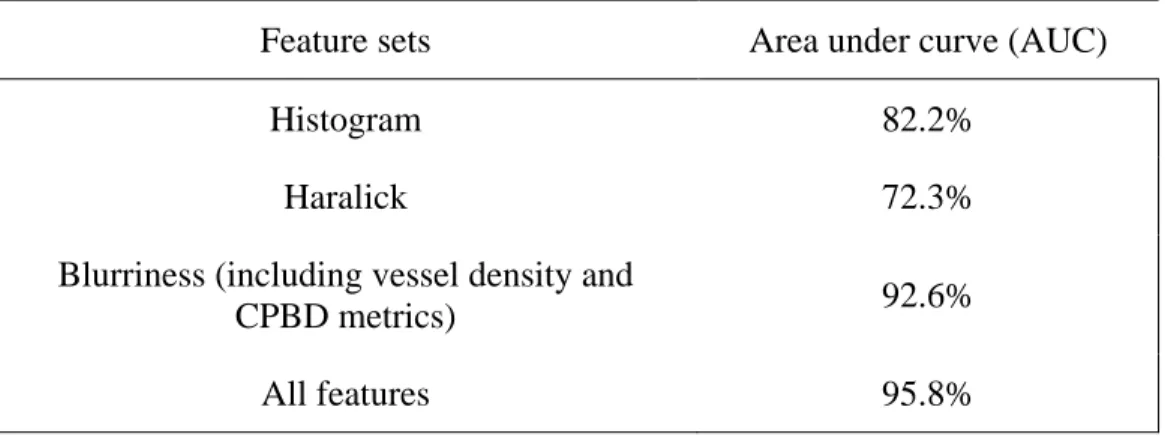
The vessel segmentation method was applied after adaptive histogram equalization and illumination correction to remove uneven illumination and enhance the contrast in retinal images. The ratio of the area of segmented vessel over the area of retinal images was calculated as the vessel density feature. Histogram features were extracted from RGB color spaces in order to describe brightness, contrast and lightness homogeneity of the image. Histogram features were variance, mean, skewness, kurtosis and the first three CDF quartiles. Five Haralick features consisting in entropy, contrast, correlation, energy and homogeneity were used in order to incorporate textural features. A local sharpness was measured by Cumulative Probability of Blur Detection (CPBD) proposed by Narvekar et al.[45]. The second step was image classification based on the extracted features. A Partial Least Square (PLS) classifier was used in order to classify images in two groups: good and bad quality. A data set consisting of 1884 retinal images (4752 3168) was used for evaluation step. For system validation leave-one-out cross-validation method was applied. Different feature sets and combination of all features were tested as reported in Table 3. 6. The best classification performance was achieved by a combination of all features (95.8% of AUC). The blurriness feature led to better performance than other feature sets. This method integrated global texture features, histogram features and vessel density with a local
![Figure 3.1: Examples of gradable (left) and ungradable (right) retinal images with the corresponding edge distributions (waiting for permission) [23]](https://thumb-eu.123doks.com/thumbv2/123doknet/2330135.31496/40.918.191.729.103.512/figure-examples-gradable-ungradable-retinal-corresponding-distributions-permission.webp)
![Figure 3.2: Scatter plot showing the separability of the three classes “Good”, “Fair” and “Bad” retinal images (waiting for permission) [23]](https://thumb-eu.123doks.com/thumbv2/123doknet/2330135.31496/41.918.168.753.108.535/figure-scatter-showing-separability-classes-retinal-waiting-permission.webp)
![Figure 3.4: Feature vector composition reported by Giancardo et al.[38], (a) Original Image, (b) Mask detected and fitted ellipse (dashed line), (c) Vessel Segmentation, (d) Local window in](https://thumb-eu.123doks.com/thumbv2/123doknet/2330135.31496/46.918.213.710.103.494/feature-composition-reported-giancardo-original-detected-vessel-segmentation.webp)
![Table 3. 5: Performance of Paulus et al. method using different features [29]](https://thumb-eu.123doks.com/thumbv2/123doknet/2330135.31496/50.918.184.740.211.526/table-performance-paulus-et-method-using-different-features.webp)