HAL Id: hal-00317884
https://hal.archives-ouvertes.fr/hal-00317884
Submitted on 14 Oct 2005
HAL is a multi-disciplinary open access
archive for the deposit and dissemination of
sci-entific research documents, whether they are
pub-lished or not. The documents may come from
teaching and research institutions in France or
abroad, or from public or private research centers.
L’archive ouverte pluridisciplinaire HAL, est
destinée au dépôt et à la diffusion de documents
scientifiques de niveau recherche, publiés ou non,
émanant des établissements d’enseignement et de
recherche français ou étrangers, des laboratoires
publics ou privés.
Observations in equatorial anomaly region of total
electron content enhancements and depletions
N. Dashora, R. Pandey
To cite this version:
N. Dashora, R. Pandey. Observations in equatorial anomaly region of total electron content
enhance-ments and depletions. Annales Geophysicae, European Geosciences Union, 2005, 23 (7), pp.2449-2456.
�hal-00317884�
SRef-ID: 1432-0576/ag/2005-23-2449 © European Geosciences Union 2005
Annales
Geophysicae
Observations in equatorial anomaly region of total electron content
enhancements and depletions
N. Dashora and R. Pandey
Department of Physics, M. L. S. University, Udaipur 313 001, India
Received: 30 March 2005 – Revised: 10 August 2005 – Accepted: 9 September 2005 – Published: 14 October 2005
Abstract. A GSV 4004A GPS receiver has been operational
near the crest of the equatorial anomaly at Udaipur, India for some time now. The receiver provides the line-of-sight total electron content (TEC), the phase and amplitude
scin-tillation index, σφ and S4, respectively. This paper presents
the first results on the nighttime TEC depletions associated with the equatorial spread F in the Indian zone. The TEC depletions are found to be very well correlated with the
in-creased S4index. A new feature of low-latitude TEC is also
reported, concerning the observation of isolated and local-ized TEC enhancements in the nighttime low-latitude iono-sphere. The TEC enhancements are not correlated with the
S4index. The TEC enhancements have also been observed
along with the TEC depletions. The TEC enhancements have been interpreted as the manifestation of the plasma density enhancements reported by Le et al. (2003).
Keywords. Ionosphere (Equatorial ionosphere; Ionospheric
irregularities)
1 Introduction
Equatorial spread F (ESF) refers to the plasma density ir-regularities, encompassing a wide range of scale sizes, from a few hundred km down to a few cm. Plasma depletions are the irregularities of the largest scale sizes (up to a few hundred km) that are associated with the ESF, wherein the plasma density may be lowered by up to three orders of mag-nitude compared to the background plasma density (Hanson and Sanatani, 1973). The characteristics and morphology of these depletions, that has been obtained mainly with the Jica-marca radar (e.g. Woodman and La Hoz, 1976), and substan-tiated by the satellite-based instruments and Altair radar ob-servations (McClure et al., 1977; Dyson and Benson, 1978; Muldrew, 1980; Tsunoda, 1980; Tsunoda et al., 1982; Kil and Heelis, 1998; Yeh et al., 2001), are very well docu-mented. Theoretical and observational investigations indi-Correspondence to: R. Pandey
(pandey [email protected])
cate that these depletions are generated on the bottomside of the nighttime equatorial F region and rise to higher altitudes due to the non-linear evolution of the generalized Rayleigh-Taylor and E×B plasma instabilities (Kelley, 1989; Fejer et al., 1999). These depletions are field aligned and involve the uplift of the entire flux tube. Satellite observations have
revealed the presence of the depletions up to ±20◦magnetic
latitude.
Ionospheric plasma density irregularities are an impedi-ment to the radio wave communication, as they result in scat-tering of the incident radio waves, practically at all frequen-cies of interest. This phenomenon, known as the ionospheric scintillations, refers to the rapid fluctuations of the phase and amplitude of the RF signal, which arise when an RF signal passes through the ionospheric region that is embedded with the plasma density irregularities. In the past, radio beacon satellites transmitting signals in the VHF range have been used to study the ionospheric scintillations in the Indian (e.g. Rastogi et al., 1977; Chandra et al., 1979; Rastogi, 1982; Pathak et al., 1995) and American zone (e.g. Aarons, 1982; Basu and Basu, 1985). The scintillation effect is not lim-ited to just the VHF range. Signal fluctuations due to the F region plasma density irregularities have been reported at a wide range of frequencies (Aarons, 1993), even as high as 7 GHz (Fang and Pontes, 1981).
With the advent of the satellite-based navigation using the GPS satellites, interest in the UHF scintillations is re-vived. Recent observations (Beach and Kintner, 1999; Bhat-tacharyya et al., 2000; Valladaras et al., 2004), using the GPS satellites in the equatorial and low-latitude zone, have re-vealed the occurrence of the UHF scintillations and the fluc-tuations in the total electron content (TEC). Since the TEC
values are known to be highest around ±15◦magnetic
lat-itude (more commonly known as the Appleton anomaly or the equatorial ionization anomaly region), any fluctuations in the TEC at these latitudes would result in severe scintilla-tions, causing signal degradation.
Yet another impediment to the satellite-based navigation arises from the gradients in the TEC. This is because the range error is proportional to the TEC itself. Thus large
2450 N. Dashora and R. Pandey: TEC enhancements and depletions gradients in the TEC, which is a common feature in the
anomaly region, may introduce intolerable range errors in the satellite based navigation and degrade the GPS
sig-nal. Udaipur is situated (Geog Lat. ±24.6◦N, Geog.Long.
±73.7◦E, ±15.6◦N MLAT) near the crest of the Appleton
anomaly, and therefore is the most suited place for the mea-surement of TEC and scintillations. This has been the moti-vation to initiate measurements of the UHF scintillations and TEC at Udaipur.
2 Experimental details
UHF scintillations and TEC have been measured using the GSV 4004A GPS Ionospheric Scintillation and TEC Moni-tor (GISTM) of M/s GSV in Silicon Valley, USA. The sys-tem (GISTM) provides true amplitude, single frequency car-rier phase measurements and TEC measurements from up to 11 GPS satellites in view, simultaneously, and provides outputs in 22 receiver channels. The receiver and recording system estimates the phase and amplitude scintillation pa-rameters and code/carrier divergence from the L1 frequency (1575.42 MHz) GPS signals. The TEC is computed from the combined L1 and L2 (1227.6 MHz) pseudo ranges and carrier phase. The receiver uses wide bandwidth tracking loops and an internal, phase stable, ovenized, crystal oscilla-tor to compare the phase measurements with the actual car-rier phase GPS observations. Thus, the real-time values of
the amplitude scintillation index, S4, and the phase
scintilla-tion index, σφ, computed over periods of 1, 3, 10, 30, and
60 s, averaged over one minute are obtained. Additionally, the 4 pairs of TEC and TEC rate values computed every 15 seconds are also provided. Thus the equipment is
ide-ally suited for the studies of the S4 index, TEC and TEC
rate etc., simultaneously. Of the various parameters, results
pertaining to the S4 and TEC only would be presented and
discussed here. The amplitude scintillation index S4(Briggs
and Parkins, 1963) is given by
S4=
s
hI2i − hI i2
hI i2 (1)
where I is the intensity (square of the amplitude) of the re-ceived signal. TEC is the number of electrons in a
ver-tical column of 1m2 cross section, from the height of the
GPS satellite (∼20 000 km) to the observer at ground. The
TEC is measured in TEC units, where 1 TEC unit=1016
elec-trons m−2. Dual frequency GPS receivers operate by
com-paring the time delay, δt, between the L1 and L2 frequencies.
δt cannot be measured at one frequency with a standard
re-ceiver clock, but the difference in δt at two different frequen-cies can be measured. This difference is used to calculate the TEC as given below:
4(δt )=δtL1−δtL2=40.3∗TEC∗
(fL21−fL22)
(c ∗ fL21∗fL22). (2)
3 Observations
The results presented here pertain to the equinoctial months of October 2004 and February 2005, when the geomagnetic
quiet conditions prevailed, as ascertained from the Dst index.
Results for different satellite passes, designated by a pseu-dorandom number (PRN) on different dates, are shown in the following diagrams. Each of the figures has four panels. The horizontal axis of each panel corresponds to the univer-sal time (UT). The corresponding local time can be obtained by adding 5 h 30 min to the UT. The top panel of each figure gives the variation of the satellite elevation angle.
The second panel depicts the geomagnetic latitude and geographic longitude of the ionospheric pierce point (IPP), computed from the elevation and azimuth angles of the satel-lite at each instant of its pass, as seen from Udaipur. For IPP computations, a thin ionospheric shell at an altitude of 350 km was assumed. We have preferred to give the geo-magnetic latitude over the usual geographic latitude because the former is more relevant to the equatorial spread F phe-nomena.
The third panel gives the variation of the line-of-sight TEC
with the universal time. The S4index derived from the L1
signal is plotted in the fourth panel. Since the received signal at low elevation angles of the satellite may suffer from the
multipath reflections, a horizontal line at ±20◦elevation has
been drawn in the top panel as a demarcation line. Thus,
observations for elevation angles lower than ±20◦shall not
be considered. A demarcation line at the S4index value of
0.2 has been drawn to emphasize that values greater than this imply a significant level of scintillations.
A TEC depletion associated with the equatorial plasma bubble has been defined by Valladaras et al. (2004). Accord-ingly, the TEC depletion consists of a sudden reduction in TEC followed by a recovery to a level near the TEC value preceding the depletion. As noted by Valladaras et al. (2004), processes, such as the nighttime decay of the F layer and the density redistribution caused by the Fountain effect also lessen the TEC values. But these processes result in shal-low TEC slopes and an absence of the recovery segment. As noted above, changes in the slant length can also result in a slow variation of the TEC. All such cases have been ex-cluded from the identification of TEC depletion. Using the 630.0-nm airglow emissions, Weber et al. (1996) have shown that the TEC depletions are a manifestation of the equatorial plasma depletion. The general morphology of the TEC de-pletions and their association with strong VHF scintillations, using the data from the South American zone, were described by Das Gupta et al. (1983).
3.1 Depletions in TEC
Figure 1 gives the results for satellite PRN 9 on 5 October 2004. The top panel of the diagram, which is a plot of the satellite elevation angle with UT, shows that the satellite is
observable from about 6◦above the horizon, and its highest
0 20 40 60 80 Elevation 5 OCT 2004 PRN 9 0 10 20 30 40 Geomag. Lat. Mag. Lat. G. Lon. 60 65 70 75 80 Geog. Long. 30 50 70 90 TECU 12 13 14 15 16 17 18 19 0 0.2 0.4 0.6 0.8 1 Universal Time ( Hrs ) S4 Index a a’
Fig. 1. Variation of TEC and S4index on 5 October 2004 for PRN 9.
The top panel gives the satellite elevation. The second panel gives the variation of MLAT and longitude of the ionospheric pierce point (IPP) for a thin ionospheric shell at an altitude of 350 km. Third panel gives the variation in the slant TEC. The fourth panel gives the S4index. The horizontal axis for each panel is the Universal Time (UT) shown in the last panel. Depletion in the TEC is obvious between 16:00 UT and 17:00 UT. The S4index shoots up with the
occurrence of the depletion in TEC.
The satellite sets at about 17:00 UT. The MLAT and geo-graphic longitude of the IPP for this satellite pass are plot-ted in the second panel. In this panel, the curve drawn with a solid line is for the MLAT, and the broken line curve is for the longitude of the IPP. The scales are given as the left and the right ordinate, respectively. It can be seen from the second panel that while the MLAT of the IPP varies from
about 27◦N to 4◦N, its longitude is nearly constant, around
70◦E, for the entire pass of the satellite. The variation of
the TEC is shown in the third panel of Fig. 1. It can be seen from Fig. 1 that the TEC values decrease gradually with increasing satellite elevation angle, reaching a broad min-ima at the highest elevation angle attained by the satellite prior to 15:00 UT. Thereafter, the TEC increases as the el-evation angle decreases. This variation can be explained in terms of the variation in the slant length and the processes noted earlier. There is a sudden reduction in TEC around 16:30 UT. This region has been highlighted by two vertical
lines, marked a and a0. The reduction in TEC has been
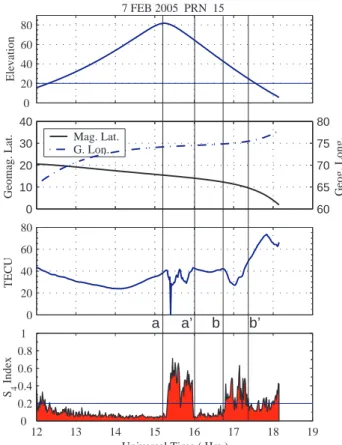
iden-0 20 40 60 80 Elevation 7 FEB 2005 PRN 15 0 10 20 30 40 Geomag. Lat. Mag. Lat. G. Lon. 60 65 70 75 80 Geog. Long. 0 20 40 60 80 TECU 12 13 14 15 16 17 18 19 0 0.2 0.4 0.6 0.8 1 Universal Time ( Hrs ) S 4 Index a a’ b b’
Fig. 2. Same as Fig. 1, but for 7 February 2005 for PRN 15. Two
consecutive depletions between 15:00 UT and 16:00 UT with and a well-separated TEC depletion around 17:00 UT are shown in the third panel. All three depletions are of about 15 TECU. The S4
index is high only when the depletions in TEC are seen.
tified as a plasma depletion, wherein the TEC decreased by
about 15 TEC units. The S4 index is less than 0.2 prior to
the appearance of the depletion in TEC. It suddenly shoots to a value of about 0.6, coinciding with the occurrence of the depletion. For the observed depletion, the MLAT of the IPP
varies from about 12◦N to 10◦N. Thus, the depletion is far
away from the magnetic equator. Its longitude is, however,
nearly constant, around 70◦E. The TEC values recover after
the dip and increase monotonically thereafter. A sudden drop in TEC to zero TEC, at the eastern end of the depletion, is a case of the cycle slip. It implies a sudden loss of the phase lock of the signal, either due to increased scintillation activity
(S4is about 0.8), or, due to non-ionospheric causes.
Results obtained on 7 February 2005 are presented in Fig. 2 for PRN 15. As is evident from the top panel of the figure, this satellite attains a very high elevation, about
80◦, when seen at Udaipur. For the entire pass of the
satel-lite, the range of MLAT and longitude of the IPP is quite
wide, about 18◦ and 10◦, respectively. Two consecutively
located depletions in TEC, wherein the TEC varied by about 15 TECU, are seen between 15:00 and 16:00 UT. This region
has been highlighted by vertical lines marked a and a0. The
2452 N. Dashora and R. Pandey: TEC enhancements and depletions 0 20 40 60 80 Elevation 28 OCT 2004 PRN 5 0 10 20 30 40 Geomag. Lat. Mag. Lat. G. Lon. 60 65 70 75 80 Geog. Long. 0 20 40 60 80 100 120 TECU 12 13 14 15 16 17 18 19 0 0.2 0.4 0.6 0.8 1 Universal Time ( Hrs ) S4 Index a a’ b b’
Fig. 3. Variation of TEC and S4on 28 October 2004 for PRN 5. A
series of depletions in TEC are seen. The S4index increases only
when the depletions occur. The rest of the labels are the same as in Fig. 1.
elevation (∼27◦). Prior to the appearance of the depletions,
the S4index was almost at the noise level. The S4index
sud-denly shoots up with the appearance of these depletions and is about 0.6. Yet another depletion of 15 TECU, marked
be-tween the vertical lines b and b0, is seen around 17:00 UT.
For this depletion, the S4is also quite high, around 0.5.
Between the two sets of depletions, the variation in TEC is smooth and the scintillation index is at the noise level. The IPP geographic longitude between the times of appearance of the two sets of the depletions remains nearly constant and
is about 75◦E. This implies that these depletions are nearly
field aligned and are occurring at well-separated distances along the field line.
A series of depletions in TEC were observed on 28 Oc-tober 2004 for PRNs 5 and 30. Results for these PRNs are given in Figs. 3 and 4, respectively. In case of Fig. 3, the
highest elevation attained by the satellite is about 70◦. For
most of its pass, the satellite traversed along the same lon-gitude. As a matter of fact, almost all GPS satellites have a very slow east-west motion. Thus these satellites offer an opportunity for observations along the same field line. After
about 13:00 UT, when the satellite was 20◦above the
hori-zon, the TEC values vary smoothly up to about 15:45 UT. Thereafter, the TEC variation shows a series of well-defined
0 20 40 60 80 Elevation 28 OCT 2004 PRN 30 0 10 20 30 40 Geomag. Lat. Mag. Lat. G. Lon. 60 65 70 75 80 Geog. Long. 20 40 60 80 TECU 13 14 15 16 17 18 19 20 0 0.2 0.4 0.6 0.8 1 Universal Time ( Hrs ) S 4 Index a a’ b b’
Fig. 4. Variation of TEC and S4index on 28 October 2004 for
satellite PRN 30. Again, a series of depletions in TEC are observed. As in previous cases, here also, the S4index is high only when the
depletions in TEC occur. The rest of the labels are the same as in Fig. 1.
depletions. The fluctuations in TEC are seen between two well-separated regions. The first region is occurring between 15:45 and 17:00 UT, highlighted with vertical lines, marked
a and a0. This region is embedded with a number of
well-separated depletions. The second region is between 17:15
and 18:00 UT, marked as vertical lines b and b0. Although
fluctuations in TEC are seen beyond the vertical line b0, these
are ignored as the satellite elevation is below 20◦.
The depletions below 20◦, though ignored, may not be the
artifacts. An interpolation of TEC between the region a and
a0, would imply that the whole region is representing a
big-ger depletion, that is embedded with smaller depletions. In
the region bounded between a0 and b, the TEC variation is
regular and smooth. Another set of depletions is seen in the
region bb0. The latitudinal extent of the IPP for the first
re-gion is from 15◦N to 12◦N. But the geographic longitude
does not vary much, and is around 73◦E. For the second
re-gion, this latitudinal range is from 10◦N to 8◦N. While the
first of these regions is seen at a higher range of elevation
angle, 70◦ to 40◦, the second one is observed for lower
el-evation angles, between 30◦and 15◦. The S4index in each
of these regions is seen to be very well correlated with the occurrence of depletions in TEC. The most striking feature
of the scintillation index is the complete absence of
scintil-lations between the two sets of depletions (i.e. a0b). This is
also the region where the TEC variation is smooth. Figure 4 shows the results for PRN 30 on 28 October 2004. These re-sults are very informative as the trajectories of PRN 30 and PRN 5 are nearly the same. PRN 30 appears about an hour after the PRN 5, and the maximum elevation for PRN 30 is
about 10◦lower than for PRN 5.
A comparison of TEC in Figs. 3 and 4 reveals its shape and value to be nearly the same from about 14:00 UT to 15:30 UT. As is the case in Fig. 3, a series of depletions also appear between 15:30 UT and 17:00 UT in Fig. 4. This
re-gion is marked with vertical lines aa0. The TEC variation in
the region marked a0b is smooth in both figures, although the
time extent in Fig. 4 is much larger than in Fig. 3. The
re-gion marked bb0in Fig. 4 is replete with depletions as is the
case in Fig. 3. The most striking feature in Fig. 4 is the
com-plete absence of scintillations in the region a0b, where the
TEC variation is smooth. The regions aa0and bb0show
scin-tillations, co-occurring with the depletions in the TEC. The
MLAT of IPP varies between 18◦N and 10◦N, in the whole
region ab0in Fig. 4, whereas for Fig. 3, this range is between
15◦N and 8◦N. The longitude of the IPP is 73◦E and 70◦E,
in Fig. 3 and Fig. 4, respectively. As a matter of fact, Figs. 3 and 4 represent the case of viewing of the same part of the ionosphere from two slightly different elevations. The results of Figs. 3 and 4 imply a latitudinal as well as longitudinal extent of the plasma density depletions that manifest as TEC fluctuations. As noted earlier, the depletions in TEC are well correlated with the increases in scintillation index.
3.2 Enhancements in TEC
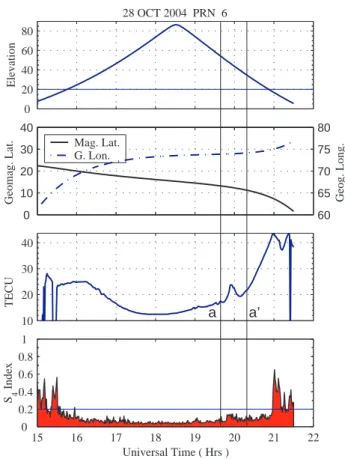
A very interesting case of the TEC variations has been ob-tained on 28 October 2004 for PRN 6, as shown in Fig. 5. PRN 6 passes over the zenith at Udaipur. As the satellite elevation increases, the TEC decreases due to reduced slant length. Beyond the zenith, the TEC increases systematically. A sudden enhancement of about 5 TECU is seen around 20:00 UT. The temporal width of the enhancement is about half an hour. The local time is past 01:30 h. The MLAT of
the IPP at this hour is about 12◦N. Thus, the enhancement in
TEC is located far away from the equator, near the anomaly
crest latitude. The S4index around 20:00 UT is well below
0.2. Thus, unlike the depletions in TEC, which had a corre-sponding increase in the scintillation index, the enhancement is devoid of such an increase. To the best of our knowledge, such an isolated and localized enhancement in TEC has not been reported previously with GPS satellites. The very fact that a TEC enhancement does not have an associated scintil-lation suggests a different mechanism for its generation.
3.3 Consecutive enhancements and depletions in TEC
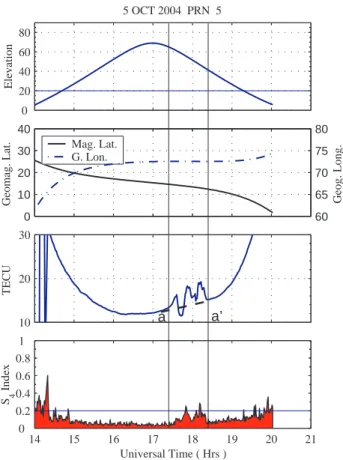
Consecutive enhancement and depletions in TEC were ob-served on 5 October 2004 as shown in Fig. 6 for PRN 5. The variation in TEC is seen to be symmetric with respect to the
0 20 40 60 80 Elevation 28 OCT 2004 PRN 6 0 10 20 30 40 Geomag. Lat. Mag. Lat. G. Lon. 60 65 70 75 80 Geog. Long. 10 20 30 40 TECU 15 16 17 18 19 20 21 22 0 0.2 0.4 0.6 0.8 1 Universal Time ( Hrs ) S 4 Index a a’
Fig. 5. Observation of a TEC enhancement around 20:00 UT on
28 October 2004 for PRN 6. The S4is very low when the TEC
enhancement occurs. The rest of the labels are the same as in Fig. 1.
elevation profile. There is a broad minimum in TEC coin-ciding with the maximum elevation. The figure shows con-secutive depletions and enhancements around 18:00 UT. The depletions, as well as the enhancements, are about 5 TECU. The identification of the features as enhancements is based on the interpolation of the TEC variation from 17:30 UT to 18:30 UT. The interpolation of the TEC is shown with
a dashed line in the diagram. For these features the S4
in-dex was not significant. For these features, the longitude of
the IPP was nearly same (73◦E) and the MLAT varied from
15◦N to 13◦N. A nearly constant longitude of the IPP
im-plies that these features are field aligned.
4 Discussion and conclusions
The F region plasma is known to be incompressible. This precludes in-situ production of ionization irregularities in the F-region and requires their transportation from other regions to explain their existence in the F region. The computer sim-ulation work of Zalesak and Ossakow (1980) and Zalesak et al. (1982) demonstrated that within a very short time pe-riod, the modulations in the plasma density that were present at the bottom side grew sufficiently in amplitude so that a low plasma density region (bubble) could push through to the top
2454 N. Dashora and R. Pandey: TEC enhancements and depletions 0 20 40 60 80 Elevation 5 OCT 2004 PRN 5 0 10 20 30 40 Geomag. Lat. Mag. Lat. G. Lon. 60 65 70 75 80 Geog. Long. 10 20 30 TECU 14 15 16 17 18 19 20 21 0 0.2 0.4 0.6 0.8 1 Universal Time ( Hrs ) S4 Index a a’
Fig. 6. Observation of consecutive enhancements and depletions in
TEC on 5 October 2004 for PRN 5. Very weak scintillations are associated with these features. The rest of the labels are the same as in Fig. 1.
side. These upwelling bubbles, called plumes (Woodman and La Hoz, 1976), are oft occurring phenomena in the nighttime equatorial F region. The plasma density depletions, like the ones observed in the low-latitude F region by the AE series satellites, are a manifestation of the plasma bubbles. Thus the bubbles are generated at the bottom side of the equato-rial F region and move to the topside. As the depletions are field aligned, their uplift implies an uplifting of the entire flux tube. If the depletion rises to a sufficiently high alti-tude at the equator, the associated flux tube may connect to the equatorial anomaly zone latitudes. Since the F region density heavily weights the TEC, any variations in the F re-gion plasma density should be reflected in the TEC. Sudden reductions in TEC, observed in the nighttime low-latitude F-region, have been identified with the plasma density deple-tions of the equatorial origin (e.g. Valladaras et al., 2004). Consistent with this definition, the reductions in the TEC re-ported in Figs. 1 through 4 have been identified as a manifes-tation of the plasma density depletions of equatorial origin. The depth of the depletions reported here is consistent with the observations of other workers (Beach and Kintner, 1999; Bhattacharyya et al., 2000; Valladaras et al., 2004). Smaller scale plasma density irregularities are associated with these
depletions and manifest as increase in the S4index. This is
the reason that the increases in the S4index are seen at the
same time when the depletions in TEC are observed. This is true for all the cases reported here. Unlike Valladaras et al. (2004), we have purposefully avoided associating the scintil-lations with the eastern or western wall of the TEC depletion, or with the depth of the depletion, because, such an associ-ation does not yield any fruitful conclusion. In all the cases reported here there is a one-to-one correspondence between
the TEC depletions and the increase in S4 index. We have
also shown that the depletions in TEC are field aligned. This confirms their equatorial origin.
The most striking finding of the present study is the obser-vation of TEC enhancements in localized regions. We have reported the first observation of an isolated TEC enhance-ment at the anomaly zone latitude using the GPS satellites (Fig. 5). An increase of about 5 TECU in less than a 30-min interval, as reported in Fig. 5, cannot be attributed to changes in slant height, or to normal latitudinal variation in plasma density. Most surprisingly, the enhancements were
completely devoid of the associated increase in the S4index.
This leads to the belief that the enhancements in TEC are a local phenomenon, and not connected with the equatorial spread F. Observations of TEC enhancements in association with the depletions in TEC (Fig. 6) have also been reported for the first time here. Again, the time scales of these vari-ations are so small that changes in the slant height or lat-itudinal variation in the plasma density cannot account for these. Weak scintillations were found to be associated with these features. These enhancements and depletions cannot be interpreted in terms of TIDs, as the week preceding the GPS observations was completely devoid of any solar activ-ity. The energy input from the Sun in the high-latitude ther-mosphere is believed to be the cause for the launching of the TIDs.
We wish to emphasize one more aspect of the present observations of the depletions and enhancements in TEC. While Figs. 1 and 6 give the results for the same night, the features observed for the two are totally different. The only major difference is with respect to the longitude of the IPP at
different times. In Fig. 1, the IPP longitude is around 70◦E,
whereas it is around 73◦E in Fig. 6. Similar is the case for
Fig. 5, vis-`a-vis Fig. 3 or Fig. 4. This implies that the en-hancements are highly localized.
Oya et al. (1986) and Watanabe and Oya (1986) have re-ported localized regions of plasma density enhancements co-occurring with the plasma density depletions in the night-time equatorial F region. The plasma density was found to be higher by a factor of about two in these enhancements. They designated these enhancements as plasma blobs. These
plasma blobs were found to maximize around ±20◦MLAT.
They further found that the plasma blobs occur preferen-tially during solstices and periods of low magnetic distur-bances and lower solar radiation. Although no mechanism was given, Oya et al. (1986) and Watanabe and Oya (1986) suggested that the generation mechanisms for the plasma depletions and the enhancements were different. The ion density data given by Kil and Heelis (1998) also reveals a
number of ion density enhancements along with the deple-tions in the ion density. But they did not emphasize these enhancements, as has been pointed out by Le et al. (2003). Recently, Le et al. (2003) have reported localized regions of enhancements in the ion density, occurring with or without the plasma density depletions.
There are a number of reports on the nighttime enhance-ments in the TEC observed with the ATS series satellites (e.g. Janve et al., 1979; Joshi et al., 1990; Balan and Bailey, 1992; Su et al., 1994). Various mechanisms have been proposed to explain these. But the TEC enhancements reported in the present study might not be the same phenomenon as that re-ported with the ATS satellites and would require a different mechanism for their generation. The ATS series satellites are geosynchronous, whereas the GPS satellites are nearly Sun synchronous. The ATS series satellites should, there-fore, provide temporal variation of the TEC at just one iono-spheric pierce point (IPP). The TEC at a given place (IPP) may vary and enhance with time, for different reasons. The TEC enhancement reported with the ATS satellites could not be compared with the present results because the ionosphere of different latitudes and longitudes is scanned as the GPS satellite transits over a receiving station.
The plasma density enhancements observed by Oya et al. (1986), Kil and Heelis (1998) and Le et al. (2003) also could not be compared with those observed with the ATS series satellites. The observations of Oya et al. (1986), Kil and Heelis (1998) and Le et al. (2003) are based on the instru-ments on board the satellites that had a circular orbit (650 km for Hintori, 370 km and 400 km for AE-E, 600 km for ROC-SAT and 850 km for DMSP satellite). These satellites are thus revolving at the same altitude and cover a wide range of latitude and longitude. This is also the case with the GPS satellites and hence these two cases are comparable.
Le et al. (2003) have reported enhancements in the ion density in the topside equatorial F region at 600 km and 850 km. As noted earlier, these measurements have been made using the instruments on board the ROCSAT-1 and DMSP satellites, respectively. These density enhancements have been found to be associated with or without depletions in the ion density. Le et al. (2003) have proposed the map-ping of the polarization electric fields associated with the de-pletions at the equator to be responsible for the generation of the localized regions of plasma enhancements. Accord-ing to this mechanism, the Rayleigh-Taylor plasma instabil-ity is excited within a limited latitudinal extent in the bottom side F region near the equator. The density depletions occur near the equator. The polarization electric fields associated with these depletions lift them up at the equator. While the depletions have a limited latitudinal extent, the polarization field maps to higher latitudes along the field lines. When the depletions rise to the topside F region at the equator, the flux tube associated with these depletions may be connect-ing the F peak in the anomaly zone latitudes. The mapped field in the anomaly zone thus moves the high-density plasma upward so that the density increments occur just above the flux tube. Furthermore, they point out that the density
in-crements are additionally reinforced if the background iono-sphere moves downward. Mapping of the polarization fields associated with depletions would be efficient and effective, if the ionospheric region connected by the geomagnetic field lines has a lower integrated Pedersen conductivity than the region in which the fields are generated. In other words, the currents in the “sink” region should not load the electric field in the “source” region (Rishbeth, 1971; Prakash and Pandey, 1985). Since the TEC is a measure of the integrated (the line-of-sight) plasma density, localized enhancements in the plasma density are likely to be reflected in the TEC. This probably explains the present observations of TEC enhance-ments.
Consecutive depletions and enhancements in TEC could be explained following the arguments put forth by Le et al. (2003). They have argued that when a spacecraft observes both the depletion and enhancement in the plasma density in the same pass, it is most likely that an enhancement is asso-ciated with a different depletion than the one that is observed consecutively with the enhancement.
Acknowledgements. The GSV 4004A GPS receiver and TEC
mon-itor was purchased through the grants from University Grants Com-mission, New Delhi under the DRS program and the X plan. The project is also partially supported through the grants received from Indian Space Research Organization under the RESPOND program. Topical Editor M. Pinnock thanks K. N. Iyer and another referee for their help in evaluating this paper.
References
Aarons, J.: Global morphology of ionospheric scintillations, Proc. IEEE, 70, 360–378, 1982.
Aarons, J.: The longitudinal morphology of equatorial F-layer ir-regularities relevant to their occurrence, Space Sci. Rev., 63, 209–263, 1993.
Balan, N. and Bailey, G. J.: Latitudinal variations of nighttime en-hancements in TEC: Solar and magnetic activity effects, Adv. Space Res., 12, 219–222, 1992.
Basu, Su. and Basu, S.: Equatorial scintillations: Progress since 1SEA-6, J. Atmos. Terr. Phys., 47, 753–768, 1985.
Beach, T. L. and Kintner, P. M.: Simultaneous Global positioning system observations of equatorial scintillations and total electron content, J. Geophys. Res., 104, 22 553–22 565, 1999.
Bhattacharyya, A. Beach, T. L., and Basu, S.: Nighttime equato-rial ionosphere: GPS scintillations and differential carrier phase fluctuations, Radio Science, 35, 209–224, 2000.
Briggs, B. H. and Parkins, I. A.: On the variation of radio star and satellite scintillations with zenith angle, J. Atmos. Terr. Phys., 25, 339–365,1963.
Chandra, H., Vatsa, H. O., Sethia, G., Deshpande, M. R., Rastogi, R. G., Sastry, J. H., and Murthy, B. S.: Ionosphere scintillations associated with features of equatorial ionsophere, Ann. Geophys. 35, 145–151, 1979.
Das Gupta, A., Basu, S., Basu, S., Aarons, J., Klobuchar, J. A., and Bushby, A.: VHF amplitude scintillation and associated electron content depletions as observed at Arequipa, Peru, J. Atm. Terr. Phys., 45, 15–19, 1983.
Dyson, P. L. and Benson, R. F.: Topside sounder observations of equatorial bubbles, Geophys. Res. Lett., 5, 795–798, 1978.
2456 N. Dashora and R. Pandey: TEC enhancements and depletions
Fang, D. J. and Pontes, M. S.: 4/6 GHz ionospheric scintillation measurements during the peak of sunspot cycle 21, COMSAT Tech. Rev., 11, 293–320, 1981.
Fejer, B. G., Scherliess, L., and de Paula, E. R.: Effects of vertical plasma drift velocity on the generation and evolution of equato-rial spread F, J. Geophys. Res., 104, 19 859–19 869, 1999. Hanson, W. B. and Sanatani, S.: Large Ni gradients below the
equa-torial spread -F peak, J. Geophys. Res., 78, 1167–1173, 1973. Janve, A. V., Rai, R. K., Deshpande, M. R., Rastogi, R. C., Jain,
A. R., Singh, M., and Gurm, H. S.: On the nighttime enhance-ments in ionospheric total content at low-latitudes, Ann. Geo-phys., 35, 159–165, 1979.
Joshi, H. P. and Iyer, K. N.: On nighttime anomalous enhancement in ionospheric electron content at lower mid-latitude during solar maximum, Ann. Geophys., 8, 53–57, 1990.
Kelley, M. C.: The Earth’s ionosphere, Plasma physics and electro-dynamics, Academic Press, Inc., San Diego, Calif., 1989. Kil, H. and Heelis, R. A.: Global distribution of density
irregulari-ties in the equatorial ionosphere, J. Geophys. Res., 103, 407–417, 1998.
Le, G., Huang, C. -S., Pfaff, R. F., Su, S. -Y., Yeh, H. -C., Heelis, R. A., Rich, F. J., and Hairston, M.: Plasma den-sity enhancements associated with equatorial sprea F: ROCSAT-1 and DMSP observations, J. Geophys. Res., ROCSAT-108(A8), ROCSAT-13ROCSAT-18, doi:10.1029JA009592, 2003.
McClure, J. P., Hanson, W. B., and Hoffman, J. H.: Plasma bubbles and irregularities in equatorial ionosphere, J. Geophys. Res., 82, 2650–2656, 1977.
Muldrew, D. B.: The formation ducts and spread F and the initiation of bubbles by field aligned currents, J. Geophys. Res., 85, 613– 625, 1980.
Oya, H. T., Takahashi, T., and Watanabe, S.: Observation of low-latitude ionosphere by the impedence probe on board the Hino-tori satellite, J. Geomagn. Geoelectr., 38, 111–123, 1986. Pathak, K. N., Jivrajan, R. D., Joshi, H. P., and Iyer, K. N.:
Char-acterstics of VHF scintillations in the equatorial anomaly crest region in India, Ann. Geophys., 13, 730–739, 1995,
SRef-ID: 1432-0576/ag/1995-13-730.
Prakash, S. and Pandey, R.: Generation of electric field due to grav-ity wave winds and their transmission to other ionospheric re-gions, J. Atmos. Terr. Phys., 47, 363–374, 1985.
Rastogi, R. G., Deshpande, M. R., Vatsa, H. O., Davies, K., Grubb, R. N., and Jones, J. E.: Amplitude scintillations of ATS-6 radio beacon signals within the equatorial electrojet region (Ootaca-mund, dip 4◦ N), Pramana, 8, 1–13, 1977.
Rastogi, R. G.: Solar cycle effect is radio wave scintillations at Huancayo, Indian J. of Radio Space Phys., 11, 215–221, 1982. Rishbeth, H.: Polarization fields produced by winds in the
equato-rial F region, Planet. Space Sci., 19, 357–369, 1971.
Su, Y. Z., Bailey, G. J., and Balan, N.: Night-time enhancements in TEC at equatorial anomaly latitudes, J. Atmos. Terr. Phys., 56, 1619–1628, 1994.
Tsunoda, R. T.: Magnetic filed aligned characteristics of plasma bubbles in the night time ionosphere, J. Atmos. Terr. Phys., 42, 743–752, 1980.
Tsunoda, R. T., Livingston, R. C., McLure, J. P., and Hanson, W. B.: Equatorial plasma bubbles: Vertically elongated wedges from the bottomside F layer, J. Geophys. Res., 87, 9171–9180, 1982. Valladaras, C. E., Villalobos, J., Sheehan, R., and Hagan, M. P.:
Lat-itudinal extension of low-latitude scintillations measured with a network of GPS receivers, Ann. Geophys., 22, 3155–3175, 2004,
SRef-ID: 1432-0576/ag/2004-22-3155.
Watanabe, S. and Oya, H.: Occurrence characteristics of low-latitude ionosphere irregularities observed by impedance probe on board Hinotori satellite, J. Geomagn. Geoelectr., 38, 125–149, 1986.
Weber, E. J., Basu, S., Bullet, T. W., Valladares, C. E., Bishop, G., Groves, K., Kuenzler, H., Ning, P., Sultan, P. J., Sheehan, R. E., and Araya, J.: Equatorial Plasma Depletion Precursor Signatures and Onset Observed at 11◦ South of the Magnetic Equator, J. Geophys. Res., 101, 26 829–26 838, 1996.
Woodman, R. F. and La Hoz, C.: Radar observations of F region equatorial irregularites, J. Geophys. Res., 81, 5447–5466, 1976. Yeh, H. C., Su, S. -Y., and Heelis, R. A.: Storm time plasma
ir-regularities in the pre-dawn hours observed by the low-latitude ROCSAT-1 satellite at 600 km altitude, Geophys. Res. Lett., 28, 685–688, 2001.
Zalesak, S. T. and Ossakow, S. L.: Nonlinear equatorial spread F: Spatially large bubbles resulting from large horizontal scale ini-tial perturbations, J. Geophys. Res., 85, 2113–2142, 1980. Zalesak, S. T., Ossakow, S. L., and Chaturvedi, P. K.: Nonlinear
equatorial spread F: The effect of neutral winds and background Pederson conductivity, J. Geophys. Res., 87, 151–166, 1982.