HAL Id: hal-02637351
https://hal.inrae.fr/hal-02637351
Submitted on 27 May 2020
HAL is a multi-disciplinary open access
archive for the deposit and dissemination of
sci-entific research documents, whether they are
pub-lished or not. The documents may come from
teaching and research institutions in France or
abroad, or from public or private research centers.
L’archive ouverte pluridisciplinaire HAL, est
destinée au dépôt et à la diffusion de documents
scientifiques de niveau recherche, publiés ou non,
émanant des établissements d’enseignement et de
recherche français ou étrangers, des laboratoires
publics ou privés.
3BL Locus for Fusarium Crown Rot Resistance in Bread
Wheat
Jian Ma, Jiri Stiller, Qiang Zhao, Qi Feng, Colin Cavanagh, Penghao Wang,
Donald Gardiner, Frédéric Choulet, Catherine Feuillet, You-Liang Zheng, et
al.
To cite this version:
Jian Ma, Jiri Stiller, Qiang Zhao, Qi Feng, Colin Cavanagh, et al.. Transcriptome and Allele Specificity
Associated with a 3BL Locus for Fusarium Crown Rot Resistance in Bread Wheat. PLoS ONE, Public
Library of Science, 2014, 9 (11), �10.1371/journal.pone.0113309�. �hal-02637351�
Transcriptome and Allele Specificity Associated with a
3BL Locus for Fusarium Crown Rot Resistance in Bread
Wheat
Jian Ma1,2, Jiri Stiller1, Qiang Zhao3, Qi Feng3, Colin Cavanagh4, Penghao Wang4, Donald Gardiner1, Fre´de´ric Choulet5, Catherine Feuillet5, You-Liang Zheng2, Yuming Wei2, Guijun Yan6, Bin Han3, John M. Manners1, Chunji Liu1,6*
1 CSIRO Agriculture Flagship, St Lucia, QLD, Australia, 2 Triticeae Research Institute, Sichuan Agricultural University, Wenjiang, Chengdu, China, 3 National Center for Gene Research, Shanghai Institutes for Biological Sciences, Chinese Academy of Sciences, Shanghai, China,4 CSIRO Agriculture Flagship, Black Mountain, ACT, Australia, 5 INRA-UBP Joint Research Unit 1095, Genetics, Diversity and Ecophysiology of Cereals, Clermont-Ferrand, France,6 School of Plant Biology, Faculty of Science and The UWA Institute of Agriculture, The University of Western Australia, Perth, WA, Australia
Abstract
Fusarium pathogens cause two major diseases in cereals, Fusarium crown rot (FCR) and head blight (FHB). A large-effect locus conferring resistance to FCR disease was previously located to chromosome arm 3BL (designated as Qcrs-3B) and several independent sets of near isogenic lines (NILs) have been developed for this locus. In this study, five sets of the NILs were used to examine transcriptional changes associated with the Qcrs-3B locus and to identify genes linked to the resistance locus as a step towards the isolation of the causative gene(s). Of the differentially expressed genes (DEGs) detected between the NILs, 12.7% was located on the single chromosome 3B. Of the expressed genes containing SNP (SNP-EGs) detected, 23.5% was mapped to this chromosome. Several of the DEGs and SNP-EGs are known to be involved in host-pathogen interactions, and a large number of the DEGs were among those detected for FHB in previous studies. Of the DEGs detected, 22 were mapped in the Qcrs-3B interval and they included eight which were detected in the resistant isolines only. The enrichment of DEG, and not necessarily those containing SNPs between the resistant and susceptible isolines, around the Qcrs-3B locus is suggestive of local regulation of this region by the resistance allele. Functions for 13 of these DEGs are known. Of the SNP-EGs, 28 were mapped in the Qcrs-3B interval and biological functions for 16 of them are known. These results provide insights into responses regulated by the 3BL locus and identify a tractable number of target genes for fine mapping and functional testing to identify the causative gene(s) at this QTL.
Citation: Ma J, Stiller J, Zhao Q, Feng Q, Cavanagh C, et al. (2014) Transcriptome and Allele Specificity Associated with a 3BL Locus for Fusarium Crown Rot Resistance in Bread Wheat. PLoS ONE 9(11): e113309. doi:10.1371/journal.pone.0113309
Editor: Meixue Zhou, University of Tasmania, Australia
Received August 8, 2014; Accepted October 22, 2014; Published November 18, 2014
Copyright: ß 2014 Ma et al. This is an open-access article distributed under the terms of the Creative Commons Attribution License, which permits unrestricted use, distribution, and reproduction in any medium, provided the original author and source are credited.
Data Availability: The authors confirm that all data underlying the findings are fully available without restriction. The RNA sequences were available at the National Center for Biotechnology Information (NCBI) with the accession number of PRJNA263755.
Funding: This publication is based upon work supported by a joint CAS/CSIRO project (Project No R-1910-1) and an ARC Linkage project (Project No. LP120200830). JM is grateful to the Sichuan Agricultural University and the China Scholarship Council for funding his visit to CSIRO Agriculture Flagship. The funders had no role in study design, data collection and analysis, decision to publish, or preparation of the manuscript.
Competing Interests: The authors have declared that no competing interests exist. * Email: [email protected]
Introduction
Fusarium pathogens cause two serious diseases in cereals, Fusarium crown rot (FCR) and Fusarium head blight (FHB). FCR is a chronic problem in many parts of the semi-arid cereal producing regions worldwide including Australia [1]. In contrast, FHB favours environments with high humidity and temperature. It is a sporadic problem in Australia but causes massive annual losses worldwide [2]. Both diseases can produce mycotoxins which can be harmful if present in foods or feeds [3,4].
FHB is one of the most intensively studied diseases. Sources of resistance have been intensively searched [5,6] and numerous quantitative trait loci (QTL) conferring resistance have been reported [3]. The best known source of FHB resistance is from the genotype Sumai 3 and the QTL on chromosome arm 3BS from this genotype is the most potent locus conferring resistance to this
disease [7]. The 3BS locus contains a glycosyltransferase gene that has the potential to detoxify the mycotoxin deoxynivalenol which is also a virulence factor and this may explain the resistance mechanism [7]. This 3BS QTL does not confer any significant level of resistance to FCR in wheat [8]. In addition to the effort of map-based cloning of the 3BS resistance locus [9], transcriptome analysis has also been conducted in recent years to identify genes differentially expressed between FHB resistant and susceptible genotypes [10–15]. Efforts have also been made in transforming defence-related genes into susceptible or moderately susceptible wheat varieties to obtain transgenic plants with improved FHB resistance [16–19].
Compared with the studies on FHB, our knowledge of FCR and its possible resistance mechanisms is limited. There have been some studies on host transcriptional responses during the infection of susceptible genotypes following application of defence inducing
compounds that can reduce FCR symptom development [20,21]. Several QTL have been reported [22–26]. Among these, the one located on chromosome arm 3BL from the Triticum spelta accession ‘CSCR6’ (designated as Qcrs-3B) seems to be highly effective. This QTL accounted for up to 49% of phenotypic variance and provided significant effects in multiple hexaploid genetic backgrounds [24]. Recently, several independent sets of resistant and susceptible near-isogenic lines (NILs) that differ in the 3BL locus for FCR have been developed [27]. These genetic resources provide an ideal tool for studying the host responses to infection associated with resistance to this disease and for identifying genes that co-locate with theQcrs-3B locus.
RNA sequencing (RNA-seq) has become a powerful tool for transcriptome analysis. The approach is not only highly sensitive and efficient for identifying differentially expressed genes (DEGs) [28] but, when combined with genomic and genetic analysis can also be used for detecting SNPs in transcribed genes that co-locate with a target locus [29]. These features of RNA-seq analysis are particularly attractive for applications in hexaploid wheat where multiple homoeologous alleles exist for most genes and transcripts. We thus conducted an RNA-seq analysis against five sets of the NILs developed for theQcrs-3B locus [27], examined DEGs and SNPs between the NIL lines. This analysis provides candidate genes for both the response determined by the 3BL locus as well as those co-located with the 3BL locus that may be genetically causative for resistance. In addition to identifying genes underlying the FCR resistance locus, we were also interested in finding out if expressed genes associated with resistance to FCR were related to those observed by others for FHB.
Materials and Methods Plant materials
Five sets of NILs generated using the heterogeneous inbred family method for the FCR QTL on chromosome arm 3BL reported by Ma et al. [27] were used in this study. Four of these NIL sets, including ‘1R/1S’, ‘2R/2S’, ‘3R/3S’, and ‘4R/4S’, were derived from the population of ‘Janz’*2/‘CSCR6’. The other set, ‘9R/9S’, was derived from the population of ‘Lang’/CSCR6’. ‘R’ isolines are those carrying the resistant allele and ‘S’ isolines are those carrying the susceptible allele at the Qcrs-3B locus. The FCR donor ‘CSCR6’ is a genotype belonging to the taxon T. spelta [24]. The NIL set ‘1R/1S’ (designated as Family A) was used for the primary analysis. The other four NIL sets (designated as Family B) were used for validating results obtained from Family A.
Determination of the QTL Qcrs-3B chromosomal interval
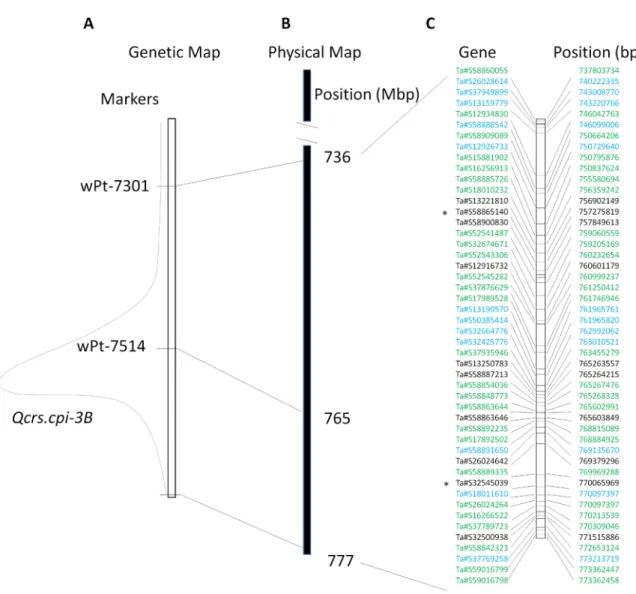
The wheat 3B pseudomolecule ‘traes3bPseudomoleculeV1’of Chinese Spring was downloaded from Generic Genome Browser version 2.3 (https://urgi.versailles.inra.fr/gb2/gbrowse/ wheat_annot_3B/) hosted by Unite´ de Recherche Ge´nomique Info (URGI) in February, 2014 [30]. The DArT marker wPt-7301, which locates proximally to the QTL, was placed at about 736 Mb in the 3B pseudomolecule. Another marker, wPt-7514, which locates near the centre of the QTL was placed at about 765 Mb on the 3B pseudomolecule (Fig. 1). Sequences for the two DArT markers located distally to the QTL, however, were not available. Considering the terminal location of the QTL on this chromosome [24], the most distally located gene on the genomic sequence for this chromosome arm was used as the distal border of this QTL. Thus the size of the QTL interval used in this study could be over-estimated.
Fusarium crown rot inoculation and experimental design
A single isolate of F. pseudograminearum (Fp, CS3427) was used in this study. This is one of the most aggressive isolates collected from northern New South Wales, Australia and maintained in the CSIRO collection [31]. Inoculum was prepared based on the method described before [32].
Surface-sterilized seeds were germinated in Petri dishes on three layers of filter paper saturated with water. Ten seedlings were used in each of the biological replications for all of the experiments conducted. Two-day-old seedlings were inoculated following the method described before [33] with the F. pseudograminearum isolate (Fp-infection) or water (mock). Samples were taken by cutting the shoot base (0–4 cm) at 3 or 5 days post inoculation (dpi) and frozen in liquid nitrogen immediately and kept at 280uC until processed.
Two datasets of RNA sequences were obtained in this study. The first dataset was obtained from Family A. The experimental design for Family A contained two treatments (mock and Fp-infection), two time points (3 and 5 dpi) and six biological replicates (Table S1). The second one was generated from Family B, which were used only to validate those expressed genes with SNPs (SNP-EGs) detected from Family A. A single trial with three biological replications was conducted for these four sets of NILs. Mocks were not used and samples were collected at 5 dpi only. Before RNA isolation, samples from the three biological replica-tions for each of the eight isolines were pooled. Thus, a total of 8 samples (each for a different line of the four sets of NILs) were used for RNA extraction.
RNA extraction, library construction and Illumina sequencing
Total RNA was isolated using a QIAGEN RNeasy plant mini kit (Qiagen, Hilden, Germany) according to the manufacturer’s instructions, using RLT buffer and including the optional on-column DNase I digestion. The yield and purity of each RNA sample was determined by the absorbance (Abs) at 260 and 280 nm and the integrity of all RNA samples was assessed on 1% agarose gels. Each sample of 10 mg of total RNA was sent to Australian Genome Research Facility Ltd (Parkville, Victoria, Australia) for further processing before Illumina HiSeq sequenc-ing. Two technical replications were run for each of the 56 (48 for ‘1R/1S’ and 8 for the other 4 sets of NILs) cDNA libraries with 6 lanes of 100 bp paired-end sequencing. Raw reads were trimmed using a SolexaQA package 2.2 with minimum Phred quality value of 30 and minimum length of 70 bp. The RNA sequences were available at the National Center for Biotechnology Information (NCBI) with the accession number of SRP048912.
Data quality control
For Family A, RNA-seq Illumina fastq sequence datasets were pooled by replicate (6 replicates per time point) at time points 3 dpi and 5 dpi. For Family B RNA sequences were pooled by response to FCR inoculation only (+/2) due to the fact that there was no biological replication used. FastQC (version 0.10.1) was used as a preliminary check that the Phred scores were acceptable. BioKanga (version 2.76.2; developed by bioinformatics team, unpublished) filtering was then employed and reads containing polymorphic variation but not supported by at least two other overlapping reads were removed from the datasets. Additionally, all but one instance of any duplicated reads were removed to reduce the effect of PCR artefacts. All retained reads for alignment were unique.
RNA-seq analyses
Two methods were used in this study to analyse the trimmed RNA reads. One was based on the complete IWGSC (Interna-tional Wheat Genome Sequencing Consortium) chromosome shotgun sequence contigs (CSS-contigs) (www.wheatgenome.org) due to their increased genome coverage for estimating distribu-tions of DEGs and SNPs between the ‘R’ and ‘S’ isolines in the wheat genome. The other was based on UniGene (NCBI, www. ncbi.nlm.nih.gov/) aiming at identifying specific gene(s) underlying FCR resistance.
Distributions of DEGs and SNPs between chromosomes
and on 3B. Following BioKanga (version 2.76.2) filtering, the
retained reads were independently aligned against the complete CSS-contigs and the 3B pseudomolecule using BioKanga. Alignment parameters were set such that a maximum of two substitutions were allowed and no multi-aligned reads were accepted (except for reads mapping to the CSS once and the pseudomolecule). Two additional mismatches were allowed for the first 12 bp of the reads to account for primer artefact. Reads were aligned utilising the paired-end reads with insert sizes from 100 to
2 kbp. PCR differential amplification artefacts were reduced within the sequence alignment processing using BioKanga’s sliding window mechanism. A counts matrix was generated and loaded into R (version 3.0.1) for downstream statistical analysis.
BioKanga SNP calling was run with raw, non-filtered reads aligned against the CSS contigs and 3B pseudomolecule allowing at most two mismatches and at most two additional mismatches for the first 12 bp of the reads accounting for primer artefact. Only unique alignments were accepted. A custom R function was written to identify candidate SNPs underlying the QTL. This method applied multiple criteria to identify trait linked SNPs which identified polymorphisms between the two isolines for a given set of NILs across replicates and was able to detect presence or absence polymorphism. The criteria used for identification of SNPs included: (1) The loci present in all replicates must be homozygous (the dominating nucleotide must have a ratio higher than 0.9; (2) any candidate SNP must have had a minimum of 3 reads coverage. Each candidate SNP was visually checked using the Integrative Genomics Viewer (version 2.3.12).
Figure 1. TheQcrs-3Binterval and 48 unique genes identified in the interval. (A) Genetic map showing the Qcrs-3B interval with two DArT markers which were successfully placed on the 3B pseudomolecule of Chinese Spring. (B) The Qcrs-3B interval on the physical map of the 3B pseudomolecule; and (C) Genes located in theQcrs-3B interval. Differentially expressed genes (DEGs) between the resistant and susceptible isolines were indicated as black for the up- and blue for the down-regulated genes. The expressed genes containing SNP were indicated as green. ‘*’ indicates that they were also DEGs.
doi:10.1371/journal.pone.0113309.g001
UniGene-based analysis of DEGs and SNPs. Analysis of gene expression was performed using BioKanga. Reference sequences used in this analysis included 58,596 of the wheat UniGenes [downloaded from ftp://ftp.ncbi.nih.gov/repository/ UniGene/Triticum_aestivum/of NCBI in Jun of 2012] and the genome sequences of the diploid wheat A-genome progenitorT. urartu and the diploid D-genome progenitor Aegilops tauschii (downloaded from NCBI) [34,35].
The obtained reads were aligned against the 58 K UniGenes and the diploid A and B genome reference sequences with no more than two mismatches allowed. Only those reads matching best with the wheat UniGenes were selected for expression analysis. BioKanga ‘maploci’ was used to normalize counts based on RPKM (Reads per kilobase per million reads). Prior to the differential expression analysis, the 12 replicates (6 biological and 2 technical) for each genotype-treatment-timepoint sample were merged together for a given pair of comparison by BioKanga genDEseq. In total, four pairwise comparisons between genotypes were conducted. These are summarised throughout the paper in the following way: SM3_v_RM3; SM5_v_RM5; SI3_v_RI3 and SI5_v_RI5. Symbols are ‘M’ for mock; ‘I’ forFp-infection; ‘3’ for 3 dpi; ‘5’ for 5 dpi; ‘R’ for the resistant isoline R; ‘S’ for the
susceptible isoline S, and ‘a_v_b’ for comparing object ‘a’ with ‘b’, in which ‘a’ is the control and ‘b’ is the treatment. DEGs were determined with the threshold of FDR#0.01 and the absolute value of log2FoldChange $1 or #21 or ‘inf’ (the value of one
comparative object is zero and the other is not). The R software (version 3.1.0) was used to generate heat maps.
Genes responsive to FCR infection were identified by four pairwise comparisons between the treatments: RM3_v_RI3; RM5_v_RI5; SM3_v_SI3; SM5_v_SI3. The responsive genes after Fp-infection compared with mock were identified with the same method as DEGs: threshold of FDR#0.01 and the absolute value of log2FoldChange $1 or #21 or ‘inf’.
The trimmed sequences for each line-treatment-timepoint sample were pooled together. SNPs between 4 pairwise compar-isons were identified: SM3_v_RM3, SM5_v_RM5, SI3_v_RI3, and SI5_v_RI5. The alignment of reads to the reference sequences was performed with a maximum of 2 mismatches per read. Minimum coverage for the declaration of an SNP was 4 nucleotides. SNPs between the resistant and susceptible isolines were identified using the Biokanga snpmarkers sub-process with a minimum 90% score, i.e., the percentage of a given nucleotide at a SNP position is at least 90% in the resistant or susceptible isolines.
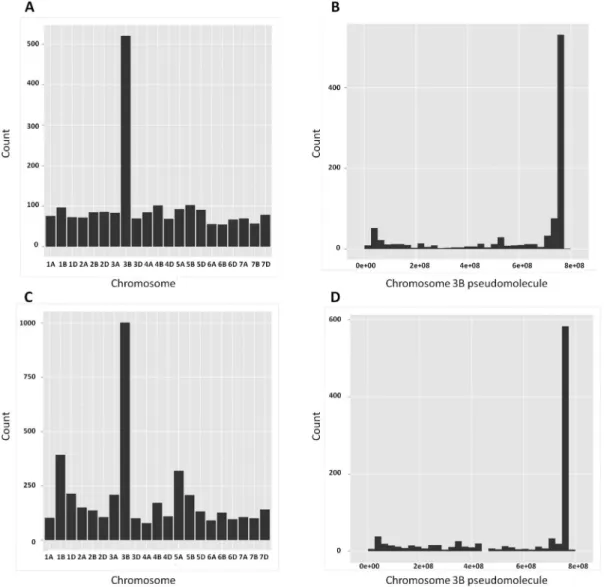
Figure 2. Distribution of DEGs (A, B) and SNPs (C, D) across the 21 chromosomes (left) and along the 3B pseudomolecule (right). Note: 3B pseudomolecule is from short (left) to long (right) arm in base pair (bp).
DEGs and expressed genes containing SNP (SNP-EGs) was mapped in the targeted QTL interval by blasting them against the 3B pseudomolecue. All sequence comparisons were performed using the BLASTN 2.2.26+ algorithm with e-value ,1025 and length .100 bp.
Functional annotation
Functions of UniGenes were annotated using the Blast2GO program (version 2.6.6) with default parameters except that e-value threshold of 10210was used when executing steps of ‘Blast’ and ‘Annotation’. Alignments with a higher score were visually inspected and annotated if a reasonable degree of homology was observed.
Validation of DEGs by real-time qualitative PCR
Among the identified DEGs between the ‘R’ and ‘S’ isolines from Family A, a total of 4 genes were randomly selected and assessed using real-time quantitative PCR (RT-qPCR) given that six biological replicates were used for RNA-seq analysis. Ta.27922.1.S1_x_at, encoding a cyclin family protein, was used as the internal reference gene [36]. Primers were designed based on the tool of Primer-BLAST (http://www.ncbi.nlm.nih.gov/ tools/primer-blast/) and listed in Table S2. The validations were conducted using Family A. FCR inoculation, tissue sampling and RNA extraction were based on the methods as described earlier and three biological replications were used. RNA extraction, cDNA synthesis, and expression analyses were carried out as described by Ma et al. [37]. Each biological replication was
analysed in two separate wells (technical replication). The average values from the two replications were used for each biological replication. Calculations of the relative fold change were conducted using the method of 22DDCT. Transcripts with Ct values .40 cycles were regarded as having no expression value.
Validation of SNP-EGs by re-sequencing
Three genes with SNPs, Ta#S37789723, Ta#S52545282, andTa#S58887817, were randomly selected for validation by re-sequencing. Primers were designed based on alignments between wheat UniGene and sequences of T. urartu and Ae. tauschii (Table S2). Genomic DNA from the isolines ‘1R’ and ‘1S’ were extracted from 20-day old seedlings using the hexadecyltrimethy-lammonium bromide (CTAB) method [38]. PCR amplification and sequencing were conducted based on the methods described by Ma et al. [39] with annealing temperatures ranging from 62uC to 65uC depending on the primers (Table S2).
Results
Exploratory analysis of variance factors in gene expression patterns
A total of 152 Gb sequences were obtained from Family A and 77 Gb sequences from Family B. Prior to fitting models, some basic exploratory analysis was conducted looking at the variance components for both Family A and B based on sequence reads. All samples were consistent and no outliers were observed. For Family A, the largest proportion of the variance was driven by time point. Principal component analysis (PCA) demonstrated that the
Figure 3. Differentially expressed genes (DEGs) between the resistant and susceptible isolines in Family A followingFusarium
pseudograminearum(Fp) –infection (compared to those in the mock). (A) Overview of the number of DEGs. (B) Venn diagrams showing the
number of up- or (C) down-regulated genes in the resistant isoline compared with those in the susceptible isoline. DEGs were determined with the threshold of FDR #0.01 and the absolute value of log2FoldChange $1 or #21 or ‘inf’ (the value of one comparative object is zero and the other one is not). Symbols are ‘M’ for mock; ‘I’ for Fp-infection; ‘R’ for resistant isoline; and ‘S’ for susceptible isoline.
doi:10.1371/journal.pone.0113309.g003
samples may be separated by the first two components according to the time point and the genotype (Figs. S1A and S1B). The hierarchical clustering (Fig. S1C) was consistent with the PCA. For Family B, the experimental run effect was quite strong. However, a large proportion of the variance still contributed to the genotypic effect (data not shown).
Distribution of DEGs and SNPs in the wheat genome
For increased genome coverage, the exploratory analysis on distribution of the detected DEGs and SNP-EGs in the wheat genome was conducted using the CSS contigs. This analysis detected 2,020 DEGs between the two isolines of Family A. Chromosome 3B had significantly more DEGs compared with other chromosomes families (Fig. 2A) and that a large proportion of those mapped on chromosome 3B was concentrated on the distal end where the targeted QTL resides (Fig. 2B).
Based on the use of the CSS contigs, 955 SNPs were detected between the ‘R’ and ‘S’ isolines of Family A and chromosome 3B had significantly more SNPs compared with other chromosomes (Fig. 2C) and that a large proportion of those on chromosome 3B co-located with the targeted QTL at the distal end of this chromosome arm (Fig. 2D).
Genes induced by Fusarium infection
Only data from Family A were suitable for this analysis as ‘mock’ controls were not used in assessing the NILs of Family B. Following Fp-inoculation, the numbers of up-regulated genes detected from the ‘R’ lines were 160 at 3 dpi and 1,165 at 5 dpi; and from the ‘S’ lines were 133 and 970, respectively, at the two different time points. The numbers of down-regulated genes detected at the two different time points followingFp-inoculation were 3 and 114, respectively, from the ‘R’ line, and 8 and 190, respectively, from the ‘S’ line (Fig. 3A).
In total, 1,809 induced genes (1,517 up- and 292 down-regulated) were detected between the two isolines following Fp-infection (Fig. 3B and 3C). Of them, 638 were up-regulated and 22 down-regulated in both isolines (Table S3). The 638 up-regulated genes contain 46 encoding pathogenesis-related pro-teins, 42 encoding receptor-like kinases, 21 encoding cytochrome P450 s, 17 encoding glutathione transferases, and 10 encoding detoxifying-related proteins (Fig. 4A). They also contain genes encoding proteins involved in host-pathogen interactions: 14 for disease resistance-related proteins, 6 for cell wall-related proteins, 4 for WIR1 (wheat induced resistance 1) proteins, 7 for WRKY transcription factors, 3 for ascorbate peroxidises, 6 for phenylal-anine ammonia lyases, and 14 for germin and germin-like proteins (Fig. 4A). They also contain genes for the biosynthesis of plant
Figure 4. Heat maps showing up- (A) or down - regulated genes (B) belonging to various classes in Family A detected between
pseudograminearuminfection (Fp-infection) and water treatment (mocks) at 3 dpi and 5 dpi, respectively. Up- or down-regulated genes
were determined with the threshold of FDR#0.01 and the absolute value of log2FoldChange $1 or #21 or ‘inf’ (the value of one comparative object is zero and the other one is not). Symbols are ‘M’ for mock; ‘I’ for Fp-infection; ‘3’ for 3 dpi; ‘5’ for 5 dpi; ‘R’ for resistant isoline; ‘S’ for susceptible isoline. The color key represents the RPKM normalized value. Lighter color indicates greater transcript accumulation. Each column represents a sample and each row a gene.
hormones which are known to be involved in wheat-Fusarium interactions: jasmonic acid (JA), ethylene (ET) and salicylic acid (SA) (Fig. 4A). Three of the 22 down-regulated genes seem to be highly relevant to disease resistance as they encode disease resistance protein RGA1, an EF-hand calcium binding protein, and a senescence-associated protein (Fig. 4B). Fifty-two of the up-regulated genes and three of the down-up-regulated ones co-located with the targeted QTL interval (Table S3), and five of them were among those showing differences between the ‘R’ and ‘S’ lines (below).
Transcriptome differences between resistant and susceptible isolines
An important part of this investigation was to identify transcripts that are differentially expressed between the ‘R’ isoline and the ‘S ‘isoline to provide an indication of what molecular mechanisms may be associated with resistance. The numbers of DEGs from the ‘mock’ treatment in Family A were: 562 down-regulated and 305 up-down-regulated at 3 dpi and 1,122 down-down-regulated and 351 up-regulated at 5 dpi. The numbers of DEGs detected from the Fp treatment between the NILs were: 641 regulated and 143 up-regulated at 3 dpi; and 1,028 down-regulated and 273 up-down-regulated at 5 dpi (Fig. 5). The DEGs
obtained between the two treatments at the two time points assessed between the two isolines represent a total of 691 (156 up-and 535 down-regulated in the ‘R’ isoline) unique transcripts (Fig. 5 and Table S4).
Of these 691 genes differentially expressed between the ‘R’ and ‘S’ lines, 88 (12.7%) were derived from chromosome 3B. Twenty-two (10 up- and 12 down-regulated) of them on chromosome 3B were mapped in theQcrs-3B interval (Table S5). Functions for 6 of the 10 up-regulated genes and 7 of the down-regulated genes are known (Table S5).
The 691 DEGs also contained 8 genes which were detected from the resistant isolines only and they were absent in the ‘S’ isoline of Family A assessed (Table 1). Biological functions are known for only one of these 8 genes. That isTa#S32500938, encoding the gibberellin 2-beta-dioxygenase 8-like. Two of the 8 DEGs (Ta#S12916732 and Ta#S32500938) were mapped in the Qcrs-3B interval with Ta#S32500938 being the only one annotated with known biological function.
Expressed genes containing SNPs (SNP-EGs) between the NILs
A total of 255 unique SNP-EGs between the NIL set ‘1R/1S’ of Family A were detected. Among them, 203 were detected from the
Figure 5. Genes responsive to Fusarium pseudograminearum(Fp) infection. (A) Numbers of genes exhibiting differential accumulation between Fp-infected and mock plants at either 3 dpi or 5 dpi. (B) Venn diagrams showing the number of up-regulated or (C) down-regulated genes. These genes were determined with the threshold of FDR#0.01 and the absolute value of log2FoldChange $1 or #21 or ‘inf’ (the value of one comparative object is zero and the other one is not). Symbols are ‘M’ for mock; ‘I’ for Fp-infection; ‘R’ for resistant isoline; ‘S’ for susceptible isoline. doi:10.1371/journal.pone.0113309.g005
Fp-infected samples, 116 from the mock samples, and 64 were detected from both of the samples (Fig. 6). Of these 255 unique SNP-EGs, 60 (or 23.5%) were mapped on chromosome 3B, and 28 genes with a total of 71 SNPs were mapped in theQcrs-3B interval (Table S6). Biological functions for 16 of these 28 genes are known (Table S6).
Of the 28 SNP-EGs mapped in the targeted QTL interval in the Family A, 18 (64.3%) were also detected among the four sets of NILs in Family B. These 18 SNP-EGs contain a total of 56 SNPs. Forty-one of these 56 SNPs (73.2%) were among those detected in Family A (Tables 2 and S6).
Validation of DEGs and SNP-EGs detected from the RNA sequence analysis
To verify the RNA-seq results obtained, RT-qPCR analysis was conducted against 4 genes that were randomly selected from the DEGs between the ‘R’ and ‘S’ isolines detected based on UniGene analysis. The expression patterns of these 4 genes assessed by RT-qPCR (Fig. S2) were consistent with those obtained from the RNA-seq analysis.
Three of the genes with a total of 10 SNPs identified between the resistant and susceptible isolines were also randomly selected for validation based on re-sequencing the NIL set ‘1R/1S’. All of the SNPs were identified correctly in the re-sequencing experiment (Fig. S3).
Discussion
RNA-seq analysis was conducted against five sets of NILs for a large-effect locus conferring FCR resistance on chromosome arm 3BL in wheat. Not unexpectedly, the numbers of detected SNP-EGs from these NILs on the targeted chromosome 3B were significantly higher compared with those on any other chromo-some and a large proportion of them were concentrated on the distal end of chromosome arm 3BL where the targetedQcrs-3B locus locates. Interestingly, this was also observed for DEGs between ‘R’ and ‘S’ isolines suggesting that there may be a regulation of proximally located genes by theQcrs-3B locus. The use of the multiple sets of NILs allowed the identification of better defined sets of candidate genes underlying the targeted locus. Functions of these genes provide insights into responses regulated by the 3BL locus and the 48 genes mapped in the targeted QTL interval are tractable in further efforts to functionally test gene(s) underlying this QTL for causal effects. These genes are being used as markers in fine mapping theQcrs-3B locus based on a NIL-derived population.
Candidate genes underlying the Qcrs-3B QTL for FCR resistance
Of the large numbers of DEGs and SNP-EGs detected in this study, targeting those located in the Qcrs-3B interval could be productive in further efforts of characterizing the FCR locus and cloning genes underlying the QTL. The 22 DEGs and the 28 SNP-EGs represent a total of 48 unique genes as two of the DEGs also contain SNPs (Fig. 1).
Five of the 22 DEGs mapped in the targeted QTL interval do not only differ between the ‘R’ and ‘S’ lines but were also induced by Fp-infection (Table S6). Several of these DEGs have been previously associated with host-pathogen interactions. They include those encoding the pathogenesis-related protein 4, the disease resistance response protein 206-like, and the disease resistance protein RPM1. One of the up-regulated genes mapped in theQcrs-3B interval encodes a homologue of resistance protein
Table 1. Genes expressed in the resistant isoline only a . Unigene name Annotation b Expression value c S M3R M3S M5R M5S I3R I3S I5R I5 Ta # S12916732 Unknown 0 3.3 0 3 .3 0 3.1 0 2.9 Ta # S58856178 Unknown 0 11.8 0 14.6 0 9.8 0 9.7 Ta # S58856166 Unknown 0 1 4 0 14.7 0 11.8 0 1 4.5 Ta # S58850454 Unknown 0 5.5 0 5 .5 0 4.8 0 4.4 Ta # S32500938 G ibberellin 2-beta-dioxygenase 8-like 0 2.4 0 1 .4 0 3.3 0 2.7 Ta # S16236095 Unknown 0 2.1 0 3 .5 0 3.2 0 2.8 Ta # S58857100 Unknown 0 4.6 0 6 .1 0 3.5 0 2.6 Ta # S58856177 Unknown 0 3.7 0 3 .2 0 3 0 4.7 aGenes w ere identified with the threshold o f F DR # 0.01. bAnnotations were performed using the software Blast2Go with BLASTX E-score of less than 10 2 10 . cRPKM normalized values are shown. The symbols are: ‘M’ for mock; ‘I’ for Fp -infection; ‘3’ for 3 dpi; ‘5’ for 5 dpi; ‘R’ for resistant isoline; ‘S’ for susceptible isoline. doi:10.1371/journal.pone. 0113309.t001
RGA2, which is known to confer broad spectrum resistance to potato late blight [40].
The 22 DEGs mapped in the targeted QTL interval also include two of those expressed in the resistant isolines only. Of these two genes, onlyTa#S32500938 was annotated with known
biological function. This gene encodes a gibberellin 2-beta-dioxygenase 8-like enzyme. It degrades active gibberellin and is involved in cold response [41]. Clearly, together with the other one gene expressed in the resistant isolines only and located in the
Figure 6. Venn diagrams showing the number of the expressed genes with SNPs between the resistant and susceptible isolines of Family A (1R/1 S). Symbols are ‘M’ for mock or water-treatment; ‘I’ for Fp-infection; ‘3’ for 3 dpi and ‘5’ for 5 dpi.
doi:10.1371/journal.pone.0113309.g006
Table 2. Validation of SNP-EGs and SNPs identified from Family A in Family B.
NILs SNP-EGs SNPs Novel SNPs
2R/2S 14 32 9 3R/3S 13 28 7 4R/4S 11 25 8 9R/9S 14 29 7 Unique 18 41 15 doi:10.1371/journal.pone.0113309.t002
targeted QTL interval (Ta#S12916732), possible roles of Ta#S32500938 in FCR resistance need to be clarified.
Of the 28 SNP-EGs located in the targeted interval, only two were significantly differentially expressed between the ‘R’ and ‘S’ isolines assessed. Considering that a difference in a gene sequence does not necessarily result in significantly changed expression but could affect the expression of down-stream genes [37], the gene(s) underlying theQcrs-3B could also be among the 18 non-DEGs located in the QTL interval. Out of these SNP-EGs, three encode MYB transcription factors which have been previously implicated in host-pathogen interactions [42]. Another one of the 28 SNP-EGs with known functions is particularly interesting as it encodes an NADH-quinone oxidoreductase subunit which is a well-known defence protein involved in detoxification reaction [43].
DEGs induced by FCR and FHB infections
There is a plethora of transcriptomic studies on FHB in recent years [15,44,45] and it is known that all Fusarium pathogens which cause FHB can cause FCR [1]. Considering the shared aetiology, pathogen biology and epidemiology between FHB and FCR [1], a comparison of host genes induced between these two diseases could be interesting.
As a transcriptomic analysis routinely detects hundreds of DEGs, it is not unexpected that such a comparison identified many genes which were induced by both FHB and FCR. Genes responsive to both diseases include those encoding some well-known defence proteins [e.g. pathogenesis-related (PR) proteins, receptor-like kinases (RLKs), glutathione-S-transferases, and cyto-chrome P450s] [20,21,32,46,47], those encoding responsive proteins during disease infection, those encoding xylanase inhibitors that can hinder the xylanase released by Fusarium pathogens from degrading the primary component of cell walls [48], and those of WRKY transcription factors which are known to function in biotic and abiotic stress responses [49]. The shared genes induced by these two diseases also include those encoding detoxifying-related proteins involved in detoxifying and transport-ing mycotoxins produced byFusarium species [50,51], and those encoding germ and germin-like proteins that are related to metabolism of reactive oxygen species (ROS) [52,53]. Such ROS as superoxide and hydrogen peroxide can induce programmed cell death (PCD) [54]. Another gene induced by both FCR and FHB was one of those encoding PCD-related proteins [12]. Similarly, two of the DEGs detected between the ‘R’ and ‘S’ lines of FCR in this study, Ta#S22386683 and Ta#S37823230, were among those detected between the NILs for a FHB locus [12].
When focused on the targeted QTL interval, however, overlap of genes detected between FHB and FCR was not obvious. For example, none of the DEGs located near theFhb1 locus using the deletion line [15] was among those located in theQcrs-3B region in this study. This is not difficult to comprehend in considering that different DEGs were not only detected between NILs for different loci of FHB [44,45] but also detected for the sameFhb1 locus between the use of NILs [44] and a deletion line [15].
Supporting Information
Figure S1 Principal component analysis (PCA) of RNA
sequences from Family A by time point (A), genotype (B)
and hierarchical clustering with Genotype6Treatment6 Timepoint (C). IDs for each database were listed in Table S1. (TIF)
Figure S2 RT-qPCR validation of 4 genes showing
differential expression between the resistant and sus-ceptible isolines of the NIL set ‘1R/1S’. The columns represented the average expression ratios calculated from all three biological replications. ForTA#S58850454, no expression was detected in the susceptible isoline. The values were presented as the averages of 2‘(Ct
TA#S58850454-Ctreference gene). Error bar shows
standard deviation. Symbols are ‘M’ for mock; ‘I’ forFp-infection, ‘3’ for 3 dpi and ‘5’ for 5 dpi.
(TIF)
Figure S3 Multiple alignments of Ta#S37789723 (A),
Ta#S52545282 (B) and Ta#S58887817 (C) with sequenc-es from the rsequenc-esistant and susceptible isolinsequenc-es. The SNPs in the red box were validated. Those in black box were identified by re-sequencing.
(TIF)
Table S1 Sample summary of the first set of the near
isogenic lines (Family A). (XLSX)
Table S2 Primers used for real-time qualitative PCR
analysis and for the validation of single nucleotide polymorphism detected from the RNA sequence analy-sis.
(XLSX)
Table S3 Transcripts that exhibited differential
accu-mulation in both the resistant and the susceptible isolines following Fusarium pseudograminearum (Fp) treatment compared to those in the mock at 3 dpi and 5 dpi.
(XLSX)
Table S4 Differential expressed genes (DEGs) in the
resistant isoline compared with the susceptible isoline of Family A following Fusarium pseudograminearum (Fp) or water (mock) treatment at 3 dpi or 5 dpi. (XLSX)
Table S5 Differentially expressed genes (DEGs)
be-tween the resistant and susceptible isolines that mapped in theQcrs-3B interval.
(XLSX)
Table S6 Genes with homozygous SNPs between the
resistant and susceptible isolines mapped in theQcrs-3B interval.
(XLSX)
Author Contributions
Conceived and designed the experiments: JMM CL BH GY Y-LZ YW. Performed the experiments: JM JS QZ QF CC PW DG. Analyzed the data: JM JS QZ QF CC PW CL. Contributed reagents/materials/analysis tools: FC CF. Contributed to the writing of the manuscript: JM JS PW DG JMM CL.
References
1. Chakraborty S, Liu C, Mitter V, Scott J, Akinsanmi O, et al. (2006) Pathogen population structure and epidemiology are keys to wheat crown rot and Fusarium head blight management. Australasian Plant Pathology 35: 643–655. 2. Goswami RS, Kistler HC (2004) Heading for disaster: Fusarium graminearum
on cereal crops. Molecular Plant Pathology 5: 515–525.
3. Buerstmayr H, Ban T, Anderson JA (2009) QTL mapping and marker-assisted selection for Fusarium head blight resistance in wheat: a review. Plant breeding 128: 1–26.
4. Mudge AM, Dill-Macky R, Dong Y, Gardiner DM, White RG, et al. (2006) A role for the mycotoxin deoxynivalenol in stem colonisation during crown rot
disease of wheat caused byFusarium graminearum and Fusarium pseudogra-minearum. Physiological and Molecular Plant Pathology 69: 73–85. 5. Dubin HJ (1997) Fusarium Head Scab: Global Status and Future Prospects: In:
Dubin HJ, Gilchrist L, Reeves J, McNab A (eds) CIMMYT, Mexico, DF. 6. Lu W, Cheng S, Wang Y (2001) Wheat scab research in China. Scientific
Publication Ltd, Beijing.
7. Lemmens M, Scholz U, Berthiller F, Dall’Asta C, Koutnik A, et al. (2005) The ability to detoxify the mycotoxin deoxynivalenol colocalizes with a major quantitative trait locus for Fusarium head blight resistance in wheat. Molecular Plant-Microbe Interactions 18: 1318–1324.
8. Li HB, Xie GQ, Ma J, Liu GR, Wen SM, et al. (2010) Genetic relationships between resistances to Fusarium head blight and crown rot in bread wheat (Triticum aestivum L.). Theoretical and applied genetics 121: 941–950. 9. Liu S, Pumphrey MO, Gill BS, Trick HN, Zhang JX, et al. (2008) Toward
positional cloning of Fhb1, a major QTL for Fusarium head blight resistance in wheat. Cereal Research Communications 36: 195–201.
10. Cho S-H, Lee J, Jung K-H, Lee Y-W, Park J-C, et al. (2012) Genome-wide analysis of genes induced by Fusarium graminearum infection in resistant and susceptible wheat cultivars. Journal of Plant Biology 55: 64–72.
11. Gottwald S, Samans B, Lu¨ck S, Friedt W (2012) Jasmonate and ethylene dependent defence gene expression and suppression of fungal virulence factors: two essential mechanisms of Fusarium head blight resistance in wheat? BMC genomics 13: 369.
12. Jia H, Cho S, Muehlbauer GJ (2009) Transcriptome analysis of a wheat near-isogenic line pair carrying Fusarium head blight-resistant and-susceptible alleles. Molecular plant-microbe interactions 22: 1366–1378.
13. Li G, Yen Y (2008) Jasmonate and ethylene signaling pathway may mediate Fusarium head blight resistance in wheat. Crop Science 48: 1888–1896. 14. Blume B, Nu¨rnberger T, Nass N, Scheel D (2000) Receptor-mediated increase
in cytoplasmic free calcium required for activation of pathogen defense in parsley. The Plant Cell Online 12: 1425–1440.
15. Xiao J, Jin X, Jia X, Wang H, Cao A, et al. (2013) Transcriptome-based discovery of pathways and genes related to resistance againstFusarium head blight in wheat landrace Wangshuibai. BMC genomics 14: 197.
16. Anand A, Zhou T, Trick HN, Gill BS, Bockus WW, et al. (2003) Greenhouse and field testing of transgenic wheat plants stably expressing genes for thaumatin-like protein, chitinase and glucanase againstFusarium graminearum. Journal of Experimental Botany 54: 1101–1111.
17. Li W, Faris J, Muthukrishnan S, Liu D, Chen P, et al. (2001) Isolation and characterization of novel cDNA clones of acidic chitinases and b-1, 3-glucanases from wheat spikes infected by Fusarium graminearum. Theoretical and Applied Genetics 102: 353–362.
18. Mackintosh CA, Lewis J, Radmer LE, Shin S, Heinen SJ, et al. (2007) Overexpression of defense response genes in transgenic wheat enhances resistance to Fusarium head blight. Plant cell reports 26: 479–488.
19. Zhu X, Li Z, Xu H, Zhou M, Du L, et al. (2012) Overexpression of wheat lipid transfer protein gene TaLTP5 increases resistances to Cochliobolus sativus and Fusarium graminearum in transgenic wheat. Functional & integrative genomics 12: 481–488.
20. Desmond OJ, Edgar CI, Manners JM, Maclean DJ, Schenk PM, et al. (2006) Methyl jasmonate induced gene expression in wheat delays symptom development by the crown rot pathogen Fusarium pseudograminearum. Physiological and Molecular Plant Pathology 67: 171–179.
21. Desmond OJ, Manners JM, Schenk PM, Maclean DJ, Kazan K (2008) Gene expression analysis of the wheat response to infection byFusarium pseudo-graminearum. Physiological and Molecular Plant Pathology 73: 40–47. 22. Bovill WD, Ma W, Ritter K, Collard B, Davis M, et al. (2006) Identification of
novel QTL for resistance to crown rot in the doubled haploid wheat population ‘W21MMT70’6‘Mendos’. Plant Breeding 125: 538–543.
23. Collard B, Grams R, Bovill WD, Percy C, Jolley R, et al. (2005) Development of molecular markers for crown rot resistance in wheat: mapping of QTLs for seedling resistance in a ‘2–49’6‘Janz’population. Plant Breeding 124: 532–537. 24. Ma J, Li H, Zhang C, Yang X, Liu Y, et al. (2010) Identification and validation of a major QTL conferring crown rot resistance in hexaploid wheat. Theoretical and applied genetics 120: 1119–1128.
25. Wallwork H, Butt M, Cheong J, Williams K (2004) Resistance to crown rot in wheat identified through an improved method for screening adult plants. Australasian Plant Pathology 33: 1–7.
26. Zheng Z, Kilian A, Yan G, Liu CJ (2014) QTL Conferring Fusarium Crown Rot Resistance in the Elite Bread Wheat Variety EGA Wylie. PloS one 9: e96011.
27. Ma J, Yan G, Liu C (2012) Development of near-isogenic lines for a major QTL on 3BL conferring Fusarium crown rot resistance in hexaploid wheat. Euphytica 183: 147–152.
28. Wang Z, Gerstein M, Snyder M (2009) RNA-Seq: a revolutionary tool for transcriptomics. Nature Reviews Genetics 10: 57–63.
29. Cavanagh CR, Chao S, Wang S, Huang BE, Stephen S, et al. (2013) Genome-wide comparative diversity uncovers multiple targets of selection for
improve-ment in hexaploid wheat landraces and cultivars. Proc Natl Acad Sci USA 110: 8057–8062.
30. Choulet F, Alberti A, Theil S, Glover N, Barbe V, et al. (2014) Structural and functional partitioning of bread wheat chromosome 3B. Science 345: 1249721. 31. Akinsanmi O, Mitter V, Simpfendorfer S, Backhouse D, Chakraborty S (2004) Identity and pathogenicity of Fusarium spp. isolated from wheat fields in Queensland and northern New South Wales. Crop Pasture Sci 55: 97–107. 32. Li X, Zhang J, Song B, Li H, Xu H, et al. (2010) Resistance to Fusarium head
blight and seedling blight in wheat is associated with activation of a cytochrome P450 gene. Phytopathology 100: 183–191.
33. Yang X, Ma J, Li H, Ma H, Yao J, et al. (2010) Different genes can be responsible for crown rot resistance at different developmental stages of wheat and barley. European journal of plant pathology 128: 495–502.
34. Jia J, Zhao S, Kong X, Li Y, Zhao G, et al. (2013)Aegilops tauschii draft genome sequence reveals a gene repertoire for wheat adaptation. Nature 496: 91–95. 35. Ling H-Q, Zhao S, Liu D, Wang J, Sun H, et al. (2013) Draft genome of the
wheat A-genome progenitorTriticum urartu. Nature 496: 87–90.
36. Long XY, Wang JR, Ouellet T, Rocheleau H, Wei YM, et al. (2010) Genome-wide identification and evaluation of novel internal control genes for Q-PCR based transcript normalization in wheat. Plant molecular biology 74: 307–311. 37. Ma J, Jiang QT, Zhao QZ, Zhao S, Lan XJ, et al. (2013) Characterization and expression analysis of waxy alleles in barley accessions. Genetica 141: 227–238. 38. Murray M, Thompson WF (1980) Rapid isolation of high molecular weight
plant DNA. Nucleic acids research 8: 4321–4326.
39. Ma J, Jiang Q-T, Zhang X-W, Lan X-J, Pu Z-E, et al. (2013) Structure and expression of barley starch phosphorylase genes. Planta 238: 1081–1093. 40. Song J, Bradeen JM, Naess SK, Raasch JA, Wielgus SM, et al. (2003) Gene RB
cloned from Solanum bulbocastanum confers broad spectrum resistance to potato late blight. Proc Natl Acad Sci USA 100: 9128–9133.
41. Thomas SG, Phillips AL, Hedden P (1999) Molecular cloning and functional expression of gibberellin 2-oxidases, multifunctional enzymes involved in gibberellin deactivation. Proc Natl Acad Sci USA 96: 4698–4703.
42. Liu Y, Schiff M, Dinesh-Kumar S (2004) Involvement of MEK1 MAPKK, NTF6 MAPK, WRKY/MYB transcription factors, COI1 and CTR1 in N-mediated resistance to tobacco mosaic virus. The Plant Journal 38: 800–809. 43. Ross D, Kepa JK, Winski SL, Beall HD, Anwar A, et al. (2000) NAD (P) H:
quinone oxidoreductase 1 (NQO1): chemoprotection, bioactivation, gene regulation and genetic polymorphisms. Chemico-biological interactions 129: 77–97.
44. Schweiger W, Steiner B, Ametz C, Siegwart G, Wiesenberger G, et al. (2013) Transcriptomic characterization of two majorFusarium resistance quantitative trait loci (QTLs),Fhb1 and Qfhs. ifa-5A, identifies novel candidate genes. Molecular plant pathology 14: 772–785.
45. Kugler KG, Siegwart G, Nussbaumer T, Ametz C, Spannagl M, et al. (2013) Quantitative trait loci-dependent analysis of a gene co-expression network associated with Fusarium head blight resistance in bread wheat (Triticum aestivum L.). BMC genomics 14: 728.
46. Mauch F, Dudler R (1993) Differential induction of distinct glutathione-S-transferases of wheat by xenobiotics and by pathogen attack. Plant Physiology 102: 1193–1201.
47. Song W-Y, Wang G-L, Chen L-L, Kim H-S, Pi L-Y, et al. (1995) A receptor kinase-like protein encoded by the rice disease resistance gene, Xa21. Science 270: 1804–1806.
48. Carpita NC, Gibeaut DM (1993) Structural models of primary cell walls in flowering plants: consistency of molecular structure with the physical properties of the walls during growth. The Plant Journal 3: 1–30.
49. Rushton PJ, Somssich IE, Ringler P, Shen QJ (2010) WRKY transcription factors. Trends in plant science 15: 247–258.
50. Poppenberger B, Berthiller F, Lucyshyn D, Sieberer T, Schuhmacher R, et al. (2003) Detoxification of the Fusarium mycotoxin deoxynivalenol by a UDP-glucosyltransferase fromArabidopsis thaliana. Journal of Biological Chemistry 278: 47905–47914.
51. Muhitch MJ, McCormick SP, Alexander NJ, Hohn TM (2000) Transgenic expression of the TRI 101 or PDR 5 gene increases resistance of tobacco to the phytotoxic effects of the trichothecene 4, 15-diacetoxyscirpenol. Plant Science 157: 201–207.
52. Hancock JT, Desikan R, Clarke A, Hurst RD, Neill SJ (2002) Cell signalling following plant/pathogen interactions involves the generation of reactive oxygen and reactive nitrogen species. Plant Physiology and Biochemistry 40: 611–617. 53. Dunwell JM, Gibbings JG, Mahmood T, Saqlan Naqvi S (2008) Germin and germin-like proteins: evolution, structure, and function. Critical Reviews in Plant Sciences 27: 342–375.
54. Desmond OJ, Manners JM, Stephens AE, Maclean DJ, Schenk PM, et al. (2008) The Fusarium mycotoxin deoxynivalenol elicits hydrogen peroxide production, programmed cell death and defence responses in wheat. Molecular Plant Pathology 9: 435–445.