HAL Id: hal-02460008
https://hal.archives-ouvertes.fr/hal-02460008
Submitted on 19 Nov 2020
HAL is a multi-disciplinary open access
archive for the deposit and dissemination of
sci-entific research documents, whether they are
pub-lished or not. The documents may come from
teaching and research institutions in France or
abroad, or from public or private research centers.
L’archive ouverte pluridisciplinaire HAL, est
destinée au dépôt et à la diffusion de documents
scientifiques de niveau recherche, publiés ou non,
émanant des établissements d’enseignement et de
recherche français ou étrangers, des laboratoires
publics ou privés.
insight into soil exploration and seed quality
Barbara Hufnagel, André Marques, Alexandre Soriano, Laurence Marquès,
Fanchon Divol, Patrick Doumas, Erika Sallet, Davide Mancinotti, Sébastien
Carrere, William Marande, et al.
To cite this version:
Barbara Hufnagel, André Marques, Alexandre Soriano, Laurence Marquès, Fanchon Divol, et al..
High-quality genome sequence of white lupin provides insight into soil exploration and seed quality.
Nature Communications, Nature Publishing Group, 2020, 11 (1), pp.492.
�10.1038/s41467-019-14197-9�. �hal-02460008�
High-quality genome sequence of white
lupin provides insight into soil exploration
and seed quality
Bárbara Hufnagel
1
, André Marques
1,13
, Alexandre Soriano
1
, Laurence Marquès
1
, Fanchon Divol
1
,
Patrick Doumas
1
, Erika Sallet
2
, Davide Mancinotti
3
, Sébastien Carrere
2
, William Marande
4
,
Sandrine Arribat
4
, Jean Keller
5
, Cécile Huneau
6
, Thomas Blein
7
, Delphine Aimé
8
, Malika Laguerre
1
,
Jemma Taylor
9
, Veit Schubert
10
, Matthew Nelson
9,11
, Fernando Geu-Flores
3
, Martin Crespi
7
, Karine Gallardo
8
,
Pierre-Marc Delaux
5
, Jérôme Salse
6
, Hélène Bergès
4
, Romain Guyot
12
, Jérôme Gouzy
2
&
Benjamin Péret
1
*
White lupin (Lupinus albus L.) is an annual crop cultivated for its protein-rich seeds. It is
adapted to poor soils due to the production of cluster roots, which are made of dozens of
determinate lateral roots that drastically improve soil exploration and nutrient acquisition
(mostly phosphate). Using long-read sequencing technologies, we provide a high-quality
genome sequence of a cultivated accession of white lupin (2n
= 50, 451 Mb), as well as de
novo assemblies of a landrace and a wild relative. We describe a modern accession displaying
increased soil exploration capacity through early establishment of lateral and cluster roots.
We also show how seed quality may have been impacted by domestication in term of protein
profiles and alkaloid content. The availability of a high-quality genome assembly together
with companion genomic and transcriptomic resources will enable the development of
modern breeding strategies to increase and stabilize white lupin yield.
https://doi.org/10.1038/s41467-019-14197-9
OPEN
1BPMP, Univ Montpellier, CNRS, INRAE, SupAgro, Montpellier, France.2LIPM, Université de Toulouse, INRAE, CNRS, Castanet-Tolosan, France.3University
of Copenhagen, Frederiksberg C, Denmark.4CNRGV, INRAE, Toulouse, France.5Laboratoire de Recherche en Sciences Végétales (LRSV), Université de Toulouse, CNRS, Castanet Tolosan, France.6INRAE GDEC, Clermont-Ferrand, France.7Institute of Plant Sciences Paris-Saclay, Gif-sur-Yvette, France. 8INRAE Agroécologie, Dijon, France.9Royal Botanic Gardens, Kew, UK.10IPK, Gatersleben, Germany.11CSIRO, Perth, Australia.12IRD, Montpellier, France
INRAE / 13 Department of Electronics and Automatization, Universidad Autónoma de Manizales, Manizales, Colombia.13Present address: MPIPZ,
Cologne, Germany. *email:benjamin.peret@supagro.fr
123456789
L
upins are commonly known as beautiful ornamental plants,
bearing numerous colorful
flowers. These plants belong to
the Lupinus genus that is richly diverse with more than
300 species
1,2. They are grouped into Old World lupins
(Medi-terranean) and New World lupins (American) and display a
remarkable array of ecological habitats, justifying their interest as
a case study for genome evolution, adaptation and speciation
2,3.
Among them, white lupin (Lupinus albus L.) is a pulse that
ori-ginates from the Mediterranean region, its center of origin is
believed to be Greece, Western Turkey and southern Balkans
where wild
‘graecus’ types still persist
4. This crop is recognized as
a traditional food due to its very high protein content (between 30
and 40% of the whole seed)
5.
Cultivation of white lupin (WL) started around 4000 years ago
but modern breeding efforts have been very limited and focused
on a few major traits such as permeable seeds, early
flowering,
non-shattering pods, and low alkaloid seed content
6. WL
culti-vation has the potential to solve several issues related to the future
of European protein supply due to its high quality seeds (very
high levels of proteins, high levels of tocopherols, lowest glycemic
index of consumed grains, high dietary
fiber content, gluten-free,
low oil, and minimal starch)
5,7–9. It is also a crop with low need
for phosphate fertilizers due to its highly adapted root system
10and no need of nitrogen input as a legume.
White Lupin is one of the few crops that can produce
spec-tacular structures called cluster roots, harboring a specific
phy-siology dedicated towards efficient Pi acquisition
11. Despite being
an essential micronutrient, inorganic phosphate is poorly
avail-able in the soil and plants have developed various strategies to
improve Pi remobilization and acquisition
12,13. Most terrestrial
plants form mycorrhizal symbiosis to improve soil exploration
but WL has lost the ability to form such associations. Instead, by
producing cluster roots, WL can take up almost 5 times more Pi
per root length unit than soybean, a mycorrhizal legume that does
not form cluster roots
14, suggesting a strong potential for crop
improvement towards better nutrient acquisition efficiency
11.
In this study, we present a high-quality genome sequence of a
modern accession of white lupin (2n
= 50, 451 Mb), as well as de
novo assemblies of a landrace and a wild accession. This quality
reference sequence allows us to perform in-depth analysis of
repetitive elements, to analyze genomic variations across 15
accessions, and to retrace the paleohistory of legumes. We then
provide a comparison of soil exploration capacity between a
cultivated and a wild accession, highlighting the early
establish-ment of lateral and cluster roots in the modern cultivar. We also
provide information regarding seed quality, demonstrating that
modern accessions accumulate specific types of conglutins.
Finally, we provide a list of candidate genes present in the pauper
locus, which is a common QTL controlling the accumulation of
toxic alkaloids in WL seeds.
Results
Genome assembly and annotation. We generated 164x
sequencing coverage of the genome of Lupinus albus cv. AMIGA
using 30 single-molecule real-time (SMRT) cells on PacBio Sequel
platform. The production of 94 Gb of very long reads along with a
depth of 208× (119 Gb) of Illumina 150 bp paired-end sequences
for the assembly polishing and with the addition of Bionano
optical map technology allowed a genome assembly of 451 Mb.
The contig sequences obtained by a meta assembly strategy based
on CANU
15and FALCON
16were scaffolded in a
first step using a
Bionano optical map and in a second step using a high density
genetic map
17. The chromosome-level assembly (termed Lalb,
Table
1
, Supplementary Fig. 1) covers the 25 nuclear
chromo-somes along with mitochondrial and chloroplastic genomes,
leaving only 64 unanchored contigs (8.8 Mb - 2% of the
assem-bly). The maximum number of sequence gaps is four (on
chro-mosomes 10 and 11) and ten chrochro-mosomes contain only a single
sequence gap, illustrating the high and homogenous contiguity
across chromosomes (Supplementary Note 1, Supplementary
Data 1, Supplementary Tables 1–3).
We generated RNA-seq data from ten different organs, widely
covering gene expression in WL (entire root system in
+Pi and
–Pi conditions, lateral roots, primary roots, cluster roots,
nodulated root system, leaves,
flowers, pods, and seeds). The
assembled reads were mapped using EuGene-EP pipeline
18and
protein and non-protein coding gene models were predicted.
Three protein databases (Swiss-Prot, a plant subset of Uniprot
proteins and the proteome of Medicago truncatula) were aligned
to contribute to translated regions detection. Genome annotation
identified 38,258 protein-coding genes and 3129
non-protein-coding genes (Table
1
and Supplementary Note 2). Evidence of
transcription was found for 92% of the annotated genes. Quality
of the annotation was evaluated with a Benchmarking of
Universal Single-Copy Orthologs (BUSCO
19) analysis, yielding
a completeness score of 97.7%. The WL Genome portal (
www.
whitelupin.fr
) provides a genome browser and several other
user-friendly tools for molecular analysis.
Repetitive elements and structure of centromeric regions. De
novo identification of repeated elements revealed a highly
repe-titive genome (60%), with over 75% repeats matching known
transposable elements (TEs, Fig.
1
a, Supplementary Note 3,
Supplementary Tables 4). Chromosomal scale genome-wide
annotation of repetitive sequences revealed the in silico
annota-tion of the main classes of repeats (Fig.
1
b). TEs were most
commonly long terminal repeats (LTRs) retrotransposons (34%),
with remarkable accumulation of Ty3/gypsy Tekay, CRM
chro-moviruses and Ty1/copia SIRE towards the central regions of
chromosome assemblies along presumed (peri)centromeric
regions (Fig.
1
b). Class II TEs accounted for ca. 0.8% of the
genome (Supplementary Note 3) and is in accordance to the
lower abundance of this class of repeats in other legume
species
20,21. A high amount of satellite DNA (satDNA) sequences
was found, comprising ~15% of the genome (Supplementary
Note 3, Supplementary Table 5). A narrow peak for the
dis-tribution of CRM (Centromeric Retrotransposon of Maize) clade
retroelements was observed in all assembled chromosomes, we
therefore presumed that the observed peak defines the
cen-tromeric regions of WL chromosomes. Thus, we refer to this
element as CRWL for Centromeric Retrotransposon of While
Lupin. Remarkably, a high association of CRWL and satellite
DNA peaks was observed, suggesting a more specific distribution
Table 1 Statistics of the white lupin genome and gene
models prediction.
Number Size Assembly feature Assembled sequences 89 450.972 Mb N50 12 17.35 Mb N90 23 14.55 Mb GC content (%) 33.71 Genome annotation TE proportion (%) 60 Annotated protein-coding genes 38258 Annotated non-protein coding genes 3129 Complete BUSCOs 1331 (97.7%) Fragmented BUSCOs 3 (0.2%) Missing BUSCOs 29 (2.1%)of these repeats compared to other TEs (Fig.
1
b, c) whereas a
more diverse distribution of repetitive elements towards the
peri-centromeric regions of WL chromosomes was observed
(Sup-plementary Fig. 2). To further characterize the repeat portion of
WL genome we performed in situ hybridization of the most
abundant repeat clusters identified by the RepeatExplorer analysis
(Fig.
1
c). As expected, CRWL FISH signals were observed as
narrow distributed signals at the centromeric regions of most WL
chromosomes (Fig.
1
c, Supplementary Fig. 2), giving an
indica-tion of funcindica-tional centromeres posiindica-tioning.
Raising an anti-LalbCENH3 specific antibody, we mapped
functional centromeres using immunostaining (Supplementary
Fig. 3) and performed LalbCENH3-ChIPseq confirming the
association of CRWL main clusters (Fig.
1
d) with functional
centromeres. Analysis of ChIPseq reads demonstrated that
CRWL elements (CL13, CL20, CL34, CL48, and CL49) are
among the clusters that showed the highest levels of association
in the immunoprecipitated fraction (Fig.
1
d). Although CRWL
is highly abundant on centromeric regions of WL chromosomes
(Fig.
1
b, c), detailed analysis of ChIPseq data revealed that
CENH3-containing chromatin is also associated with at least
four families of centromeric tandem repeats: CL2-5bp,
CL10-78bp, CL21-38bp and CL55-8bp (Fig.
1
c, d). Super-resolution
microscopy of pachytene and somatic chromosomes confirmed
a centromere-specific localization for CRWL, CL2, CL10, CL21,
and CL55 repeats, while CL1 repeat localizes aside core
centromeres (Fig.
1
c, Supplementary Fig. 2 arrowheads). The
total amount of cenDNA represents about 11% (49.55 Mb) of
the genome. In contrast, the most abundant satDNA
CL1-170bp did not show significant enrichment with the
immuno-precipitated DNA, suggesting that this element is excluded
from functional centromeres. A typical (peri)centromeric
region of a WL chromosome contains the most abundant
CL1-170bp repeats representing 18% of the region. These
sequences are organized in blocks separated by SIRE
retro-transposons. Centromere-associated satellite repeats are present
in shorter arrays such as CL2-5bp and CL10-78bp intermingled
with CRWL elements (Fig.
1
e, Supplementary Fig. 3,
Supple-mentary Table 6). Thus, the functional centromeres of WL are
preferentially associated with CRWL and with different families
a
c
e
b
0 A B C D E 25 24 23 22 21 20 19 18 17 16 15 14 13 12 11 10 9 8 7 6 5 4 3 2 1 20 40 60 Single copyrDNA (2.4%) DNA transposons (0.6%) Other TEs (12%) LTR retroelements
Ty1/copia (9%) Tandem repeats (14.4%) LTR retroelements Ty3/gypsy (21.6%) Repeats % of the genome 5M 10M 10M 15M 15M 20M 5M 10M 15M 20M 5M 10M 15M 5M 10M 15M 5M 10M 15M 5M 10M 15M 5M 10M 15M 5M 10M 15M 5M 10M 15M 5M 10M 15M 5M
d
CRWL CL10 78bp CL55 8bp satDNA CL58 4bp degenerated CL21 38pb satDNA CL2 5pb satDNA 0.8 0.7 0.6 0.5 0.4 0.3 0 25 50 75 100 500,000 1,00,000 CL1 170bp CL10 78bp CL2 5bp 4.8 Mb 6.0 Mb 16 Mb 0 DEL/Tekay CRWL SIRE Satellite DNA 1 2 3 CL1 CL2 CL1 CL10 CRWL CRWL+CL2 CRWL+CL2+DAPI CL2 Normalized ratioChiP * (ChiP +Input)
–1 20M 10M 15M 5M 10M 10M 15M 5M 5M 10M 20M 5M 15M 10M 5M 10M 15M 5M 10M 15M 20M 5M 10M 15M 5M 10M 15M 5M 10M 15M 5M 10M 15M 5M 10M15M 5M 10M 5M 10M 15M 5M
Fig. 1 Repeated elements abundance in white lupin genome. a Proportion of single copy and repeated sequences for the different classes of repeats. b Density distribution along the chromosomes of the repetitive classes. A. genes, B. CRM, C. satDNA, D. Tekay, and E. SIRE. Density is represented in 0.5 Mb bins.c FISH mapping of the main repeats by super-resolution microscopy (3D-SIM). (1) Co-localization of CRWL and CL2 satDNA on centromeric regions of meiotic (pachytene) chromosomes. (2–3) Distribution of the most abundant satellite DNAs CL1, CL2, and CL10 in somatic metaphase chromosomes. Bars are 10µm (1) and 2 µm (2 and 3). d LalbCENH3-ChIPseq reads mapped against the first 100 RepeatExplorer clusters of the WL genome. The main centromeric sequences found in LalbCENH3-ChIPseq are highlighted.e Typical centromere composition of a WL chromosome, chromosome 14. Source data underlying Fig.1d are provided as a Source Datafile.
of tandem repeats in a chromosome-specific pattern. These
results identify a specific centromeric sequence pattern with a
highly diverse structure in WL that strongly differs from known
centromeric sequences.
White lupin diversity and genomic structural variations. To
provide a
first overview of WL diversity and possible
domes-tication patterns we re-sequenced 14 WL accessions, including 11
modern accessions, 1 landrace and 2 wild relatives
(Supplemen-tary Note 4, Supplemen(Supplemen-tary Tables 7 and 8). The accessions
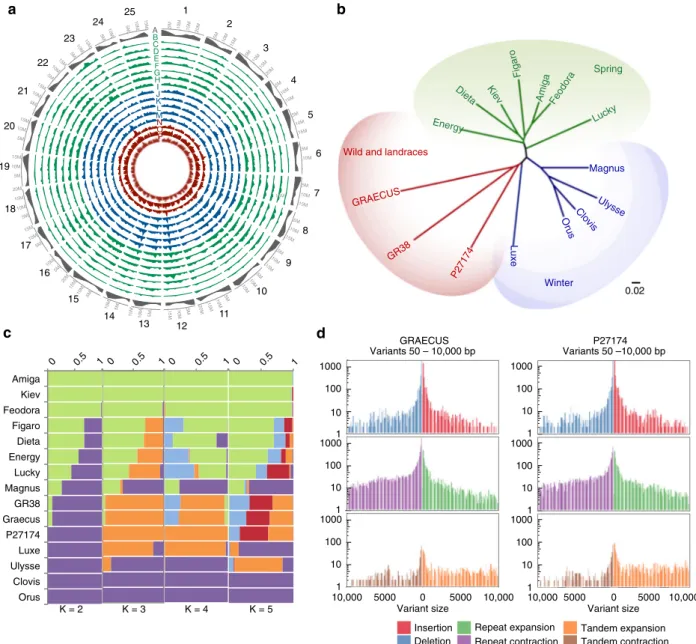
presented a total of 2,659,837 SNPs (Fig.
2
a, Supplementary
Table 9) when compared to the reference genome. Pairwise
dissimilarities analyses allowed the identification of three clusters
reflecting white lupin recent breeding history: winter accessions
(vernalization responsive, slow growth, cold adapted), spring
accessions (vernalization unresponsive, fast growth, strong vigor,
and reduced life-cycle) and landraces/wild types (Fig.
2
b,
Sup-plementary Data 2).
To further verify the clustering observed in the phylogenetic
tree, a principal component analysis (PCA) was conducted using
the same samples and SNP set. More than half of total genetic
variance (58.2%) could be explained by the two
first components,
which replicates the phylogenetic tree results (Supplementary
Fig. 4).
a
b
c
d
GRAECUS P27174 0 0.5 1 0 0.5 1 Amiga Kiev Feodora Figaro Dieta Energy Lucky Magnus GR38 Graecus P27174 Luxe Ulysse Clovis Orus 0 0.5 1 0 0.5 1 K = 2 K = 3 K = 4 K = 5 Variant size Repeat expansion Repeat contraction Insertion Deletion Tandem expansion Tandem contraction 1000 1000 1000 100 100 100 10 10 10 1 1 1 Variant size Variants 50 – 10,000 bp Variants 50 –10,000 bp Wild and landracesGRAECUS GR38 P27174 Spring Lucky Feodora Amiga Figaro Kiev Dieta Energy Winter Luxe OrusClovis Ulysse Magnus 0.02 1 2 3 4 5 6 7 8 9 10 11 12 13 14 15 16 17 18 19 20 21 22 23 24 25 5M 10M 15M 20M 5M 10M 15M 5M 10M 15M 20M 5M 10M 15M 5M 10M 15M 5M 10M 15M 5M 10M 15M 5M 10M 15M 5M 10M 15M 5M 10M 15M 5M 10M 15M 20M 5M 10M 15M 5M 10M 15M 5M 10M 5M 10M 15M 20M 5M 10M 5M 10M 15M 5M 10M 15M 20M 5M 10M 15M 5M 10M 15M 5M 10M 15M 5M 10M 15M 5M 10M 15M 5M 10M 5M 10M 15M A B C D E F G H I J K L M N O P 10,000 10,000 5000 0 5000 10,000 5000 0 5000 10,000 1000 100 10 1 1000 100 10 1 1000 100 10 1
Fig. 2 White Lupin diversity and evolution history. a SNP density identified by resequencing of 15 accessions of white lupin. In the outer track (A in gray) gene density is shown. Spring accessions are represented in green (B–H), winter accessions are represented in blue (I–M) and wild/landrace accessions are represented in red (N-P). From the outer to inner track: (B) AMIGA, (C) FEODORA, (D) KIEV, (E) DIETA, (F) FIGARO, (G) ENERGY, (H) LUCKY, (I) ORUS, (J) CLOVIS, (K) MAGNUS, (L) ULYSSE, (M) LUXE, (N) P27174, (O) GR38, AND (P) GRAECUS. The SNP density is represented in 1 Mb bins. b Neighbor-joining phylogenetic tree of white lupin accessions based on SNPs. The 15 accessions are divided in three clades: winter, spring and wild/ landrace.c Admixture representation of the 15 accessions with population clustering for K= 2–5. Each individual is represented by a horizontal bar and each color represents a subpopulation. The color of each individual accession represents their proportional membership in the different populations. d Structural variants (SVs) between L. albus cv. AMIGA and the de novo assembly of GRAECUS (left) and P27174 (right). The biggest proportion of variants are the repeated elements. SVs represent 18.08 Mb of the GRAECUS genome and 18.67 Mb of P27174 genome. Source data underlying Fig.2b are provided as a Source Datafile.
The population structure was explored with the same set of
SNPs using STRUCTURE
22. We tested for a population structure
ranging from 2 subpopulations (K
= 2) up to 5 subpopulations
(K
= 5, Fig.
2
c). Additionally, a Evanno’s test
23indicated that
these 15 WL accessions might be divided into two
subpopula-tions, one formed by the spring accessions and the other with the
winter and non-domesticated accessions (Supplementary Fig. 5).
We estimated the level of linkage disequilibrium (LD) using the
r
2parameter between all pairwise SNP comparisons by using
these 15 accessions in the 25 chromosomes (Supplementary
Fig. 6). We used a subset of 46,783 high-quality genomic-random
distributed SNPs. LD decay distance showed apparent variation,
indicating that selection pressure in different chromosomal
regions varied, probably due to different selection goals in
breeding.
We selected the wild accession GRAECUS and an Ethiopian
landrace (P27174) to further investigate the possible impact of
domestication on WL genome. We sequenced these two
genotypes using Nanopore long-read technology, at a depth of
27.6x and 32.4x for GRAECUS and P27174, respectively, and
generated de novo assemblies (Supplementary Table 10). Using
Assemblytics
24(based on whole genomes alignments generated
with MUMmer
25), we identified a high level of structural
variations (SVs, Fig.
2
d, Supplementary Data 3). This analysis
reveals genomic regions that are strongly altered between the
modern accession AMIGA and the two accessions that have not
undergone a breeding program. P27174 assembly has a total
length of 18.67 Mb of structural variations (SVs) affected and the
GRAECUS accession was similarly affected by SVs (18.08 MB
–
Fig.
2
d, Supplementary Data 3).
The majority of the SVs in both GRAECUS and P27174 are
located in intergenic regions (62 and 53%, respectively).
Considering a promoter region of 2 Kb upstream of 5′-UTR, a
total of 8166 genes are impacted by SVs in the GRAECUS
genome, whereas only 6524 genes are impacted in P27174. A total
of 3463 common genes are altered in both accessions and 671 of
these genes have common exons impacted (Supplementary Fig. 7).
These SVs highlight genomic regions that may help understand
major events associated with WL domestication.
White lupin genome evolution. We retraced the paleohistory of
12 legume genomes including WL and covering the Genistoid,
Dalbergioid, Galegoid, and Millettoid clades. Independent blocks
of synteny (Supplementary Note 5) allowed the identification of
an ancestral legume karyotype (ALK) made of 16 conserved
ancestral regions (CARs), Supplementary Data 4. The ancestral
genome consists of a minimal shared ancestral genome, which
lacks components of the
‘real’ (unknown) ancestral genome that
were either lost from all of the investigated descendants and/or
retained by only one modern species (Supplementary Data 4).
This reveals specific rearrangements (chromosome fusions and
fissions) and polyploidization events in the case of soybean and
lupins (WL and narrow-leafed lupin, NLL), so that modern
legume genomes are composed of a mosaic of 16 shuffled CARs
(Fig.
3
a, Supplementary Fig. 8). ALK experienced 15
chromoso-mal
fissions and 21 fusions to reach a lupin ancestor of 9
chro-mosomes that experienced a whole genome triplication to reach a
n
= 27 ancestor intermediate. The modern karyotypes of WL and
NLL evolved from the lupin ancestors through 17 major
chro-mosomal shuffling events followed by numerous small-scale
rearrangements such as inversions and translocations (Fig.
3
b).
This comparative genomics-based evolutionary scenario unravels
the complex legume paleohistory from the reconstructed ALK,
revising previous inferences of legume genomes synteny in
deli-vering the complete catalog of paralogous and orthologous gene
relationships between 12 modern legume genomes as well as the
ancestral genomes of this major botanical family
21,26–32.
a
Peanut (Ad) Lotus (Lj) Dalbergioid Galegoid Millettioid Chickpea (Ca) Garden pea (Ps) Barrel medic (Mt) Pigeonpea (Cc) Soybean (Gm) Common bean (Pv) Mungbean (Vr) Adzuki bean (Va) Narrow-leafed lupin (Lan)White lupin (Lal)
Legume ancestor 3x 2x
b
x3 Lupin ancestor n = 27 Lupin ancestor n = 9 Legume ancestor n = 16 White lupin WL vs NLL Narrow-leafed lupin 25 1 1 20 White lupin Narrow-leafed lupin NLL vs WL 12345678910 11 12 13 14 15 16 123456789 12345678910 11 12 13 14 15 16 17 18 19 20 21 22 23 24 25 26 27 1234567891011 12345678910 11 12345678910 11 12345678910 11 1213141516 1234 5678 910111213141516 12345678910 11 12 13 14 15 16 17 18 19 20 171819202122232425 123456789101112 13 14151617 18 1920 12345678 891011 12345678 1234567 1234567 12345678910 11 12 13 14 15 16 17 18 19 20 123456789 10 11 12 13 14 15 16 17 18 19 20 21 22 23 24 25 123456 123456 78910Fig. 3 White Lupin genome evolution. a Legumes evolutionary history. Evolutionary scenario of the modern legumes (white and narrow-leafed lupin, garden pea, peanut, Lotus, barrel medic, chickpea, pigeonpea, soybean, common bean, mungbean, and adzuki bean) from the reconstructed ancestral legume karyotype (ALK, center). The modern genomes are illustrated with different colors reflecting the origin from the ancestral chromosomes. Polyploidization events are shown with red (duplication) and blue (triplication) dots on the tree branches.b TOP- Evolution of white and narrow-leafed lupin genomes from ALK (with 16 CARs) and the lupin ancestral genomes (with 9 and 27 CARS excluding the small CAR #7 in ALK). BOTTOM- Synteny relationships between white (horizontal) and narrow-leafed (vertical) lupin illuminating 17 major chromosomal shuffling events (red and blue arrows for respectively narrow-leafed lupin compared to white lupin and white lupin compared to narrow-leafed lupin).
An intragenomic analysis for segmental duplications (Fig.
4
a,
Supplementary Note 5) identified 928 blocks bigger than 10 kb
pinpointing a triplication feature that can be observed in several
chromosome segments (e.g. Chr07, which has two homolog regions
with Chr12 and one with Chr13). These blocks have an average size
of 65 kb and the largest duplication consists of a 4.1-Mb block
shared between Chr18 and Chr20 (Fig.
4
a, Supplementary Data 5).
Reciprocal pairwise comparisons
33of the 38,258 WL genes with
104,607 genes from its closest relative NLL, the model legume
Medicago truncatula
34and Arabidopsis thaliana identified 25,615
orthologs clusters (Fig.
4
b). 473 out of these groups contain only
WL paralog genes (1242 in total), probably as a result of the
predicted genome triplication event (Supplementary Data 6). Gene
Ontology
35terms representation revealed an enriched annotation of
serine-type carboxypeptidase activity proteins (GO:0004185),
how-ever most of the clusters have no GO term associated (58%,
Supplementary Data 6). The WL genome shared highly conserved
syntenic blocks with the genome of NLL and Medicago truncatula,
the reference genome within this family (Supplementary Fig. 9).
Soil exploration. Most terrestrial plants can form mycorrhizal
symbioses that greatly improve mineral nutrition. Lupins
how-ever, lost the ability to form such associations (est. 12–14 My) and
the ability to form cluster roots appeared ca. 2.5 My ago
36. The
former was accompanied by the loss of all mycorrhizal specific
genes in the WL genome whereas common symbiotic genes
remained functional (Supplementary Fig. 10, Supplementary
Note 6 and Supplementary Data 7 and 8). This suggests that WL
favored a new type of root adaptive mechanism towards nutrient
acquisition
11. Despite the importance of cluster roots, no gene
controlling their development has been described to date. We
therefore generated a detailed transcriptomic dataset of WL
cluster root developmental zones. Our RNA-seq survey (mRNA
and miRNA) covered 8 sections of mature clusters that mimic the
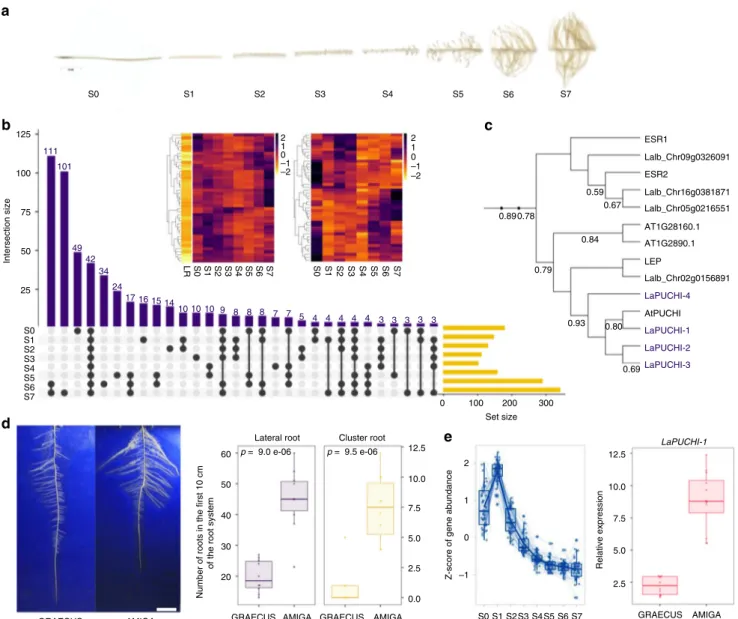
temporal stages of their development (Fig.
5
a and Supplementary
Note 7, Supplementary Fig. 11).
We produced a matrix representing all intersections of
up-regulated (Fig.
5
b, Supplementary Data 9) and down-regulated
(Supplementary Fig. 12, Supplementary Data 10) genes in the CR
parts. Mature rootlets (S6 and S7) showed the highest number of
up-regulated genes, compared to an ordinary lateral root, i.e.
devoid of cluster roots (Fig.
5
b). This set of genes have a strong
enrichment in GO terms associated with membrane components
linked with their highly active physiology required to remobilize
and acquire phosphate efficiently (Supplementary Figs. 13–15).
Interestingly, a list of 42 genes overexpressed in all cluster roots
parts (Supplementary Data 11, Fig.
5
b detail and Supplementary
Fig. 16) showed a strong enrichment in transcription factors
(43%) and 9 of them belong to the AP2/EREBP family
37. This is a
large multigene family, and they are key regulators of several
developmental processes, like
floral organ identity determination,
control of leaf epidermal cell identity and control of lateral root
development. In WL, we identified 217 genes in this family.
Similarly, a list containing only the genes overexpressed in the
S1 region, where CR initiation occurs, is also enriched with
transcription factors (6 out of 16). There is an overexpression of
3 genes of AP2/EREBP family that are homologs of AtPUCHI, a
gene that is required for morphogenesis in the early lateral root
primordium of Arabidopsis
38. We performed an identification of
all the homologs genes of the AP2/EREBP subfamily B-1, to
which the gene AtPUCHI belongs. We identified 20 homologs in
the white lupin genome and 4 homologs of the gene PUCHI
(Fig.
5
c, Supplementary Fig. 17).
In parallel, we identified all mature microRNAs that are
expressed in cluster root sections. We identified 103 miRNA
cluster families, among which 29 are predictions (Fig.
5
b detail,
Supplementary Data 12 and Supplementary Fig. 18). Some of the
known miRNA families that we identified were already described
as related with Pi-deficiency response, such as miRNA156,
miRNA166, and miRNA2111
39. We also detected members of
miRNA399 family, a key regulator for the phosphate starvation
response
40, that were not detected previously in CR of white
lupin
41,42(Supplementary Fig. 18a, Supplementary Data 12). We
identified that 14 genes out of the 42 overexpressed in all cluster
root zones are possible miRNA targets, including 5 transcription
factors (Supplementary Data 11). Likewise, in the group of
16 genes that are only overexpressed in the region S1, we
identified 5 genes that are targets of the detected miRNAs,
comprising transcription factors LaWRKY (Lalb_Chr07g0182001)
and LaPUCHI-3 (Lalb_Chr18g0055601).
A possible impact of domestication on WL soil exploration
capacity was investigated using a 2D-phenotyping platform. We
identified that the root system architecture of AMIGA develops
earlier than the wild-relative GRAECUS as a result of a strong
increase in lateral and cluster root number in the upper part of
the root system (Fig.
5
d, Supplementary Fig. 19). This difference
a
b
Lupinus albus 376 165 2502 91 231 1048 92 8920 1787 5224 345 465 240 473 38,258 20,470 10,495 33,076 19,671 7,134 44,115 14,506 13,613 27,416 14,103 5,630 Lupinus angustifolius Medicago truncatulaArabidopsis thaliana 25 24 23 22 21 20 19 18 17 16 15 14 13 12 11 10 9 8 7 1 2 3 4 5 6
Fig. 4 Lupin genome intragenomic duplications and genomic synteny. a Syntenic regions inside white lupin genome. The colored lines link colinearity blocks that represent syntenic regions that are bigger than 50 kb.b OrthoMCL clustering of white lupin genes with those of L. angustifolius, M. truncatula and A. thaliana. Numbers in the sections of the diagram indicate the number of clusters (gene groups). Thefirst number below each species name is the total number of genes of the species, the second number is the number of genes in clusters and the third number is the number of genes that did not cluster.
was correlated with an increased level of expression of the
regulatory gene LaPUCHI-1 (Fig.
5
c, e), whose genetic sequence
is identical in AMIGA and GRAECUS. A list of candidate genes
selected on their high induction level at the S1 stage (LaCLE1,
LaMYB1, LaPEP1, LaPME41, and LaSTART), also showed a higher
expression level in AMIGA compared to its wild relative GRAECUS
(Supplementary Fig. 20). This suggests that activation of key
regulatory genes may trigger the early establishment of the root
system, a trait that has been characterized in other crops to be key
for more efficient phosphate acquisition (e.g. the pup1 QTL in rice
where the PSTOL1
43gene controls early root system establishment).
Seed quality. We compared seed protein composition between
the AMIGA reference accession, the Ethiopian landrace (P27174)
and the wild GRAECUS relative by quantitative 1D gel analysis
followed by mass spectrometry identification of specific protein
bands (Fig.
6
b, Supplementary Note 8, Supplementary Fig. 21
and Supplementary Data 13). AMIGA seeds displayed a
dis-appearance of high molecular weight ß-conglutins (Fig.
6
c,
Sup-plementary Data 14), which are precursor forms normally
synthesized in developing cotyledons to give rise to mature
polypeptides of lower molecular weight. Their degradation starts
as part of the germination process and the appearance of simpler
forms in the domesticated variety AMIGA could be linked with
its increased seed vigor
44. The long chain ß-conglutins present in
the wild accession is also associated with a high allergenicity of
lupin seeds
45, a trait that might have been counter-selected during
domestication.
125 100 75 50 25 Intersection size S0 S1 S2 S3 S4 S5 S6 S7 S0 S1 S2 S3 S4 S5 S6 S7 S0 S1 S2 S3 S4 S5 S6 S7 Set size 0 100 200 300 111 101 49 42 34 24 17 16 15 14 10 10 10 9 8 8 8 7 7 5 4 4 4 4 4 3 3 3 3 3a
b
c
S0 S1 S2 S3 S4 S5 S6 S7d
e
GRAECUS AMIGA LaPUCHI-1 GRAECUS AMIGA 2.5 5.0 7.5 10.0 12.5 Relative expressionZ-score of gene abundance
S0 S1 S2S3 S4S5 S6 S7 Lateral root Cluster root
GRAECUS AMIGA GRAECUS AMIGA 20 30 40 50 0.0 60 2.5 5.0 7.5 10.0 2 1 0 –1 12.5
Number of roots in the first 10 cm
of the root system
p = 9.0 e-06 p = 9.5 e-06 LR 2 1 0 –1 –2 2 1 0 –1 –2 ESR1 Lalb_Chr09g0326091 ESR2 Lalb_Chr16g0381871 AT1G28160.1 AT1G2890.1 LEP Lalb_Chr02g0156891 LaPUCHI-4 LaPUCHI-1 LaPUCHI-2 LaPUCHI-3 AtPUCHI Lalb_Chr05g0216551 0.890.78 0.84 0.79 0.93 0.69 0.80 0.67 0.59
Fig. 5 Molecular events of root system establishment in white lupin. a 8 developmental stages of cluster root development used for transcriptomic studies, showing the formation of numerous rootlets.b Comparative matrix layout of up-regulated genes in the 8 CR segments. Black dots indicate which sample parts (S0 to S7) are grouped and the number of up-regulated genes in the group is indicated on top of each bar. Set size indicates the total number of differentially expressed genes for each sampled fragment. Inserts: heatmap of the 42 genes over expressed in all CR regions (left) and miRNA expressed in the entire CR.c Partial phylogenetic tree of AP2/EREBP subfamily B-1 of Arabidopsis and white lupin orthologs, highlighting the 4 PUCHI orthologs in white lupin.d Left. Visualization of white lupin root system in 2D. Right. Number of lateral roots and cluster roots in GRAECUS (wild) vs. AMIGA (modern) accessions in thefirst 10 cm of the root system (n = 10). Bar is 5 cm. e Left. Expression pattern of 63 genes that are overexpressed in S1 region, which include LaPUCHI-1. Right. Relative expression of LaPUCHI-1 in AMIGA and GRAECUS in top lateral roots of 11-day-old plants. Box edges represent the 0.25 quantile and 0.75 quantile with the median values shown by bold lines. Whiskers extend to data no more than 1.5 times the interquartile range, and remaining data are indicated by dots. Source data underlying Fig.5d, e are provided as a Source Datafile.
Measurement of the abundance of key alkaloids in various
organs revealed that the modern accession AMIGA has very low
levels of lupanine, 13-hydroxylupanine and 13-tigloyloxylupanine
(Fig.
6
d) but we were not able to match this lack of alkaloids with
reduced expression of candidate genes involved in the pathway
(Fig.
6
d, e, Supplementary Data 15). Instead, we identified a list of
candidate genes on Chr18 as associated to the pauper QTL that is
responsible for the sweet trait of modern WL accessions,
including AMIGA
17,46(Supplementary Note 9). This region of
958 kb contains 66 genes amongst which several strong
candidates encoding for protein with enzymatic activity such as
cinnamoyl-CoA reductase and acyltransferases (Supplementary
Data 16). Further functional characterization of these genes will
certainly lead to a better understanding of the alkaloid content
reduction observed in modern accessions and provide the genetic
mechanisms underlying the pauper locus.
Discussion
WL is a pulse that is becoming more and more attractive to
consumers seeking plant-based sources of proteins
47. The large
size of its seeds is considered to be a result of direct selection both
for consumer’s preferences (when used as a snack for human
consumption) and as an adaptation to its Mediterranean
envir-onment (larger seeds display early vigor that is needed to
com-plete their lifecycle before summer drought)
48. The adaptive
capacity of WL is therefore noticeable not only in the large seed
size, but also in their early root system that derives from it
49. Seed
vigor allows a quick establishment of the seedling root, a trait that
has been identified as a key parameter for the pup1 QTL in rice
resistance to low phosphate
43. Interestingly, we report here that
WL modern accessions present a large seed size with a specific
protein composition as well as a strong capacity for early soil
exploration through lateral and cluster root formation, compared
to wild accessions.
The striking ability of WL to form cluster roots is shared by
plants from 10 different botanical families
50(including monocots
from the Cyperaceae family). This raises the question whether
these developmental structures appeared independently several
times during evolution due to the lack of mycorrhizal associations
in these species or whether they were present in a common
ancestor and subsequently lost in most plants. The high-quality
genome sequence of WL, the only annual crop producing cluster
roots and showing a reduced need for phosphate fertilizers, will
help to understand the molecular mechanisms behind these
adaptations. Since phosphate is a limited resource
51, improved
phosphate acquisition could represent an important trait for the
future improvement of nutrient acquisition in other crops.
Although WL seeds already present protein contents that are
similar or higher than soybean, it remains a crop with
fluctuating
yields. Also, the ability to use a large gene pool for breeding has
been hampered by the presence of alkaloids in most wild
acces-sions. The characterization of the alkaloid pathway and the
identification of genes responsible for the sweet trait of cultivated
accessions will certainly help to take advantage of the wide
variability available in this species. The high-quality reference
genome sequence and companion resources of WL will help
reinforce breeding programs aimed at improving yield stability
and maintaining a low content of anti-nutritional alkaloids.
Lupanine LaLDC 13-hydroxylupanine 13-tigloyloxylupanine LaCAO LaHLT Amiga GRAECUS P27174 Amiga GRAECUS P27174
Normalized peak area
0.0 0.5 1.0 1.5 0.0 0.5 1.0 1.5 0.0 0.5 1.0 1.5 0.0 5.0 10.0 Relative expression 3-leaf stage 5-leaf stage Root Stem 0.0 5.0 10.0 0.0 5.0 10.0
a
b
e
GRAECUS P27174 AMIGAd
c
Amiga (LB) Amiga (DB) P27174 GRAECUS 250 150 100 75 50 37 25 20 KDa 5 8 12 16 18 A B A B A B A B Band 5 β-Conglutin Band 8 β-Conglutin Band 12 β,α2,α3-Conglutin Band 16 β-Conglutin Band 18 β-Conglutin 150 100 50 0 150 100 50 0 150 100 50 0 150 100 50 0 200 150 100 50 0 Relative luminescence Amiga (DB) Amiga (LB) P27174 GRAECUS O N N N N O O O O H H (+)-lupanine (+)-13-hydroxylupanine (+)-13-tigloyloxylupanine Cadaverine L-lysineNH2 NH2 NH2 NH2 O spontaneous 5-aminopentanal Δ1-piperideine NH2 CO2H N N N [O] HLT LDC CAO H H H OH HFig. 6 White lupin seed protein and leaf alkaloid content. a Grain appearance in GRAECUS (wild-type), Ethiopian landrace P27174 and cv. AMIGA. Bar is 0.5 cm.b Seed protein composition of AMIGA (DB, dark brown seeds; LB, light brown seeds), P27174 and GRAECUS (A and B: two independent extractions of proteins using Tris-SDS, separation in 12% SDS-PAGE). The bands extracted for MS/MS analysis are highlighted with red arrows.c Protein content quantification of each band extracted for each accession expressed in normalized gel volume. Data are presented as means ± SD, n = 2. d Abundance of the three major alkaloids in young leaf (3- and 5-leaf growth stage), stem and root tissues of the three accessions of L. albus as measured by LC-MS, and expression of the known alkaloid biosynthesis genes in young leaves as measured by qRT-PCR. n= 5 for AMIGA and n = 4 for P27174 and GRAECUS.e Putative biosynthetic pathway of tetracyclic quinolizidine alkaloids in lupins. Characterized steps and respective enzyme names are marked in red. More information about these analyses is described in Supplementary Note 9. LDC: lysine decarboxylase; CAO: copper amine oxidase; HLT: 13-hydroxylupanine O-tigloyltransferase. Data are presented as means ± SD, n= 4. Source data underlying Figs.6b, d are provided as a Source Datafile.
Methods
Genome assembly and annotation ofL. albus L. cv. AMIGA. A meta-assembly strategy similar to the one developed to assemble the Rosa genome52was applied.
The Supplementary Data 1 provides details of the different steps of the process including data, software and the evolution of the metrics of the assembly. Firstly, three assemblies were performed with CANU15using different level of stringency
(errorRate= default, 0.015 and 0.025 respectively). Corrected reads generated by CANU15were also used to run FALCON16. The graph of overlaps of FALCON was
filtered using three different sets of parameters of the program til-r52, in order
again to generate alternative assemblies with different level of stringency. The N50 metrics of the primary assemblies ranged from 1.6 to 7.1 Mb. The sequences of these six primary assemblies werefirst transformed in pseudo long reads of 100 kb with an overlap of 50 kb. Then, the pseudo long reads were assembled with CANU 1.6 in the mode–trim-assemble to enable the trimming of sequence ends specific to a single primary assembly.
The meta-assembly result displays a N50 of 8.9 Mb in only 129 contigs. The Bionano hybridScaffold.pl software was run in order to scaffold the contigs of the meta-assembly using the Bionano Optical map (N50 2.3 Mb). In all, 15 putative breakpoints were identified and corrected by the scaffolder. The scaffolds were polished twice,firstly using arrow and the pacbio raw data mapped with blasr, then with Pilon53using 100x of illumina data mapped with glint software ( http://lipm-bioinfo.toulouse.inra.fr/download/glint/). Finally the pseudo-chromosomes were obtained with ALLMAPS54by scaffolding the polished scaffolds with the high
density genetic map17. A total 96.2% of the data were anchored on the linkage map
and 95.3% were oriented (Supplementary Fig. 1). Detailed information about the genome annotation is presented in Supplementary Note 1.
Evaluation of AMIGA heterogeneity. In order to evaluate the heterogeneity of cv. AMIGA, a bulk of 90 AMIGA plants was resequenced using Illumina HiSeq300, with paired-end 2 × 150 bp reads. This produced 193,734,276 clean reads corre-sponding to a total of 64.47x depth. Cutadapt55has been used to remove Illumina
Truseq adapter from the sequencing data and to remove bases with a quality score lower than 30, in both 5′ and 3′ end of the reads. Reads with a length lower than 35 have been discarded. We used BWA-MEM version 0.7.1756to map the
rese-quencing reads to the white lupin reference genome. Picard tools (https://github. com/broadinstitute/picard/issues) have been used to detect and remove PCR and Optical duplicates. We then used GATK 4.057HaplotypeCaller tool to call variants.
This identified ca. 300,000 SNPs without filtering the data. All the SNPs are evenly distributed on the 25 chromosomes and contigs. We generated a VCFfile with this information, available in the white lupin Genome Browser.
Assembly of mitochondrial and chloroplastic genomes. A de novo assembly protocol was used to assemble both cytoplasmic genomes. They were generated using NOVOPlasty 3.258, by using the aforementioned Illumina reads, after
adapter-removing step. Assembly of chloroplastic genome (plastome) was per-formed using as reference a publicly available L. albus plastome (GenBank acces-sion NC_026681) and mitochondrial genome (mitogenome) was assembled using the Vicia faba mitogenome (GenBank accession KC189947) as reference. The assemblies were checked with Geneious v. 9.1.9 mapper tool by mapping Illumina and PacBio reads. For the mitogenome annotation we used as reference other legume species with available annotated mitogenomes on NCBI, whereas for the plastome annotation we used as a reference the available L. albus plastome. The assembly of the cytoplasmic genomes resulted in single circularized contigs of 151,915 bp for the plastome (Supplementary Fig. 22) and 405,575 bp for the mitogenome (Supplementary Fig. 23).
Annotation of repeats. Identification and characterization of moderately to highly repeated genomic sequences was achieved by graph-based clustering of genomic Illumina reads using RepeatExplorer2 pipeline59. A total of 1,144,690 of 150 bp
paired reads, representing ~0.5× genome coverage, were used for the clustering and the 145 largest clusters with genome proportions of at least 0.01% were examined in detail. Clusters containing satellite DNA (satDNA) repeats were identified based on the presence of tandem sub-repeats within their read or assembled contig sequences with TAREAN60. Genome-wide TE repeat annotation was performed
using the DANTE (Domain-based ANnotation of Transposable Elements) tool60.
Consensus sequences of satDNA repeats and rDNA genes were used to perform genome-wide annotation of satDNA and rDNA arrays using the Geneious v. 9.1.8 annotation tool (https://www.geneious.com). The generated GFF3files were further incorporated on the L. albus genome browser.
Chromosome preparation for in situ hybridization. Chromosome preparations for in situ hybridization analysis were conducted as described in Marques et al.61.
with modifications. First, young roots (pre-treated with 8-hydroxyquinoline 2 mM for 3–5 h at room temperature) and anthers were fixed in 3:1 (ethanol:acetic acid) for 2–24 h. The fixed tissues were treated with an enzyme mixture (0.7% cellulase R10, 0.7% cellulase, 1.0% pectolyase, and 1.0% cytohelicase in 1× citric buffer) for 1 h at 37 °C. Material was then washed twice in water and fragmented in 7μl of 60% freshly prepared acetic acid into smaller pieces with the help of a needle on a slide. Another 7μl of 60% acetic acid was added, and the specimen was kept for
2 min at room temperature. Next, a homogenization step was performed with an additional 7μl 60% acetic acid and the slide was placed on a 55-°C hot plate for 2 min. The material was spread by hovering a needle over the drop without touching the hot slide. After spreading of cells, the drop was surrounded by 200μl of ice-cold, freshly prepared 3:1 (ethanol:acetic acid)fixative. More fixative was added and the slide was briefly washed in fixative, then dipped in 60% acetic acid for 10 min and dehydrated in 96% ethanol. The slides were stored until use in 96% ethanol at 4 °C.
Probe preparation andfluorescence in situ hybridization. FISH probes were obtained as 5′-Cy3 or 5′-FAM-labeled oligonucleotides (Eurofins MWG Operon,
http://www.eurofinsdna.com), or were PCR-amplified as described below. All DNA probes, except oligonucleotides, were labeled with Cy3- or Alexa 488-dUTP (Jena Bioscience) by nick translation, as described in Kato et al.62. The sequences of all
oligonucleotides and primers are listed in Supplementary Table 5. FISH was per-formed as described in Marques et al.61. Probes were then mixed with the
hybri-dization mixture (50% formamide and 20% dextran sulfate in 2× SSC), dropped onto slides, covered with a cover slip and sealed. After denaturation on a heating plate at 80 °C for 3 min, slides were hybridized at 37 °C overnight. Post-hybridization washing was performed in 2× SSC for 20 min at 58 °C. After dehy-dration in an ethanol series, 4′,6–diamidino-2–phenylindole (DAPI) in Vectashield (Vector Laboratories,http://www.vectorlabs.com) was applied. Microscopic images were recorded using a Zeiss Axiovert 200 M microscope equipped with a Zeiss AxioCam CCD. Images were analyzed using the ZEN software (Carl Zeiss GmbH). Primer and oligo-probes information is presented in Supplementary Note 3, Supplementary Table 4.
Labeling of tandem repeat and retroelement fragments. Fragments for probe labeling were amplified using genomic DNA from L. albus using the forward and reverse primers as supplied on Supplementary Table 4. Eight PCR reactions for each target repeat were performed in 50μL reaction volume containing 100 ng of gDNA, 1μM primers, 1 × PCR buffer, 0.2 mM dNTPs, and 1U of Taq polymerase (Qiagen). Thirty-five amplification cycles with proper conditions for each set of primers were run. PCR reactions were sampled, purified and concentrated using Wizard® SV Gel and PCR Clean-Up System (Promega). Sanger sequencing con-firmed correct amplification of PCR fragments. After confirmation, the PCR products containing the same class of repeat were collected and used for probe labeling by nick translation as described above.
LalbCENH3-ChIP and ChIP-seq analyses. Chromatin immunoprecipitation experiments were done with Abcam ChIP Kit - Plants (ab117137) following the manufacturer’s instructions. First, 1 g of young L. albus cv. AMIGA leaves were collected and cross-linked with formaldehyde 1% for 15 min on ice. Leaves were then ground in liquid nitrogen and sonicated using a Diagenode Sonicator. Soni-cated chromatin-DNA ranging from 200–1000 bp was immunoprecipitated using anti-LalbCENH3 (lifetein.com, 1:300 dilution). Immunoprecipitated DNA samples and, as a control, an input chromatin DNA samples (3–7 ng for each sample) were sent for ChIPseq at BGI. The original ChIPseq sample data are available at White Lupin Genome Website (http://www.whitelupin.fr). To identify repeats associated with CENH3-containing chromatin, reads from the ChIPseq experiment obtained by sequencing DNA from isolated chromatin prior to (the input control sample) and after immunoprecipitation with the CENH3 antibody (1:200 dilution, the ChIP sample) were separately mapped to the repeat clusters. The mapping was based on read similarities to contigs representing individual clusters, using BLASTn with parameters‘-m 8 -b 1 -e 1e-20 -W 9 -r 2 -q -3 -G 5 -E 2 -F F’ and custom Perl scripts for parsing the results. Each read was mapped to a maximum of one cluster, based on its best similarity detected among the contigs. Ratio of ChIP/input reads assigned to individual clusters was then used to identify repeats enriched in the ChIP sample as compared to the input.
Data generation with short-reads technology. We selected 14 white lupin accessions to evaluate a broader range of the genetic diversity and determine population structure and linkage disequilibrium. More information about these accessions can be found in Supplementary Note 4. Young leaves of 30 plants were used to extract genomic DNA of each accession using the QIAGEN Genomic-tip 100/G kit following the supplier’s recommendations. The accessions were sequenced using Illumina technology using paired-end 2 × 150 bp short-reads. It was generated a total of 310.95 Gb of data with average sequencing depth of 45.99× (Supplementary Table 8).
Mapping and SNP detection. Cutadapt55was used to remove Illumina Truseq
adapters from the sequencing data and to remove bases with a quality score lower than 30, in both 5’ and 3’ end of the reads. Reads with a length lower than 35 were discarded. We then used BWA-MEM version 0.7.1756to map the resequencing
reads from all 15 genotypes to the white lupin reference genome. PCR and Optical duplicates have been detected and removed using Picard Tools. After that, GATK 4 HaplotypeCaller tool have been used in emit-ref-confidence GVCF mode to pro-duce one gvcffile per sample. These files have been merged using GATK Com-bineGVCFs. Finaly, GATK GenotypeGVCFs have been used to produce a vcffile
containing variants from all the 15 samples. This identified a total of 6,620,353 SNPs/indel. Afterfiltering for minimum allele frequency of 0.15 and heterozygosity frequency of 0–0.2, 2,659,837 SNPs were retained to further analysis.
Phylogenetic analysis and population structure. The genetic distance matrix was calculated based on identity-by-state similarity method and an average cladogram constructed using neighbor-joining algorithm implemented on TASSEL 5.2.5163.
Then, a phylogenetic tree was prepared using the iTOL v 4.364. A principal
component analysis (PCA) was also performed in R (http://www.R-project.org/) function‘prcomp’. A Bayesian model-based clustering method implemented with STRUCTURE v2.3.422was used to investigate the population structure using all the
filtered SNPs. The program was run 10 times for each K value, ranging from 1 to 5, with a 1000 burn-in time and 1000 iterations. The optimal K value was determined based on theΔK from the Structure Harvester v0.6.9465program, through
Evan-no’s test23.
De novo assembly of GRAECUS and P27174. Long-read sequencing was realized using Oxford Nanopore technology, using a GridION 18.04.1-0, with a software Minknow 1.10.24-1 at platform at Get-PlaGe core facility (INRA, Toulouse, France). High MW DNA was used to prepare a library with the Ligation Sequencing Kit 1D (sqk-lsk109). DNA was sequenced using a single ONT MinION R9.4flowcell (FLO-MIN106) for 48 h and base-calling was performed using Albacore 2.1.10-1. This produced 1,280,206 sequences for GRAECUS, corre-sponding to 12.45 Gb of data with a N50 length of 13.6 Kb (27.6 x of sequencing depth). For the accession P27174 this produced a total of 1,738,579 reads corre-sponding to 14.59 Gb of data with N50 length of 11.8 Kb (32.36 x of sequencing depth). The de novo assembly of the two genotypes were performed using CANU15. For P27174-4, two round of correction have been made prior to the
assembly step, using the parameters correctedErrorRate= 0.16 and corMax-EvidenceErate= 0.15. For GRAECUS, only one round of correction have been made, using minOverlapLength= 400, correctedErrorRate = 0.16 and corMax-EvidenceErate= 0.15. The Illumina paired-end data described in 3.1 were used to polish two times the two genome assemblies using Pilon53. BUSCO v 3.0.066was
run on the set of predicted transcripts. The assessment software detected for GRAECUS 96.8% of complete gene models (1142 complete single copy and 188 duplicated respectively) plus 9 additional fragmented gene models. For P27174 97.8% of complete gene models (1125 complete single copy and 220 duplicated respectively) plus 4 additional fragmented gene models. Structural variation of these two accession were performed using Assemblytics24based on whole genomes
alignments generated with MUMmer25. Details of the de novo genome assembly
and analysis of structural variation of these two accessions are provided in Sup-plementary Note 4.
Evolutionary analysis of the legume genomes. The proposed evolutionary sce-nario was obtained following the method described in Pont et al.67based on synteny
relationships identified between L. albus and other 11 legume species. Briefly, the first step consists of aligning the investigated genomes to define conserved/duplicated gene pairs on the basis of alignment parameters referenced to as Cumulative Identity Percentage (CIP) and Cumulative Alignment Length Percentage (CALP). The second step consists of clustering or chaining groups of conserved genes into synteny blocks (excluding blocks with less than 5 genes) corresponding to independent sets of blocks sharing orthologous relationships in modern species. In the third step, conserved gene pairs or conserved groups of gene-to-gene adjacencies defining identical
chromosome-to-chromosome relationships between all the extant genomes are merged into Conserved Ancestral Regions (CARs). CARs are then merged into protochromosomes based on partial synteny observed between a subset (not all) of the investigated species. The ancestral karyotype can be considered as a‘median’ or ‘intermediate’ genome consisting of protochromosomes defining a clean reference gene order common to the modern species investigated. From the reconstructed ancestral karyotype an evolutionary scenario was then inferred taking into account the fewest number of genomic rearrangements (including inversions, fusions,fissions, translocations), which may have operated between the inferred ancestors and the modern genomes. Additional information is provided in Supplementary Note 5. Genome synteny and intragenomic collinearity. To identify intragenomic coli-nearity blocks inside the white lupin genome we used SynMap (CoGe,www. genomevolution.org) using homologous CDS pairs using the following parameters: Maximum distance between two matches (-D): 20; Minimum number of aligned pairs (-A): 10; Algorithm‘Quota Align Merge’ with Maximum distance between two blocks (-Dm): 500.
Gene family identification. We used a comparative analysis to examine the conservation of gene repertoires among orthologs in the genomes of white lupin, narrow-leafed lupin (v1.0) M. truncatula (Mt4.0) and Arabidopsis thaliana (TAIR10). First, we aligned all-to-all proteins using BLASTP (e-value of 1e−5). Genes were then clustered using OrthoMCL (1.4) implemented in OrthoVenn33
with a Markov inflation index of 1.5 and a minimum e-value of 1e−15.
Spatial transcriptome for mRNA and small RNA. Ten cluster roots coming from four grown plants were harvested after 12 days of culture and dissected in eight parts of 0.5-cm from the apex of the lateral root that carries the cluster root (Supplementary Note 7). As control, 1-cm of lateral roots without cluster roots, sampled 1-cm away from the primary root, were collected. Four biological repli-cations were produced for each experiment. Total RNA was extracted from all frozen samples using the Direct-zol RNA MiniPrep kit (Zymo Research, Irvine, CA) according to the manufacturer’s recommendations.
For mRNA sequencing, 36 independent root RNA-seq libraries were constructed using Illumina TruSeq Stranded mRNA Sample Preparation Kit (Illumina Inc.) according to the manufacturer’s protocol. The samples were sequenced using paired-end sequencing was performed generating paired-ended 2 × 150 bp reads using TruSeq SBS kit v3 sequencing chemistry (Illumina Inc.) in one lane of Illumina NovaSeq instrument according to the manufacturer’s instructions. A total of 2,048,118,650 paired-end reads of 150 pb were sequenced using an Illumina NovaSeq6000 Sequencer. To remove low quality sequences, the RNA-seq reads were checked and trimmed using Cutadapt55with a
minimum quality score of 30 in both 3′ and 5′ end, with the nextseq-trim option enabled. Illumina TruSeq adapter sequences have also been removed. The resulting reads shorter than 35 pb have been discarded. The quality checked RNA-seq reads were then mapped on white lupin reference genome using Hisat268software. Transcripts were assembled and quantified using Stringtie
software. Gene counts were extracted and imported in the R package DESeq269.
These counts have been normalized according to the size factor computed by DESeq2.
For small RNA sequencing, 24 independent root RNA-seq libraries were constructed using NEXTflex™ Small RNA-Seq kit according to the manufacturer’s protocol. All small RNA libraries were sequenced on an Illumina NextSeq 500 sequencing platform, using a single-end, 75 nt read metric instrument according to the manufacturer’s instructions. A total of 460,506,072 reads of 75 nt were sequenced. Small RNA-seq reads were trimmed using Cutadapt version 1.1155
to remove remnants of the following 3′-adapter sequence. Details on the trimming, assembly, differential expression analysis, and miRNA family identification can be found in Supplementary Note 7.
Root sampling and expression analysis of cluster root genes. We sampled 2–3 cm of lateral roots 1-cm away from the primary root in the top 5 cm (cluster root region, CRR) and at 10 cm from the top (regular lateral root region, NLR) of the root system of AMIGA and GRAECUS plants, 11 days after ger-mination. Three CRR and 3 NLR independent samples were collected for each accession. Total RNA from these samples was extracted using the Direct-zol RNA MiniPrep kit (Zymo Research, Irvine, CA) according to the manufacturer’s recommendations. RNA concentration was measured on a NanoDrop (ND1000) spectrophotometer. Poly(dT) cDNA were prepared from 2μg total RNA using the revertaid First Strand cDNA Synthesis (Thermo Fisher). Gene expression was measured by quantitative Real Time - Polymerase Chain Reac-tion (qRT-PCR) (LightCycler 480, Roche Diagnostics, Basel, Switzerland) using the SYBR Premix Ex Taq (Tli RNaseH, Takara, Clontech, Mountain View, CA) in 384-well plates (Dutscher, Brumath, France). Target quantifications were performed with specific primer pairs described on the Supplementary Table 11. Expression levels were normalized to LaHelicase (Lalb_Chr13g0304501). All qRT-PCR experiments were performed in technical quadruplicates. Relative gene expression levels were calculated according to theΔΔCt method70, using as
a calibrator the NLR samples. All experiments were performed as three biolo-gical replicates.
Reporting summary. Further information on research design is available in the Nature Research Reporting Summary linked to this article.
Data availability
Data supporting thefindings of this work are available within the paper and its Supplementary Informationfiles. A reporting summary for this Article is available as a Supplementary Informationfile. The datasets generated and analyzed during the current study are available from the corresponding author upon request. Full genomic, RNAseq, ChIPseq and raw sequence data are publicly available for download on the White Lupin genome portal [www.whitelupin.fr] that contains a Genome Browser, Expression tools and a Sequence retriever. This Whole Genome Shotgun project has been deposited at DDBJ/ENA/GenBank under the accessionWOCE00000000. The version described in this paper is WOCE01000000. The ChIPseq data have been deposited at NCBI under the accessionPRJNA593700. The RNAseq data have been deposited at NCBI under the accessionPRJNA575804(10 organs transcriptomics,) andPRJNA593912(cluster root spatial transcriptomics,). The source data underlying Figs.1d,2b,5d,5e, and6b, d are provided as a Source Datafile.