HAL Id: insu-01624642
https://hal-insu.archives-ouvertes.fr/insu-01624642
Submitted on 26 Oct 2017
HAL is a multi-disciplinary open access
archive for the deposit and dissemination of
sci-entific research documents, whether they are
pub-lished or not. The documents may come from
teaching and research institutions in France or
abroad, or from public or private research centers.
L’archive ouverte pluridisciplinaire HAL, est
destinée au dépôt et à la diffusion de documents
scientifiques de niveau recherche, publiés ou non,
émanant des établissements d’enseignement et de
recherche français ou étrangers, des laboratoires
publics ou privés.
a changing climate
Stefanie Falk, Björn-Martin Sinnhuber, Gisèle Krysztofiak, Patrick Jöckel,
Phoebe Graf, Sinikka T. Lennartz
To cite this version:
Stefanie Falk, Björn-Martin Sinnhuber, Gisèle Krysztofiak, Patrick Jöckel, Phoebe Graf, et al..
Bromi-nated VSLS and their influence on ozone under a changing climate. Atmospheric Chemistry and
Physics, European Geosciences Union, 2017, 17 (18), pp.11313-11329. �10.5194/acp-17-11313-2017�.
�insu-01624642�
https://doi.org/10.5194/acp-17-11313-2017 © Author(s) 2017. This work is distributed under the Creative Commons Attribution 3.0 License.
Brominated VSLS and their influence on ozone
under a changing climate
Stefanie Falk1, Björn-Martin Sinnhuber1, Gisèle Krysztofiak2, Patrick Jöckel3, Phoebe Graf3, and Sinikka T. Lennartz4
1Institute of Meteorology and Climate Research, Karlsruhe Institute of Technology, Karlsruhe, Germany 2LPC2E, Université d’Orléans, CNRS, UMR7328, Orléans, France
3Deutsches Zentrum für Luft- und Raumfahrt e.V., Oberpfaffenhofen, Germany 4Geomar, Helmholtz Centre for Ocean Research Kiel, Kiel, Germany
Correspondence to:Stefanie Falk (stefanie.falk@kit.edu) Received: 13 January 2017 – Discussion started: 3 March 2017
Revised: 10 August 2017 – Accepted: 2 September 2017 – Published: 25 September 2017
Abstract. Very short-lived substances (VSLS) contribute as source gases significantly to the tropospheric and strato-spheric bromine loading. At present, an estimated 25 % of stratospheric bromine is of oceanic origin. In this study, we investigate how climate change may impact the ocean– atmosphere flux of brominated VSLS, their atmospheric transport, and chemical transformations and evaluate how these changes will affect stratospheric ozone over the 21st century.
Under the assumption of fixed ocean water concentrations and RCP6.0 scenario, we find an increase of the ocean– atmosphere flux of brominated VSLS of about 8–10 % by the end of the 21st century compared to present day. A decrease in the tropospheric mixing ratios of VSLS and an increase in the lower stratosphere are attributed to changes in atmo-spheric chemistry and transport. Our model simulations veal that this increase is counteracted by a corresponding re-duction of inorganic bromine. Therefore the total amount of bromine from VSLS in the stratosphere will not be changed by an increase in upwelling. Part of the increase of VSLS in the tropical lower stratosphere results from an increase in the corresponding tropopause height. As the depletion of strato-spheric ozone due to bromine depends also on the availability of chlorine, we find the impact of bromine on stratospheric ozone at the end of the 21st century reduced compared to present day. Thus, these studies highlight the different factors influencing the role of brominated VSLS in a future climate.
1 Introduction
Ozone is an important trace gas in the Earth’s atmosphere. The stratospheric layer with its highest abundance, the ozone layer, absorbs harmful ultraviolet radiation threatening all life forms on the Earth’s surface and acts as a potent green-house gas (GHG). In the troposphere, ozone is consid-ered a harmful pollutant. Catalytic cycles involving bromine and mixed halogen reactions, namely with chlorine, effi-ciently deplete ozone (e.g., Sinnhuber et al., 2009). The ozone depletion efficiency of bromine is strongly related to the available amount of activated chlorine in the atmo-sphere (Yang et al., 2014; Sinnhuber and Meul, 2015; Oman et al., 2016). Long-lived, anthropogenically emitted, halo-genated source gases (SG), e.g., CH3Br and halons, have
been restricted by the Montreal Protocol and its amend-ments. Their atmospheric concentrations have started to de-cline globally (see Global Ozone Research and Monitor-ing Project, 2011, Chap. 1). Still, they contribute about 75 % to the overall bromine loading in the stratosphere. The remainder is provided by organic SG of oceanic ori-gin of which methyl bromide (CH3Br), bromoform (CHBr3),
and dibromomethane (CH2Br2) are the most abundant.
Mi-nor brominated very short-lived substances (VSLS) include the mixed bromochlorocarbons CHCl2Br, CHClBr2, and
CH2ClBr. The tropospheric lifetime of these gases lies
be-tween several days to weeks. They are produced by plankton and macroalgae and are predominantly produced in coastal
SG
PG
W C
m
Figure 1. Scheme of VSLS emission and catalytic cycle of ozone depletion involving bromine. (left) VSLS are produced by plankton and macroalgae predominantly in coastal waters. They are emitted through gas exchange between ocean and atmosphere. These organic source gases (SG) undergo chemical transformation into inorganic product gases (PG). Both are convectively transported through the tropical tropopause layer (TTL). Through photochemical decomposition, reactive bromine Bryis provided to the stratosphere. (right) Two examples
of catalytic cycles of ozone depletion involving bromine. A + indicates increasing order of catalytic complexity. Reactants are shown in red, catalysts in black, and products in blue. Photochemical reactions are indicated by a violet wave.
waters (Moore et al., 1996; Lin and Manley, 2012; Hughes et al., 2013; Stemmler et al., 2015). Through gas exchange governed by the concentration gradient between ocean wa-ter and atmosphere, solubility, and wind stress, VSLS are emitted into the atmosphere. Transport to the stratosphere, as shown by different model studies (Aschmann et al., 2009; Hossaini et al., 2012; Liang et al., 2014), occurs in tropi-cal regions of deep convection, most importantly the western Pacific and Maritime Continent, in Southeast Asia, and over the Gulf of Mexico. Organic SG are transported through the tropical tropopause layer (TTL) together with their inorganic product gases (PG). PG are produced through photochemical decomposition of VSLS and provide reactive bromine (Bry,
from Br, Br2, HBr, BrO, BrONO2, BrNO2, BrCl, and HOBr)
to the stratosphere. This is schematically shown in Fig. 1. In recent years, several approaches have been taken to describe the stratospheric or regional abundance of bromine from VSLS. Top-down scenarios (Warwick et al., 2006; Liang et al., 2010; Ordonez et al., 2012) match atmospheric ob-servations by setting constant fluxes or boundary concentra-tions. Bottom-up scenarios (e.g., Ziska et al., 2013) devel-oped emission climatologies by extrapolating measurements in the surface ocean and marine boundary layer and calculate emissions accordingly. As shown by Lennartz et al. (2015), the bottom-up fluxes based on the oceanic water concen-trations of Ziska et al. (2013) are in good agreement with available atmospheric VSLS observations. Recently, Ziska et al. (2017) have investigated the future evolution of the ocean–atmosphere fluxes of VSLS through the 21st century based on Coupled Model Intercomparison Project (CMIP) 5
model output and fixed atmospheric VSLS concentrations. They found fluxes of CH2Br2and CHBr3increasing by 6.4 %
(23.3 %) and 9.0 % (29.4 %), respectively, dependent on the Representative Concentration Pathways (RCP) 2.6 (RCP8.0) scenario.
In this study, we will address the open questions on how these oceanic emissions of VSLS evolve in response to a changing climate and changing atmospheric concentrations (Sect. 3), how transport and tropospheric chemistry influence the stratospheric bromine abundance in a changing climate (Sect. 4), and how stratospheric ozone will be affected by the assumed changes in VSLS abundance (Sect. 5). Details about the model and simulations used in this study will be given in Sect. 2.
2 Model and experiments
All model experiments have been performed using the
ECHAM/MESSy Atmospheric Chemistry (EMAC)
model (Jöckel et al., 2010). Table 1 gives an overview over the key factors of the simulations.
Future changes in fluxes of brominated VSLS from the ocean are studied with a free-running long-term simula-tion (SC_free, 1979–2100) using a simplified chemistry (Sect. 3), augmented by a similar simulation, but nudged towards the European Centre for Medium-Range Weather Forecasts (ECMWF) ERA-Interim reanalysis over the period 1979–2012. Therein, VSLS emission fluxes are computed online from prescribed seawater concentrations. The simpli-fied chemistry simulations use EMAC version 2.50 with
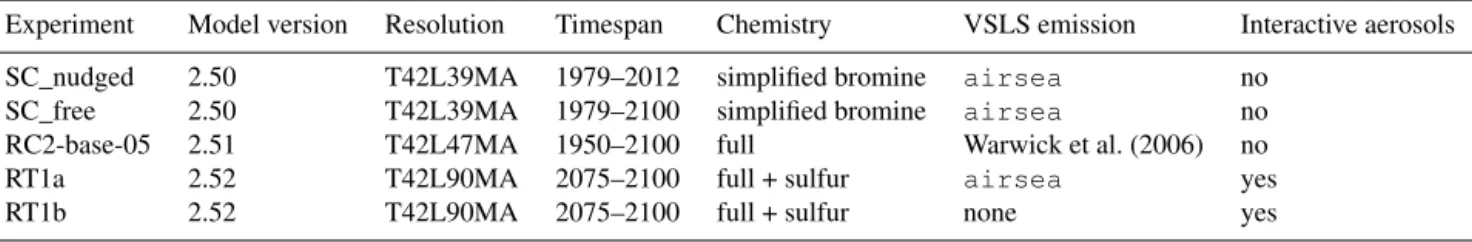
sub-Table 1. EMAC model experiments used in this study. All experiments follow the RCP6.0 scenario of GHG emissions and have accordingly prescribed SST and SIC from HadGEM2.
Experiment Model version Resolution Timespan Chemistry VSLS emission Interactive aerosols
SC_nudged 2.50 T42L39MA 1979–2012 simplified bromine airsea no
SC_free 2.50 T42L39MA 1979–2100 simplified bromine airsea no
RC2-base-05 2.51 T42L47MA 1950–2100 full Warwick et al. (2006) no
RT1a 2.52 T42L90MA 2075–2100 full + sulfur airsea yes
RT1b 2.52 T42L90MA 2075–2100 full + sulfur none yes
models airsea (Pozzer et al., 2006) (with the water-side transfer velocity parameterization kw=0.222 u2+0.333 u
with respect to wind speed according to Nightingale et al., 2000), cloud, cloudopt, convect (with operational ECMWF convection scheme), cvtrans, ddep (Kerkweg et al., 2006a), ptrac (Jöckel et al., 2008), rad, scav (Tost et al., 2006), surface, and tnudge (Kerkweg et al., 2006b). The setup is as in Lennartz et al. (2015); Hossaini et al. (2016). Chemical reactions are not computed interac-tively, e.g., via the EMAC submodel mecca (Sander et al., 2011a). The VSLS lifetime due to reaction with OH has been fixed to monthly mean values from the National Cen-tre for Meteorological Research (CNRM) (Michou et al., 2011; Morgenstern et al., 2016) model calculations, while photolysis rates are computed within the EMAC submodel jval(Sander et al., 2014). Only in these simulations with simplified chemistry, OH concentrations have been set to zero in the lower troposphere (700–1000 hPa) to reduce the variability of ground level volume mixing ratio (VMR) of VSLS. The chemical lifetime of VSLS in the lower tropo-sphere is therefore overestimated. Due to the longer life-time, VSLS are more abundant in the lower troposphere lead-ing to a flux suppression. Water concentrations of CH2Br2
and CHBr3 have been held constant using the
climatol-ogy of Ziska et al. (2013). For mixed bromochlorocarbons (CHBrCl2, CHBr2Cl, CH2BrCl), water concentrations have
been estimated by scaling CHBr3 concentrations to obtain
a better agreement between model simulation and tropical mean profile and surface observations of these VSLS. Based on the lifetime estimate, VSLS are decomposed and con-verted to Bry. The partitioning of Bry into Br, Br2, HBr,
BrO, BrONO2, BrNO2, BrCl, and HOBr in these
simpli-fied chemistry simulations has been computed offline from a full-chemistry EMAC simulation of 1-year duration with 6-hourly output. Scavenging is applied to Br, Br2, HBr, BrNO2,
BrONO2, BrCl, and HOBr. Concentrations of CO2, CH4,
CFC, and N2O in SC_free are taken from a CNRM CM5
model (Voldoire et al., 2013) simulation with RCP6.0 sce-nario (Fujino et al., 2006; Hijioka et al., 2008).
Data of a full-chemistry long-term simulation (RC2-base-05, Jöckel et al., 2016) over a timespan of 150 years (1950– 2100) and performed as part of a Chemistry-Climate Model Initiative (CCMI) recommended set of simulations by the
Earth System Chemistry integrated Modelling (ESCiMo) Consortium will be used for studying changes in trans-port and photochemical transformation of bromine species (Sect. 4). In this simulation, VSLS fluxes have been held con-stant following scenario five of Warwick et al. (2006).
An intermediate-term experiment, consisting of a set of two simulations and spanning the years 2075–2100, has been performed for assessing implications on ozone depletion in a future climate with significantly lower chlorine loading in the atmosphere (Sect. 5). The simulations named RT1a and RT1b both include online computation of aerosol formation. Fluxes of CH2Br2and CHBr3are computed online from
sea-water concentrations of Ziska et al. (2013) using the EMAC submodel airsea as in RC2-base-05 with the kw
parame-terization according to Wanninkhof (1992), which is strictly quadratic with respect to wind speed (kw=0.31 u2). For
as-sessing the impact of VSLS on ozone, all VSLS emissions have been switched off in RT1b. The impact of various kw
pa-rameterizations on VSLS emission has been previously stud-ied. The differences on the global level are < 15 % (see Ta-ble 4 in Lennartz et al., 2015, when comparing Nightingale et al., 2000, and Wanninkhof and McGillis, 1999). For wind speeds exceeding 10 ms−1the Wanninkhof (1992) kw
param-eterization diverges slightly stronger towards higher transfer velocities compared to the Nightingale et al. (2000) param-eterization (cf. Fig. 1 in Wanninkhof and McGillis, 1999, and Fig. 2 in Lennartz et al., 2015). Regarding integrated global emissions of VSLS, both parameterizations result in similar fluxes given that the mean global wind speed lies in a range where these parameterizations do not differ drasti-cally. However, the Nightingale et al. (2000) parameteriza-tion reacts more sensitively to changes in wind speed, which introduces a further uncertainty when assessing changes over time in a changing climate. The full-chemistry experiments use EMAC version 2.51 (RC2-base-05) and 2.52 (RT1a/b), respectively. The dynamics have not been specified except for a weak nudging of the equatorial wind quasi-biennial os-cillation (QBO). RC2-base-05 combines hindcast with future projections. The setup of RT1a and RT1b is almost identi-cal to RC2-base-05, and so we refer to the corresponding paper by the ESCiMo Consortium (Jöckel et al., 2016) for general information. The major difference lies in the afore-mentioned treatment of VSLS emission, which is handled
analogous to SC_free except for mixed bromochlorocarbons emissions taken from Warwick et al. (2006). Since heteroge-neous reaction and chlorine activation are important for the depletion process of ozone, tropospheric and stratospheric aerosol formation is computed online using the submodel GMXe (Pringle et al., 2010) of EMAC. The setup has been adapted from RC1-aero-07 (Jöckel et al., 2016) with mod-ifications as described by Brühl et al. (2012, 2015). Radi-ation coupling had been activated in GMXe, but cloud cou-pling had not been activated. In this regard, an additional oceanic sulfur source, carbonyl sulfide (COS), which is a ma-jor source of stratospheric sulfur, has been included in ad-dition to dimethyl sulfide (DMS). Whereas the emission of the latter is computed from prescribed ocean concentrations, constant fluxes of COS have been adopted from Kettle et al. (2002). Additional reaction pathways of sulfur have been en-abled accordingly. RT1a and RT1b have been initialized with available monthly mean values from RC2-base-05. COS has been initialized from a simulation whose results have been published recently (Glatthor et al., 2015), including an ar-tificially increased oceanic source to close the atmospheric budget.
The model’s spatial resolution is T42L39MA for the sim-plified chemistry experiments, T42L47MA for RC2-base-05, and T42L90MA for RT1a/RT1b, respectively, correspond-ing to a 2.8◦×2.8◦ grid, with a top level at 0.01 hPa, and 39, 47, or 90 vertical hybrid-pressure levels. The mean trop-ical troposphere (below 100 hPa) is discretized into 16, 26, or 27 levels, and the mean tropical stratosphere between 100 and 1 hPa consists of 15, 15, or 48 levels, respectively. Emissions of GHG follow the RCP6.0 scenario and sea sur-face temperature (SST) and sea ice cover (SIC) are pre-scribed from Hadley Centre Global Environment Model ver-sion 2 (HadGEM2) forced with the RCP6.0 scenario for all simulations accordingly.
3 Long-term trends in oceanic emission fluxes
In this section, we investigate how a changing climate may influence emission fluxes of VSLS from the ocean. We will assess the impact of changing physical factors (e.g., SST, SIC, and wind speed) on ocean–atmosphere gas exchange driven by the RCP6.0 scenario. Here we assume constant oceanic concentrations of VSLS over the course of the cen-tury (following Ziska et al., 2013; Lennartz et al., 2015). This specific assumption might not hold since the effects of cli-mate change, e.g., increase of ocean temperature, acidifica-tion, change of salinity, and nutrient input, on marine organ-isms and thus the production of CH2Br2and CHBr3is not yet
fully understood. Recent combined marine ecosystem model studies imply a global decrease of net primary production by plankton over the course of the 21st century (Laufköt-ter et al., 2015, 2016). However, the impact on
bromocar--2 -1.5 -1 -0.5 0 0.5 1 1.5 2 2.5 3 1980 2000 2020 2040 2060 2080 2100 90° N–50° N 50° N–20° N 20° N–20° S 20° S–50° S 50° S–90° S
__: Nudged with ERA-Interim ---: Free simulation -4 -2 0 2 4 6 8 10 12 14 1980 2000 2020 2040 2060 2080 2100 90° N–50° N 50° N–20° N 20° N–20° S 20° S–50° S 50° S–90° S
__: Nudged with ERA-Interim ---: Free simulation
f
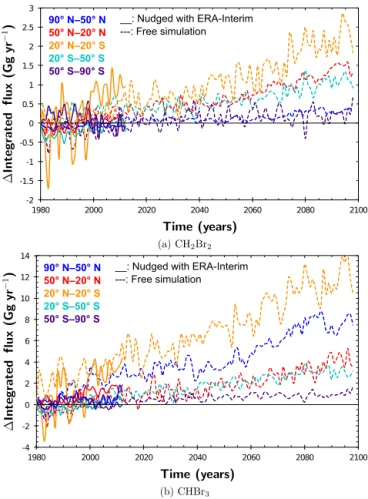
f
Figure 2. Difference of integrated flux separated in different zonal bands. Simplified chemistry EMAC simulation (SC_free and SC_nudged) with airsea gas exchange and water concentrations held constant. Solid lines represent ERA-Interim nudged (1979– 2012) and dashed lines free-running (1979–2100).
bon concentration, predominantly produced by macroalgae in coastal regions, remains unclear.
As implemented in the EMAC submodel airsea (Pozzer et al., 2006), the flux of a gas dissolved in ocean water to the atmosphere is governed by its concentration gradient 1c and transfer velocity k:
8 = k · 1c
=k · (cw−H · cair) , (1)
with k = (1/kw+R ·H ·Tair/kair)−1, wherein R is the
univer-sal gas constant and H is the Henry coefficient for a specific gas. The transfer velocity depends largely on air temperature Tairand surface wind speed, which is taken into account by
distinguishing between water- and air-side transport veloc-ities (kw, kair). kw is a polynomial function of wind speed
depending on the chosen parameterization as mentioned in Sect. 2. The corresponding water and atmospheric concen-trations are named cwand cair.
In Fig. 2, the difference of VSLS fluxes with respect to the start of the simulation in 1979 is shown for the
free-Table 2. Average absolute flux for the year 2000 in Gg yr−1and percentage of relative increase in VSLS flux between 2000 and 2100 from SC_free. The numbers have been obtained by linear regression of the data shown in Fig. 2 and evaluated at the given years.
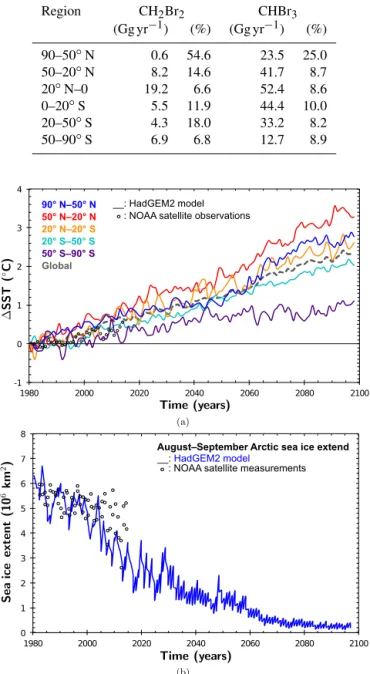
Region CH2Br2 CHBr3 (Gg yr−1) (%) (Gg yr−1) (%) 90–50◦N 0.6 54.6 23.5 25.0 50–20◦N 8.2 14.6 41.7 8.7 20◦N–0 19.2 6.6 52.4 8.6 0–20◦S 5.5 11.9 44.4 10.0 20–50◦S 4.3 18.0 33.2 8.2 50–90◦S 6.9 6.8 12.7 8.9 -1 0 1 2 3 4 1980 2000 2020 2040 2060 2080 2100 90° N–50° N 50° N–20° N 20° N–20° S 20° S–50° S 50° S–90° S Global __: HadGEM2 model : NOAA satellite observations
0 1 2 3 4 5 6 7 8 1980 2000 2020 2040 2060 2080 2100
: NOAA satellite measurements
August– September Arctic sea ice extend
__: HadGEM2 model
Figure 3. HadGEM2 prescribed ocean properties in the simplified chemistry simulations compared to National Oceanic and NOAA Optimum Interpolation (OI) V2 fields (Reynolds et al., 2002). (a) Change in sea surface temperature for different latitude bands. Global average is shown as dashed gray line. (b) Arctic sea ice ex-tend in August and September.
running and nudged simplified chemistry simulation. For both CH2Br2and CHBr3, all zonal bands display linearly
ris-ing fluxes. The strongest increase with respect to 1979 values is found in the tropical zone (20◦N–20◦S) with roughly 2.5 and 13 Gg yr−1 for CHBr3 and CH2Br2 respectively.
Rela-tive to the absolute value of the zonally averaged fluxes, this yields an increase of about 10 % over the course of the cen-tury (Table 2). The increase is slightly stronger in the south-ern tropics. The strongest relative increase in flux is found in the northern hemispheric polar region (90–50◦N), with 25 % and roughly 55 % for CHBr3and CH2Br2, respectively.
Regarding the changing physical factors, the HadGEM2 prescribed SSTs are increasing almost linearly over the course of the century (Fig. 3a). Under the RCP6.0 scenario, this increase in SST ranges between 1 and 3.5◦C. The weak rise in Antarctic SST is accompanied by a weakly increas-ing Antarctic flux of VSLS. The correspondincreas-ing HadGEM2 prognosticated retreat of Arctic sea ice is shown in Fig. 3b. Sea ice is not regarded as a source of VSLS in our study and therefore only acts as a lid blocking the ocean-to-atmosphere flux. Since the water concentrations from Ziska et al. (2013) used in our simulations do not take SIC into account, water concentrations have been extrapolated for regions typically covered by ice at present. In the airsea submodel, if SIC (fraction of grid box) is larger than 0.5, the transfer veloc-ity (kw) is equal to zero, in other cases kwis scaled
depend-ing on the fraction of SIC. Hence, a polar sea which is to a large extent free of sea ice has increased fluxes of VSLS in our future simulations. However, there are large uncertain-ties regarding the VSLS water concentrations in the future polar sea, for the polar ecosystem as a whole is undergo-ing a drastic change. In accordance to the general increase in flux, the Arctic August–September maximum of flux is ex-pected to be more pronounced. In both hemispheres, seasonal cycles in zonally averaged VSLS fluxes peak in the summer months and show minima in late winter. There is a slightly stronger increase of fluxes in the future during the time pe-riods of maxima but no change in phase. Negative emissions representing a net sink of atmospheric CH2Br2 are found
during winter at high latitudes in the Northern Hemisphere. In the northern tropics, CHBr3 shows a distinct maximum
in northern hemispheric summer, while the southern tropics do not display any seasonal cycle. Despite increased ocean– atmosphere fluxes in the future, only taking the changes of physical factors into account, seasonal cycles remain largely the same. In our simulations, zonally averaged absolute wind speed at 10 m is only slightly changing over the course of the 21st century and with varying sign (−4–2 %). Thus, it is in-dicated by our simulations but not explicitly shown that the important factor regarding an increase of ocean–atmosphere flux of VSLS is the change in SSTs.
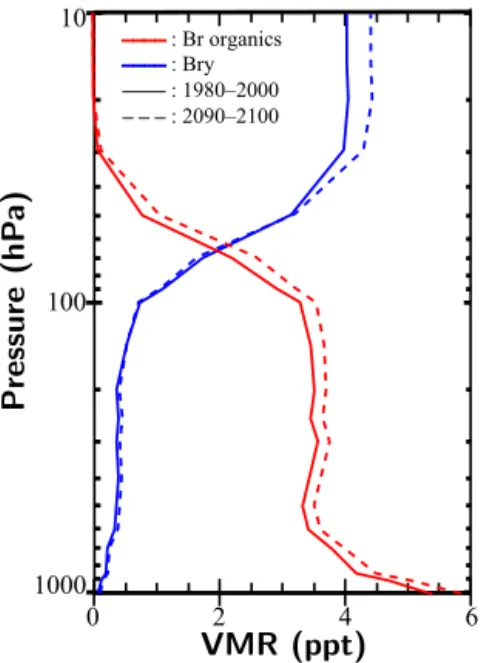
In Fig. 4, resulting VMR profiles of organic (Brorg) and
inorganic bromine (Bry) from VSLS are shown. VSLS data
have been averaged over a time period 1990–2000 and 2090– 2100. The VMR profile of Brorgdisplays a steep decline in
the lower troposphere (400–1000 hPa) by more than 50 % of ground level VMR and stays almost constant before entering the stratosphere, where VSLS are quickly dissociated. Com-paring present-day and future values (keeping in mind that OH concentrations are nudged towards monthly mean
val-____: Br organics ____: Bry _ _ _: 1980– 2000 ____ : 2090– 2100 10 100 1000 0 2 4 6
Figure 4. Tropical zonal mean (20◦N–20◦S), temporally averaged, vertical profiles of organic (Brorg) and inorganic bromine (Bry) for
the time periods 1990–2000 and 2090–2100 from SC_free. In con-sistency with increasing VSLS fluxes by 10 % in the tropics, an in-crease of roughly 10 % in Bry from VSLS in the stratosphere is
found, while the increase in Brorgamounts to 8 %.
ues of OH and photolysis rates are fixed in SC_free), Brorgis
found to have increased throughout the atmosphere by about 0.1–0.4 ppt. Surface values of VSLS increase by 0.47 ppt (9 %), while in the lower stratosphere the increase amounts to 0.3 ppt (8 %). VMR of Bryis increased from the lower
strato-sphere upwards by roughly 0.4 ppt (10 %). These changes in the vertical profiles can be attributed to enhanced emissions in a future climate which, as shown, are of the order of 10 % in the tropics.
As can be inferred from Eq. (1), ocean–atmosphere fluxes are sensitive to the abundance of VSLS in the atmosphere and differing wind speed parameterization. An increased chemical dissociation of VSLS in the lowermost troposphere (e.g., due to a probable future increase in OH) would re-duce the atmospheric concentration and therefore increase the flux from the ocean to the atmosphere without necessar-ily increasing the actual amount of bromine which is trans-ported to the stratosphere. The total amount of bromine from VSLS transported through the UTLS strongly depends on the washout of inorganic PG (BrVSLSy ) and hence on the parti-tioning and heterogeneous reactions converting BrVSLSy be-tween soluble, e.g., HBr and HOBr, and insoluble, e.g., BrO, species (e.g., Aschmann et al., 2009; Liang et al., 2014). Since OH concentrations in the lower troposphere have been set to zero in SC_free, the atmospheric lifetime and the re-sulting abundance of VSLS in the lower troposphere is en-hanced. Therefore, the total ocean–atmosphere flux is sup-pressed. In this regard, fluxes from RT1a at the end of the
21st century have been compared to SC_free within the same time period. Much stronger fluxes (1.3–1.5 times) have been found in RT1a in comparison to SC_free. Particularly, no net sink for CH2Br2occurs at high latitudes in RT1a. This
partly explains the smaller increase in comparison to results recently published by Ziska et al. (2017). Ziska et al. (2017) diagnosed the flux from parameters such as SST and wind speed for a fixed VSLS concentration gradient and for dif-ferent CMIP5 model simulations. They found an increase in flux of CHBr3/CH2Br2of 29.4/23.3 % for the RCP8.0
sce-nario and 9.0/6.4 % for RCP2.6, respectively. In addition to the smaller absolute fluxes due to the artificial suppression caused by setting OH to zero in the lower troposphere, we expect a smaller increase in flux from a theoretical point, taking Eq. (1) in to account, since we allow atmospheric con-centrations to respond to changing flux. Underlying changes in photochemical dissociation and tracer transport due to a changing climate have not been disentangled at this point and will be studied in detail in the following section.
4 Stratospheric bromine loading
In addition to the possible increase in oceanic VSLS emis-sions due to climate change, discussed in the previous sec-tion, atmospheric transport and chemical transformation pro-cesses are also sensitive to climate change and may con-tribute to a change in the future stratospheric bromine load-ing from VSLS. These aspects will be studied in this sec-tion, based on the RC2-base-05 ESCiMo simulasec-tion, span-ning 150 years from 1950 to 2100, assuming constant VSLS fluxes. Hence the fluxes of VSLS do not response to changes in the ground level abundances of VSLS.
In Fig. 5, profiles of brominated substances are shown for the tropics. The profiles are weighted by the amount of bromine atoms per molecule. The whole 150-year data set has been smoothed using a moving average with a box win-dow size of 11 years to account for, e.g., seasonal variations and the solar cycle. From these smoothed data, three refer-ence years have been chosen for the analysis: 1980, 2016, and 2100. Therefore, 2100 is referring to June of the last valid year of the smoothed data (2094). To guide the eye, the cor-responding mean tropical tropopause heights from the model output are shown together with the profiles. There is an up-ward shift of the tropopause height of about 8 hPa between present day and future. An upward shift of VSLS VMR pro-files in 2100 in comparison to past/present-day propro-files is also visible. In the RCP6.0 scenario, ground level VMR of CH3Br and VSLS are constant from 2016 onward. In case of
CH3Br, this roughly amounts to 1980 values. For all years,
we find a fast decrease of VSLS of 5 ppt with a standard de-viation of 0.25 ppt (or about 50 % compared to ground level VMR) between the surface and the mid-troposphere at about 500 hPa. The comparison of the difference of profiles be-tween future and past/present (Fig. 5a, lower panel) reveals
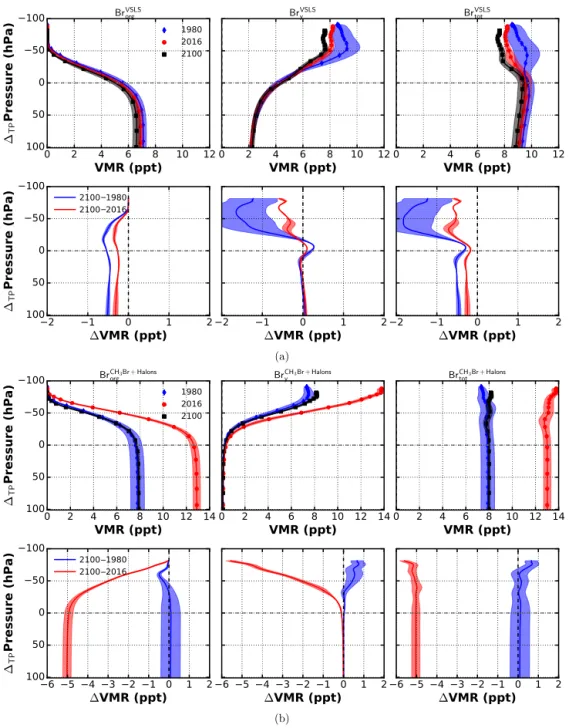
Figure 5. Vertical profiles of brominated substances divided into SG (Brorg), PG (Bry), and SG + PG (Brtot) in the tropics (20◦N–20◦S).
Data from ESCiMo RC2-base-05 simulation (Jöckel et al., 2016). Absolute values of VMR in upper panel, difference 1VMR with respect to 2100 values in lower panel. (a) Bromine from VSLS; (b) bromine from CH3Br and halons.
decreasing bromine values from VSLS by about 0.1–0.8 ppt throughout the troposphere, while there is an increase of the same order of magnitude in the lower stratosphere. Similar results have been published for RCP4.5 and RCP8.5 scenar-ios, attributing these to changes in the tropospheric circula-tion and to the primary oxidant OH (Hossaini et al., 2012). The amount of inorganic PG from VSLS (BrVSLSy ) in the UTLS is decreasing by the same order of magnitude due to the enhanced upwelling in the tropics. As air in the UTLS
be-comes younger in a future climate, less SG (BrVSLSorg ) will be dissociated into PG (BrVSLSy ) compared to present day. For 2016, this decline is compatible with a decreasing amount of VSLS in the troposphere. A slight excess of BrVSLSy in the stratosphere is found for 1980 in comparison to 2016 and 2100. This excess and the strong variability (denoted by the shown standard deviation) can be attributed to the hind-cast period (1950–2005) of the simulation including volcanic eruptions. Large volcanic eruptions can influence the
trans-port of bromine from VSLS into the stratosphere which may be related to a similar effect as seen in stratospheric water vapor (Löffler et al., 2016). Since volcanic activity has not been included in the future scenario, there is no such impact on BrVSLSy from 2005 onward.
The largest change between present and future stems from the estimated decrease of long-lived SG, in particular halons and CH3Br. At present, halons contribute about 6–7 ppt to the
total bromine loading of the lower stratosphere (∼ 23 ppt),
which is about the same amount as VSLS and CH3Br in
RC2-base-05, whereas by the end of the century their contri-bution is reduced significantly to 1–2 ppt of total bromine (∼ 17 ppt). This decline in long-lived, anthropogenically emitted SG is altering the amount of bromine released in the strato-sphere on longer timescales. VSLS are already reduced due to photochemical dissociation when entering the TTL, while halons are dissociating more slowly, providing a long lasting source of bromine to the stratosphere (Fig. 5b, lower panel). It is important to note that although there is an increase of BrVSLSorg of 0.5 ppt in the stratosphere assuming constant ocean–atmosphere fluxes, the overall amount of bromine in the stratosphere due to VSLS (BrVSLStot ) might be decreas-ing in the future. This depends on whether PG (BrVSLSy ) are transported alongside the VSLS into the UTLS or removed through washout in the troposphere. The model representa-tions of underlying processes, e.g., conversion between solu-ble and insolusolu-ble inorganic bromine species through hetero-geneous chemical reactions, are still uncertain.
In the following, we will derive a semi-analytic model to separate various aspects affecting the future VSLS distribu-tion in the atmosphere (Sect. 4.1). Since the atmospheric win-dow for air entering the stratosphere is located in the tropics, we will focus on averaged tropical atmospheric quantities. Subsequently, the transition between troposphere and strato-sphere caused by a rising tropopause is influencing the in-terpretation of VMR profile differences between present and future. This will be discussed in Sect. 4.2.
4.1 Quantification of future atmospheric changes affecting VSLS mixing ratio profiles
The increase of VSLS in the stratosphere in the future can be attributed to changes in chemical and photolytical disso-ciation rates and alternating transport from source regions through the TTL caused by a speed-up of the Brewer– Dobson circulation (BDC) (Hossaini et al., 2012). All of these factors influence the lifetime of VSLS in the atmo-sphere. A volume of air in a certain height (or rather pressure coordinate) shall have an associated mean temperature T , OH concentration [OH], photolysis frequency J , and age of air (AOA). In the model, VSLS are dissociated photochemi-cally via CH2Br2+OH → 2Br + H2O, (R1) CHBr3+OH → 3Br + H2O, (R2) and CH2Br2+hν →2Br + products, (R3) CHBr3+hν →3Br + products. (R4)
The simplification in these equations compared to reality is justified since the intermediate reaction products CBr2O and
CHBrO insignificantly amount to the total bromine PG (Hos-saini et al., 2010). From the resulting first-order differential equation
d[A]
dt = −kA(T ) · [OH] · [A] − JA· [A], (2)
with [A] any of the VSLS species concentration, kA(T )the
temperature dependent rate coefficient, JAthe photolysis
fre-quency (Sander et al., 2011b), and assuming [OH] is un-changed by the reaction, a simple solution of Eq. (2) is de-rived:
[A](t ) = exp (−(kA(T ) · [OH] + JA) · (t − t0)) · [A]0. (3)
Based on the above equation, the influence of [OH], temper-ature, transport, and photolysis rate can be studied. For in-ferring the change in chemical dissociation, 10-year average profiles of [OH] and 1-year average profiles of temperature have been computed from RC2-base-05 data for the present day (2016) and future (2100). The idea is to assess the effect of transport timescales (t0→t) by using 10-year averages
of mean AOA from RC2-base-05 data (neglecting the age spectrum in the described volume of air). AOA shall refer to the time since an air parcel has been in contact with ground level. It has been evaluated in the EMAC simulation from an artificial, passive tracer with linearly increasing emission. Photolysis frequencies have been computed from averaged tropical profiles of temperature, humidity, and ozone column using the column version of jval (Sander et al., 2014) from EMAC. In case of photolysis frequencies, temperature de-pendence will not be discussed separately.
In Fig. 6a, averaged profiles of temperature, AOA, and [OH] are shown. Mean tropospheric temperatures are higher, while stratospheric temperatures are lower in the future, which is in line with other studies (e.g., IPCC – Intergov-ernmental Panel on Climate Change, 2013, Chap. 12, Global Ozone Research and Monitoring Project, 2014, Chap. 2). The concentration of OH is increased throughout the atmosphere, apart from the lowermost levels. AOA will become notably younger within the stratosphere by the end of the century, as shown in various other studies (Austin et al., 2007, 2013; Butchart et al., 2006; Li et al., 2008; Muthers et al., 2016) and become slightly older (by a few days) in the troposphere. Vertical profiles of the CHBr3lifetime for present and future
are shown in Fig. 6b. Because of an increase in photolysis rates due to increasing temperatures, the CHBr3 lifetime is
decreasing. CH2Br2is not shown, since its lifetime with
re-spect to photolysis is almost infinite in the troposphere and thus determined by reaction with OH.
0 10 20 30 40 50 60 70 A (days) 10 20 50 100 200 500 1000 Pressure (hPa) 2000 2100 5 10 15 20 25 30 Altitude (km)
-Figure 6. Tropical average profiles from ESCiMo RC2-base-05 simulation of changing variables in Eq. (3) for present day (solid lines) and future (dashed lines). (a) Temperature, OH concentration, and age of air; (b) lifetime of CHBr3.
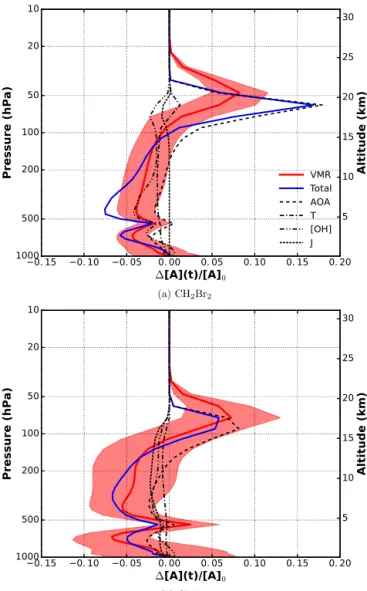
By varying the variables in Eq. (3) one by one, the impact of each on the resulting profile difference (1[A](t )/[A]0) has
been calculated (Fig. 7). The increase of [OH] in the RCP6.0 scenario results in a general decreasing VMR of VSLS in the troposphere and lower stratosphere. The influence is highest at 500 hPa and around the tropopause. CH2Br2 is affected
more strongly by a change of [OH] due to chemical destruc-tion (∼ 5 %) than CHBr3(∼ 2 %). The change in mean
tem-peratures causes a tropospheric VMR decrease by at most 2 %. In the stratosphere, decreasing temperatures increase 1[A](t )/[A]0by about 1 %. An increased AOA in the
tro-posphere is reflected by a decreasing 1[A](t )/[A]0(∼ 2 %),
while the opposite is true for the juvenescence of air in the stratosphere (8–18 %). For CH2Br2, the impact of AOA is
apparently overestimated in the lower stratosphere by this ansatz, which might be because of the neglected AOA spec-trum representing a mixing of different air masses. Since the photolytical lifetime of CH2Br2in the troposphere is infinite,
it has no influence on the tropospheric part of the profile.
Figure 7. Relative difference of VSLS vertical profiles for 2000 and 2100. Major influences on lifetime have been separated. Shown are resulting profiles by varying the denoted variables, mean tempera-ture T , OH concentration [OH], photolysis frequency J , and age of air (AOA), in Eq. (3) one by one.
A weak decrease on the order of 1–2 % is apparent in the lower stratosphere. This has been found to be mainly driven by temperature sensitivity of photolysis. In case of CHBr3,
a 1–2 % decrease due to changing photolysis is found in the free and upper troposphere. This change in photolysis rate is mainly due to changes in tropical ozone abundance.
If all occurring changes are included, the actual profile dif-ferences between future and present are rather well repro-duced (shown in red). These VMR profiles are 10-year aver-ages for the tropics. The corresponding standard deviation is plotted as shaded error band. The decreasing VMR of VSLS in the troposphere is on the order of 5–7 % (at about 250 hPa) for CH2Br2and CHBr3, respectively. In the stratosphere, the
Moving average (11 a) Linear fit
Mean tropopause Standard deviation
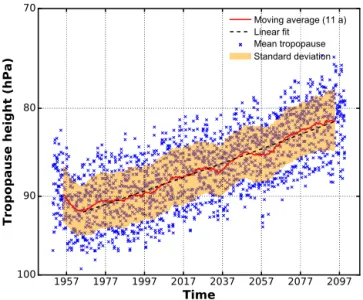
Figure 8. Model mean tropical tropopause from RC2-base-05 over a timespan of 150 years. Tropopause data have been evaluated after the apparent spinup of about 10 years. A rise of the mean tropical tropopause of (0.81 ± 0.01) hPa decade−1is found by linear regres-sion.
maximum increase, dependent on species, occurs at differing pressure levels and amounts to 7–8 %.
In summary, all occurring future changes are decreasing VMR of VSLS in the troposphere. In case of CHBr3, all
fac-tors are of the same order of magnitude. The tropospheric decrease of CH2Br2 VMR is mainly driven by increasing
[OH]. In the upper troposphere–lower stratosphere (UTLS), the impact of the juvenescence of AOA dominates, causing an increase in VMR.
4.2 Implications of a rising tropopause on VSLS mixing ratio profiles
The GHG induced warming of the troposphere and cooling of the stratosphere causes a rise of the tropopause. Model mean tropical tropopause heights from RC2-base-05 have been smoothed using a moving average with a box window size of 11 years. The corresponding standard deviation is dis-played as yellow band in Fig. 8. A linear regression fit on the smoothed model mean tropical tropopause height yields a rise of (0.81 ± 0.01) hPa decade−1. This is in accordance with results from ECMWF reanalysis data for the past 2 decades (Wilcox et al., 2012). As indicated by Oberländer-Hayn et al. (2016) regarding the BDC, the upward shift of the tropopause affects the interpretation of vertical profile differ-ences between future and past. An air parcel which would have already entered the stratosphere under present-day con-ditions may be still considered tropospheric in the future. As pointed out earlier, profiles appear shifted by a fraction of distance between two pressure coordinate levels. We per-form a spline fit to the averaged profiles and shift them
ac-cordingly with respect to the mean tropopause. The fit re-sults have been evaluated within a valid region of ±100 hPa around the tropopause. The results are shown in Fig. 9. Un-certainty bands have been estimated by adding or subtract-ing 1 standard deviation from the averaged VMR profiles and computing the corresponding splines. With respect to the mean tropopause, VMR differences show no increase of bromine from VSLS in the lower stratosphere but rather a slight decrease (Fig. 9a). A small increase of inorganic bromine from VSLS (BrVSLSy ) is found in the tropopause re-gion. At about 20 hPa, BrVSLSy is reduced by 1–2 ppt in the future compared to 1980. Overall, a reduction of bromine in the UTLS is found at the end of the 21st century. In Fig. 9b, the amount of bromine from CH3Br and halons is shown.
Except for a slight increase of BrCH3Br+halons
tot in the upper
stratosphere between 1980 and 2100 of about 0.7 ppt, there is no increase of bromine from long-lived SG.
To summarize, the increase of lower-stratospheric VSLS in RC2-base-05 of about 5–10 % is due to enhanced verti-cal transport in the tropics. This increase is, however, coun-teracted by a corresponding decrease in inorganic bromine. Everything else unchanged, an increase in tropical upwelling will therefore not change the total amount of bromine in the future stratosphere. Additionally, due to enhanced future OH concentrations in RCP6.0, the tropospheric lifetime of VSLS is reduced which leads to a decrease of total bromine from VSLS. As mentioned in Sect. 3, whether the amount of inor-ganic PG in the UTLS is decreasing or not, strongly depends on the partitioning of Bryand conversion of soluble HBr and
HOBr into insoluble BrO through heterogeneous recycling, e.g., occurring on sea-salt aerosols or ice crystals. In case in-soluble species are favored, vertical transport would enhance the amount of PG in the UTLS. Otherwise, wet removal in the troposphere would decrease the amount of PG. This mechanism has not been explicitly tested in our model sim-ulations. Taken an upward shift of the tropopause into con-sideration and shifting the VMR profiles accordingly with respect to the mean tropical tropopause height, a decrease of BrVSLStot by 0.5–2 ppt is found for a fixed 1TPP ≈20 hPa.
5 Implications on ozone depletion
In this section, the influence of brominated very short-lived source gases on ozone depletion will be discussed. Based on RT1a and RT1b, we assess the impact of VSLS on a zon-ally averaged ozone distribution at the end of the 21st cen-tury. For a thorough discussion of future trends, the 25-year data set is too short. However, from our long-term simula-tions (SC_free, SC_nudged, RC2-base-05), long-term influ-ence of emission perturbations on ozone is not assessable. As described in Sect. 2, SC_free does not include inter-active ozone chemistry, whereas RC2-base-05 incorporates prescribed fluxes based on scenario five by Warwick et al. (2006). Furthermore, results from RC2-base-05 cannot be
Figure 9. Spline fitted vertical profiles of brominated substances divided into SG (Brorg), PG (Bry), and SG + PG (Brtot) in the tropics
(20◦N–20◦S) with respect to the mean tropical tropopause. Data from ESCiMo RC2-base-05 simulation (Jöckel et al., 2016). Absolute values of VMR are in the upper panel and the difference 1VMR with respect to 2100 values in the lower panel. (a) Bromine from VSLS; (b) bromine from CH3Br and halons.
compared to RT1a and RT1b directly because of significant differences in ozone distribution and amount between the differing vertical resolutions (L47MA and L90MA) of the model. This issue has been already reported by Jöckel et al. (2016).
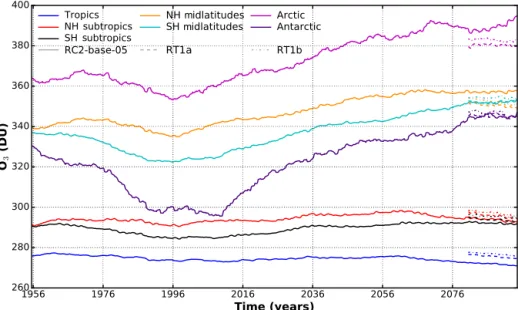
Zonally averaged data of total column ozone have been smoothed using a moving average algorithm with box win-dow size of 11 years (Fig. 10). In general, ozone trends at the end of the century are roughly the same for both resolutions.
The actual amount of ozone differs, with L90 showing more ozone except for the northern hemispheric polar region and midlatitudes. In the Arctic, RT1a and RT1b even indicate, in contrast to RC2-base-05, slightly decreasing total column ozone. In the case of RT1a and RT1b, this might be partially caused by interactive aerosol and accordingly added oceanic COS source. This bias in total column ozone between the ver-tical resolutions is larger than the difference between RT1a and RT1b.
m m
Figure 10. Zonal mean ozone trend from RC2-base-05 (1950–2100) and RT1a/RT1b (2080–2100). Smoothed with moving average box window 11 years.
Figure 11. Ozone reduction due to VSLS. Medium-term full-chemistry future simulation with and without VSLS. Zonal mean profile of decadal mean difference in percent ((RT1a − RT1b)/RT1a × 100). Dashed lines indicate a decrease of ozone in the simulation with VSLS turned on (RT1a) compared to the one with VSLS turned off (RT1b). The average tropopause is shown as red line. Significance is indicated by blue shaded areas. The significance is estimated as manifold of difference from zero in units of standard error of mean difference.
For estimating the effect of brominated VSLS on ozone depletion, the difference in zonally averaged ozone of RT1a and RT1b has been computed. A period of 20 years (2080– 2100) has been used accounting for an estimated model spinup of 5 years in the beginning. In Fig. 11, the relative difference ((RT1a − RT1b)/RT1a × 100) is shown as contour
plot. Dashed lines indicate a decrease of ozone in the sim-ulation with VSLS turned on (RT1a) compared to the one with VSLS turned off (RT1b), while solid lines indicate an increase. Significance has been estimated as divergence from zero in units of standard error of mean. It is indicated by shades of blue. VSLS cause a tropospheric ozone reduction
on the order of 1–2 %, mainly at high latitudes. The UTLS region in the tropics is most affected; there VSLS cause a de-crease of ozone of about 3 %. The dede-crease of ozone in the high latitude troposphere and tropical UTLS is rendered sig-nificant. Increasing amounts of ozone (∼ 1 %) are found in the Antarctic middle and upper stratosphere, but these are mainly not significant. This increase in ozone abundance may be due to dynamical feedback (Braesicke et al., 2013).
While VSLS have a large impact on Antarctic ozone de-pletion during the ozone hole period, i.e., during times with high-stratospheric chlorine loading from about the late 1970s to the second half of the 21st century (e.g., Fernandez et al., 2017; Oman et al., 2016; Sinnhuber and Meul, 2015; Yang et al., 2014), we find that by the end of the 21st century VSLS have less impact on total Antarctic stratospheric ozone deple-tion under low chlorine loading, although their importance relative to the total stratospheric halogen load is increasing (about 40 % in accordance to Fernandez et al., 2017). As-suming an adherence to the Montreal Protocol, stratospheric volume mixing ratios of Clywill decrease exponentially in
the course of the 21st century from its peak values in 2000. From the Global Ozone Research and Monitoring Project (2014, Chap. 2, Figs. 2–21), a decline of Clyloading at 1 hPa
of about 2 ppbv between 2000 and 2080 can be deduced. In accordance, we find a reduction of zonally averaged strato-spheric Cly at 1 hPa of 2.1 ppb by the end of the 21st
cen-tury compared to year 2000 in RC2-base-05. Since RT1a and RT1b have identical chlorine load and do not include present day, we cannot assess the chlorine moderation ef-fect from these two simulations. Sinnhuber and Meul (2015) have shown a reduction of ozone due to VSLS in the TTL region on the order of 6 % during the period 1970–1982 with significantly less stratospheric chlorine compared to the later period 1983–2005 (7 %), while Hossaini et al. (Supplement 2015, Fig. S3) have shown a change of total ozone column due to VSLS (on/off scenario) of the order of 1–3 % in pre-industrial conditions. Given that the VSLS emission scenario five of Warwick et al. (2006) used in RC2-base-05 has about twice the amount of VSLS compared to RT1a and chlorine abundance in the stratosphere will drop to 1970 values by the end of the 21st century (see IPCC – Intergovernmental Panel on Climate Change, 2013, Chap. 12), our results are in good agreement with these previous studies. In more de-tail, Yang et al. (2014) investigated the combined influence of brominated VSLS and chlorine on ozone. For two strato-spheric Clyloadings (3, 0.8 ppb), which correspond to 2000
and 2100, they have varied the amount of VSLS. Yang et al. (2014) have shown the more chlorine in the stratosphere the stronger ozone is affected by an increase of bromine VMR from VSLS. In concert with our results, although by doubling the initial amount of VSLS on a varying bromine background from anthropogenic sources, they have found a significant decrease of ozone in the tropical UTLS and polar region on the order of 2–4 % and slight, insignificant increases in the Antarctic mid-stratosphere (Yang et al., 2014, Fig. 1e).
6 Conclusions
We have investigated long-term changes in emission and transport of brominated VSLS under a changing climate (RCP6.0). Under the implicit assumption of constant con-centrations of VSLS in the ocean waters, over a timespan of 120 years, we have found an enhancement of zonally aver-aged fluxes of CH2Br2and CHBr3on the order of 10 %
be-tween present day and the end of the 21st century. A strong increase of flux (up to 55 % in CH2Br2and 25 % in CHBr3)
has been found in the northern hemispheric polar region. There, the retreat of sea ice is playing a key role. Exposing almost the entire polar ocean in August–September by the end of the 21st century, sea ice does not longer act as a lid to ocean–atmosphere fluxes of VSLS. Sea ice itself has not been considered a source of VSLS in our simulations. Subse-quently, an increase of organic bromine in the UTLS is found of the same order of magnitude (8–10 %).
Ocean–atmosphere fluxes are sensitive to the abundance of VSLS in the atmosphere as well as on wind speed. An in-creased dissociation of VSLS in the lowermost troposphere, e.g., due to increasing OH concentrations in the RCP6.0 sce-nario, reduces the atmospheric concentration and therefore increases the flux from the ocean to the atmosphere with-out necessarily increasing the actual amount which is trans-ported to the stratosphere. The total amount of bromine from VSLS transported through the UTLS strongly depends on the washout of inorganic PG (BrVSLSy ) and hence on the parti-tioning and heterogeneous reactions converting BrVSLSy be-tween soluble (e.g., HBr, HOBr) and insoluble (e.g., BrO) species. But these mechanisms have not been subject to our study.
For prescribed, constant VSLS fluxes, an increase of lower-stratospheric VSLS of about 5–10 % is due to en-hanced vertical transport in the tropics. This increase is coun-teracted by a corresponding decrease in inorganic bromine. Everything else unchanged, an increase in tropical upwelling will not change the total amount of bromine in the fu-ture stratosphere. Additionally, due to enhanced fufu-ture OH concentrations in the RCP6.0 emission scenario, the tropo-spheric lifetime of VSLS is reduced, which leads to a de-crease of total bromine from VSLS. Furthermore, we have diagnosed a decrease of BrVSLStot by 0.5–2 ppt for a fixed pressure level with respect to the mean tropical tropopause 1TPP ≈20 hPa, if the upward shift of the mean tropical
tropopause of 0.81 hPa decade−1is taken into consideration. The impact of enhanced fluxes of brominated VSLS on future ozone abundance has been evaluated by comparing two experiments of which one has no VSLS emission and the other interactively computed fluxes from constant ocean concentrations of VSLS. We have found a significant reduc-tion of ozone in the tropical UTLS of about 3 %. In the tro-posphere the largest significant decrease of ozone amounts to 1–2 %. Thus, bromine from VSLS may not act as a
ma-jor source to future stratospheric ozone depletion. While in-teractive emissions from constant ocean concentrations have been taken into consideration, the actual climate change in-flicted change in the production of VSLS by macroalgae in the ocean remains an open question. Whether the found in-crease of ocean–atmosphere fluxes of VSLS and a future de-crease of VSLS in the troposphere will cancel out or over-compensate would need further simulation studies.
Code availability. The Modular Earth Submodel System (MESSy) is continuously further developed and applied by a consortium of institutions. The usage of MESSy and access to the source code is licensed to all affiliates of institutions, which are members of the MESSy Consortium. Institutions can become a member of the MESSy Consortium by signing the MESSy Memorandum of Un-derstanding. More information can be found on the MESSy Con-sortium website (http://www.messy-interface.org).
Data availability. The data of the ESCiMo simulations will be made available in the Climate and Environmental Retrieval and Archive (CERA) database at the German Climate Computing Centre (DKRZ; http://cera-www.dkrz.de/WDCC/ui/Index.jsp). The corresponding digital object identifiers (doi) will be published on the MESSy Consortium web page (http://www.messy-interface. org). A subset of the data of those simulations covering consistently the requested time periods (1960–2010 for RC1 and 1960–2099 for RC2) will be submitted to the BADC database for the CCMI project. Data from ROMIC-THREAT associated simulations (RT1a, RT1b) and simplified chemistry (SC_free, SC_nudged) will be made available on request.
Author contributions. SF performed most of the analyses and wrote the paper. BMS conceived this study and provided advice through discussion of the analysis and results. GK developed and performed the simplified chemistry simulations as well as part of the cor-responding data analysis in Sect. 3. STL provided advise on the ocean–atmosphere gas exchange. PJ provided advice as project leader of the ESCiMo consortial project and coordinator of over-all EMAC model development; preparation of the ESCiMo model setups and realization of the ESCiMo simulations of ESCiMo Con-sortium, with VSLS boundary conditions and implementation of the online Br budget diagnostics for EMAC prepared by PG. All coau-thors contributed to the discussion of the results.
Competing interests. The authors declare that they have no conflict of interest.
Special issue statement. This article is part of the special issue “The Modular Earth Submodel System (MESSy) (ACP/GMD inter-journal SI)”. It is not associated with a conference.
Acknowledgements. Parts of this work were supported by the Deutsche Forschungsgemeinschaft (DFG) through the research unit SHARP (SI1044/1-2), the German Bundesministerium für Bildung und Forschung (BMBF) through the project ROMIC-THREAT (01GL1217B), the European Union through the Horizon 2020 project GAIA-CLIM, and by the Helmholtz Association through its research program ATMO.
The CNRM data were produced in the framework of the CCMI project, with support of Météo-France. We particularly acknowl-edge the support of M. Michou and D. Saint-Martin and of the entire team in charge of the CNRM/CERFACS climate model.
NOAA Optimum Interpolation (OI) V2 fields were provided by the National Centers for Environmental Prediction/National Weather Service/NOAA/US Department of Commerce, and Na-tional Climatic Data Center/NESDIS/NOAA/US Department of Commerce research Data Archive at the National Center for At-mospheric Research, Computational and Information Systems Lab-oratory. http://rda.ucar.edu/datasets/ds277.0/. Accessed 6 January 2016).
The ESCiMo (Earth System Chemistry integrated Modelling) model simulations have been performed at the German Climate Computing Centre (DKRZ) through support from the BMBF. DKRZ and its scientific steering committee are gratefully acknowl-edged for providing the HPC and data archiving resources for this consortial project.
EMAC simulations RT1a and b have been performed at Stein-buch Center for Computing at KIT. Thanks to Stefan Versick and Oliver Kirner (KIT SimLab Climate and Environment) for their technical support.
Special thanks to C. Brühl (MPI-Mainz) for his help in imple-menting additional sulfur reactions and usage of gmxe in context of the ROMIC-THREAT simulations.
S. Lennartz likes to thank B. Quack, C. Marandino, S. Tegtmeier (all Helmholtz-Centre for Ocean Research Kiel), and K. Krüger (University of Oslo) for their support.
The article processing charges for this open-access publication were covered by a Research
Centre of the Helmholtz Association. Edited by: Michel Van Roozendael Reviewed by: two anonymous referees
References
Aschmann, J., Sinnhuber, B.-M., Atlas, E. L., and Schauffler, S. M.: Modeling the transport of very short-lived substances into the tropical upper troposphere and lower stratosphere, Atmos. Chem. Phys., 9, 9237–9247, https://doi.org/10.5194/acp-9-9237-2009, 2009.
Austin, J., Wilson, J., Li, F., and Vomel, H.: Evolution of wa-ter vapor concentrations and stratospheric age of air in coupled chemistry-climate model simulations, J. Atmos. Sci., 64, 905– 921, https://doi.org/10.1175/JAS3866.1, 2007.
Austin, J., Horowitz, L. W., Schwarzkopf, M. D., Wilson, R. J., and Levy, H.: Stratospheric ozone and temperature simulated from the preindustrial era to the present day, J. Climate, 26, 3528– 3543, https://doi.org/10.1175/JCLI-D-12-00162.1, 2013.
Braesicke, P., Keeble, J., Yang, X., Stiller, G., Kellmann, S., Abraham, N. L., Archibald, A., Telford, P., and Pyle, J. A.: Circulation anomalies in the Southern Hemisphere and ozone changes, Atmos. Chem. Phys., 13, 10677–10688, https://doi.org/10.5194/acp-13-10677-2013, 2013.
Brühl, C., Lelieveld, J., Crutzen, P. J., and Tost, H.: The role of carbonyl sulphide as a source of stratospheric sulphate aerosol and its impact on climate, Atmos. Chem. Phys., 12, 1239–1253, https://doi.org/10.5194/acp-12-1239-2012, 2012.
Brühl, C., Lelieveld, J., Tost, H., Höpfner, M., and Glatthor, N.: Stratospheric sulfur and its implications for radiative forcing simulated by the chemistry climate model EMAC, J. Geophys. Res.-Atmos., 120, 2103–2118, https://doi.org/10.1002/2014JD022430, 2015.
Butchart, N., Scaife, A. A., Bourqui, M., de Grandpre, J., Hare, S. H. E., Kettleborough, J., Langematz, U., Manzini, E., Sassi, F., Shibata, K., Shindell, D., and Sigmond, M.: Simulations of anthropogenic change in the strength of the Brewer-Dobson circulation, Clim. Dynam., 27, 727–741, https://doi.org/10.1007/s00382-006-0162-4, 2006.
Fernandez, R. P., Kinnison, D. E., Lamarque, J.-F., Tilmes, S., and Saiz-Lopez, A.: Impact of biogenic very short-lived bromine on the Antarctic ozone hole during the 21st century, Atmos. Chem. Phys., 17, 1673–1688, https://doi.org/10.5194/acp-17-1673-2017, 2017.
Fujino, J., Nair, R., Kainuma, M., Masui, T., and Matsuoka, Y.: Multi-gas mitigation analysis on stabilization scenarios using aim global model, Energ. J., 343–353, 2006.
Glatthor, N., Höpfner, M., Baker, I. T., Berry, J., Camp-bell, J. E., Kawa, S. R., Krysztofiak, G., Leyser, A., Sinnhu-ber, B.-M., Stiller, G. P., Stinecipher, J., and von Clar-mann, T.: Tropical sources and sinks of carbonyl sulfide observed from space, Geophys. Res. Lett., 2015GL066293, https://doi.org/10.1002/2015GL066293, 2015.
Global Ozone Research and Monitoring Project: Scientific Assess-ment of Ozone Depletion: 2010, 2011.
Global Ozone Research and Monitoring Project: Scientific Assess-ment of Ozone Depletion: 2014, 2014.
Hijioka, Y., Matsuoka, Y., Nishimoto, H., Masui, M., and Kainuma, M.: Global GHG emissions scenarios under GHG con-centration stabilization targets, J. Glob. Env. Eng., 13, 97–108, 2008.
Hossaini, R., Chipperfield, M. P., Monge-Sanz, B. M., Richards, N. A. D., Atlas, E., and Blake, D. R.: Bromoform and di-bromomethane in the tropics: a 3-D model study of chem-istry and transport, Atmos. Chem. Phys., 10, 719–735, https://doi.org/10.5194/acp-10-719-2010, 2010.
Hossaini, R., Chipperfield, M. P., Dhomse, S., Ordonez, C., Saiz-Lopez, A., Abraham, N. L., Archibald, A., Braesicke, P., Telford, P., Warwick, N., Yang, X., and Pyle, J.: Mod-elling future changes to the stratospheric source gas in-jection of biogenic bromocarbons, Geophys. Res. Lett., 39, https://doi.org/10.1029/2012GL053401, 2012.
Hossaini, R., Chipperfield, M. P., Montzka, S. A., Rap, A., Dhomse, S., and Feng, W.: Efficiency of short-lived halogens at influencing climate through depletion of stratospheric ozone, Nat. Geosci., 8, 186–190, https://doi.org/10.1038/NGEO2363, 2015.
Hossaini, R., Patra, P. K., Leeson, A. A., Krysztofiak, G., Abra-ham, N. L., Andrews, S. J., Archibald, A. T., Aschmann, J., Atlas, E. L., Belikov, D. A., Bönisch, H., Carpenter, L. J., Dhomse, S., Dorf, M., Engel, A., Feng, W., Fuhlbrügge, S., Grif-fiths, P. T., Harris, N. R. P., Hommel, R., Keber, T., Krüger, K., Lennartz, S. T., Maksyutov, S., Mantle, H., Mills, G. P., Miller, B., Montzka, S. A., Moore, F., Navarro, M. A., Oram, D. E., Pfeilsticker, K., Pyle, J. A., Quack, B., Robinson, A. D., Saikawa, E., Saiz-Lopez, A., Sala, S., Sinnhuber, B.-M., Taguchi, S., Tegtmeier, S., Lidster, R. T., Wilson, C., and Ziska, F.: A multi-model intercomparison of halogenated very short-lived substances (TransCom-VSLS): linking oceanic emissions and tropospheric transport for a reconciled estimate of the strato-spheric source gas injection of bromine, Atmos. Chem. Phys., 16, 9163-9187, https://doi.org/10.5194/acp-16-9163-2016, 2016. Hughes, C., Johnson, M., Utting, R., Turner, S.,
Ma-lin, G., Clarke, A., and Liss, P. S.: Microbial control of bromocarbon concentrations in coastal waters of the western Antarctic Peninsula, Mar. Chem., 151, 35–46, https://doi.org/10.1016/j.marchem.2013.01.007, 2013.
IPCC – Intergovernmental Panel on Climate Change: Climate Change 2013: The Physical Science Basis, 2013.
Jöckel, P., Kerkweg, A., Buchholz-Dietsch, J., Tost, H., Sander, R., and Pozzer, A.: Technical Note: Coupling of chemical pro-cesses with the Modular Earth Submodel System (MESSy) submodel TRACER, Atmos. Chem. Phys., 8, 1677–1687, https://doi.org/10.5194/acp-8-1677-2008, 2008.
Jöckel, P., Kerkweg, A., Pozzer, A., Sander, R., Tost, H., Riede, H., Baumgaertner, A., Gromov, S., and Kern, B.: Development cycle 2 of the Modular Earth Submodel System (MESSy2), Geosci. Model Dev., 3, 717–752, https://doi.org/10.5194/gmd-3-717-2010, 2010.
Jöckel, P., Tost, H., Pozzer, A., Kunze, M., Kirner, O., Brenninkmei-jer, C. A. M., Brinkop, S., Cai, D. S., Dyroff, C., Eckstein, J., Frank, F., Garny, H., Gottschaldt, K.-D., Graf, P., Grewe, V., Kerkweg, A., Kern, B., Matthes, S., Mertens, M., Meul, S., Neu-maier, M., Nützel, M., Oberländer-Hayn, S., Ruhnke, R., Runde, T., Sander, R., Scharffe, D., and Zahn, A.: Earth System Chem-istry integrated Modelling (ESCiMo) with the Modular Earth Submodel System (MESSy) version_2.51, Geosci. Model Dev., 9, 1153–1200, https://doi.org/10.5194/gmd-9-1153-2016, 2016. Kerkweg, A., Buchholz, J., Ganzeveld, L., Pozzer, A., Tost, H., and
Jöckel, P.: Technical Note: An implementation of the dry removal processes DRY DEPosition and SEDImentation in the Modu-lar Earth Submodel System (MESSy), Atmos. Chem. Phys., 6, 4617–4632, https://doi.org/10.5194/acp-6-4617-2006, 2006a. Kerkweg, A., Sander, R., Tost, H., and Jöckel, P.: Technical note:
Implementation of prescribed (OFFLEM), calculated (ONLEM), and pseudo-emissions (TNUDGE) of chemical species in the Modular Earth Submodel System (MESSy), Atmos. Chem. Phys., 6, 3603–3609, https://doi.org/10.5194/acp-6-3603-2006, 2006b.
Kettle, A. J., Kuhn, U., von Hobe, M., Kesselmeier, J., and Andreae, M. O.: Global budget of atmospheric car-bonyl sulfide: Temporal and spatial variations of the domi-nant sources and sinks, J. Geophys. Res.-Atmos., 107, 1–16, https://doi.org/10.1029/2002JD002187, 2002.
Laufkötter, C., Vogt, M., Gruber, N., Aita-Noguchi, M., Aumont, O., Bopp, L., Buitenhuis, E., Doney, S. C., Dunne, J., Hashioka,
T., Hauck, J., Hirata, T., John, J., Le Quéré, C., Lima, I. D., Nakano, H., Seferian, R., Totterdell, I., Vichi, M., and Völker, C.: Drivers and uncertainties of future global marine primary pro-duction in marine ecosystem models, Biogeosciences, 12, 6955– 6984, https://doi.org/10.5194/bg-12-6955-2015, 2015.
Laufkötter, C., Vogt, M., Gruber, N., Aumont, O., Bopp, L., Doney, S. C., Dunne, J. P., Hauck, J., John, J. G., Lima, I. D., Se-ferian, R., and Völker, C.: Projected decreases in future ma-rine export production: the role of the carbon flux through the upper ocean ecosystem, Biogeosciences, 13, 4023–4047, https://doi.org/10.5194/bg-13-4023-2016, 2016.
Lennartz, S. T., Krysztofiak, G., Marandino, C. A., Sinnhuber, B.-M., Tegtmeier, S., Ziska, F., Hossaini, R., Krüger, K., Montzka, S. A., Atlas, E., Oram, D. E., Keber, T., Bönisch, H., and Quack, B.: Modelling marine emissions and atmospheric distributions of halocarbons and dimethyl sulfide: the influence of prescribed water concentration vs. prescribed emissions, Atmos. Chem. Phys., 15, 11753–11772, https://doi.org/10.5194/acp-15-11753-2015, 2015.
Li, F., Austin, J., and Wilson, J.: The strength of the Brewer-Dobson circulation in a changing climate: coupled chemistry-climate model simulations, J. Climate, 21, 40–57, https://doi.org/10.1175/2007JCLI1663.1, 2008.
Liang, Q., Stolarski, R. S., Kawa, S. R., Nielsen, J. E., Douglass, A. R., Rodriguez, J. M., Blake, D. R., Atlas, E. L., and Ott, L. E.: Finding the missing stratospheric Bry: a global modeling study
of CHBr3and CH2Br2, Atmos. Chem. Phys., 10, 2269–2286,
https://doi.org/10.5194/acp-10-2269-2010, 2010.
Liang, Q., Atlas, E., Blake, D., Dorf, M., Pfeilsticker, K., and Schauffler, S.: Convective transport of very short lived bromo-carbons to the stratosphere, Atmos. Chem. Phys., 14, 5781–5792, https://doi.org/10.5194/acp-14-5781-2014, 2014.
Lin, C. Y. and Manley, S. L.: Bromoform production from seawa-ter treated with bromoperoxidase, Limnol. Oceanogr., 57, 1857– 1866, https://doi.org/10.4319/lo.2012.57.6.1857, 2012.
Löffler, M., Brinkop, S., and Jöckel, P.: Impact of major volcanic eruptions on stratospheric water vapour, Atmos. Chem. Phys., 16, 6547–6562, https://doi.org/10.5194/acp-16-6547-2016, 2016.
Michou, M., Saint-Martin, D., Teyssèdre, H., Alias, A., Karcher, F., Olivié, D., Voldoire, A., Josse, B., Peuch, V.-H., Clark, H., Lee, J. N., and Chéroux, F.: A new version of the CNRM Chemistry-Climate Model, CNRM-CCM: description and improvements from the CCMVal-2 simulations, Geosci. Model Dev., 4, 873– 900, https://doi.org/10.5194/gmd-4-873-2011, 2011.
Moore, R. M., Webb, M., Tokarczyk, R., and Wever, R.: Bromoper-oxidase and iodoperBromoper-oxidase enzymes and production of halo-genated methanes in marine diatom cultures, J. Geophys. Res.-Oceans, 101, 20899–20908, https://doi.org/10.1029/96JC01248, 1996.
Morgenstern, O., Hegglin, M. I., Rozanov, E., O’Connor, F. M., Abraham, N. L., Akiyoshi, H., Archibald, A. T., Bekki, S., Butchart, N., Chipperfield, M. P., Deushi, M., Dhomse, S. S., Garcia, R. R., Hardiman, S. C., Horowitz, L. W., Jöckel, P., Josse, B., Kinnison, D., Lin, M., Mancini, E., Manyin, M. E., Marchand, M., Marécal, V., Michou, M., Oman, L. D., Pitari, G., Plummer, D. A., Revell, L. E., Saint-Martin, D., Schofield, R., Stenke, A., Stone, K., Sudo, K., Tanaka, T. Y., Tilmes, S., Yamashita, Y., Yoshida, K., and Zeng, G.: Review of the
global models used within phase 1 of the ChemistryClimate Model Initiative (CCMI), Geosci. Model Dev., 10, 639-671, https://doi.org/10.5194/gmd-10-639-2017, 2017.
Muthers, S., Kuchar, A., Stenke, A., Schmitt, J., Anet, J. G., Raible, C. C., and Stocker, T. F.: Stratospheric age of air vari-ations between 1600 and 2100, Geophys. Res. Lett., 43, 5409– 5418, https://doi.org/10.1002/2016GL068734, 2016.
Nightingale, P. D., Liss, P. S., and Schlosser, P.: Mea-surements of air-sea gas transfer during an open ocean algal bloom, Geophys. Res. Lett., 27, 2117–2120, https://doi.org/10.1029/2000GL011541, 2000.
Oberländer-Hayn, S., Gerber, E. P., Abalichin, J., Akiyoshi, H., Kerschbaumer, A., Kubin, A., Kunze, M., Langematz, U., Meul, S., Michou, M., Morgenstern, O., and Oman, L. D.: Is the Brewer-Dobson circulation increasing or mov-ing upward?, Geophys. Res. Lett., 43, 1772–1779, https://doi.org/10.1002/2015GL067545, 2016.
Oman, L. D., Douglass, A. R., Salawitch, R. J., Canty, T. P., Ziemke, J. R., and Manyin, M.: The effect of represent-ing bromine from VSLS on the simulation and evolution of Antarctic ozone, Geophys. Res. Lett., 43, 9869–9876, https://doi.org/10.1002/2016GL070471, 2016.
Ordóñez, C., Lamarque, J.-F., Tilmes, S., Kinnison, D. E., At-las, E. L., Blake, D. R., Sousa Santos, G., Brasseur, G., and Saiz-Lopez, A.: Bromine and iodine chemistry in a global chemistry-climate model: description and evaluation of very short-lived oceanic sources, Atmos. Chem. Phys., 12, 1423– 1447, https://doi.org/10.5194/acp-12-1423-2012, 2012. Pozzer, A., Jöckel, P., Sander, R., Williams, J., Ganzeveld, L., and
Lelieveld, J.: Technical Note: The MESSy-submodel AIRSEA calculating the air-sea exchange of chemical species, Atmos. Chem. Phys., 6, 5435–5444, https://doi.org/10.5194/acp-6-5435-2006, 2006.
Pringle, K. J., Tost, H., Message, S., Steil, B., Giannadaki, D., Nenes, A., Fountoukis, C., Stier, P., Vignati, E., and Lelieveld, J.: Description and evaluation of GMXe: a new aerosol submodel for global simulations (v1), Geosci. Model Dev., 3, 391–412, https://doi.org/10.5194/gmd-3-391-2010, 2010.
Reynolds, R. W., Rayner, N. A., Smith, T. M., Stokes, D. C., and Wang, W. Q.: An improved in situ and satellite SST analysis for climate, J. Cli-mate, 15, 1609–1625, https://doi.org/10.1175/1520-0442(2002)015<1609:AIISAS>2.0.CO;2, 2002.
Sander, R., Baumgaertner, A., Gromov, S., Harder, H., Jöckel, P., Kerkweg, A., Kubistin, D., Regelin, E., Riede, H., Sandu, A., Taraborrelli, D., Tost, H., and Xie, Z.-Q.: The atmospheric chem-istry box model CAABA/MECCA-3.0, Geosci. Model Dev., 4, 373–380, https://doi.org/10.5194/gmd-4-373-2011, 2011a. Sander, S. P., Burkholder, J. B., Abbatt, J. P. D., Barker, J. R.,
Huie, R. E., Kolb, C. E., Kurylo, M. J., Orkin, V. L., Wilmouth, D. M., and Wine, P. H.: Chemical Kinetics and Pho-tochemical Data for Use in Atmospheric Studies, Tech. Rep. 17, National Aeronautics and Space Administration, Jet Propulsion Laboratory, 2011b.
Sander, R., Jöckel, P., Kirner, O., Kunert, A. T., Landgraf, J., and Pozzer, A.: The photolysis module JVAL-14, compatible with the MESSy standard, and the JVal PreProcessor (JVPP), Geosci. Model Dev., 7, 2653–2662, https://doi.org/10.5194/gmd-7-2653-2014, 2014.
Sinnhuber, B.-M. and Meul, S.: Simulating the impact of emis-sions of brominated very short lived substances on past strato-spheric ozone trends, Geophys. Res. Lett., 42, 2449–2456, https://doi.org/10.1002/2014GL062975, 2015.
Sinnhuber, B.-M., Sheode, N., Sinnhuber, M., Chipperfield, M. P., and Feng, W.: The contribution of anthropogenic bromine emis-sions to past stratospheric ozone trends: a modelling study, At-mos. Chem. Phys., 9, 2863–2871, https://doi.org/10.5194/acp-9-2863-2009, 2009.
Stemmler, I., Hense, I., and Quack, B.: Marine sources of bromo-form in the global open ocean – global patterns and emissions, Biogeosciences, 12, 1967–1981, https://doi.org/10.5194/bg-12-1967-2015, 2015.
Tost, H., Jöckel, P., Kerkweg, A., Sander, R., and Lelieveld, J.: Tech-nical note: A new comprehensive SCAVenging submodel for global atmospheric chemistry modelling, Atmos. Chem. Phys., 6, 565–574, https://doi.org/10.5194/acp-6-565-2006, 2006. Voldoire, A., Sanchez-Gomez, E., Salas y Melia, D., Decharme, B.,
Cassou, C., Senesi, S., Valcke, S., Beau, I., Alias, A., Cheval-lier, M., Deque, M., Deshayes, J., Douville, H., Fernandez, E., Madec, G., Maisonnave, E., Moine, M.-P., Planton, S., Saint-Martin, D., Szopa, S., Tyteca, S., Alkama, R., Belamari, S., Braun, A., Coquart, L., and Chauvin, F.: The CNRM-CM5.1 global climate model: description and basic evaluation, Clim. Dynam., 40, 2091–2121, https://doi.org/10.1007/s00382-011-1259-y, 2013.
Wanninkhof, R.: Relationship between wind speed and gas ex-change over the ocean, J. Geophys. Res.-Oceans, 97, 7373–7382, https://doi.org/10.1029/92JC00188, 1992.
Wanninkhof, R. and McGillis, W. R.: A cubic relationship between air-sea CO2exchange and wind speed, Geophys. Res. Lett., 26,
1889–1892, https://doi.org/10.1029/1999GL900363, 1999. Warwick, N. J., Pyle, J. A., Carver, G. D., Yang, X.,
Sav-age, N. H., O’Connor, F. M., and Cox, R. A.: Global model-ing of biogenic bromocarbons, J. Geophys. Res.-Atmos., 111, https://doi.org/10.1029/2006JD007264, 2006.
Wilcox, L. J., Hoskins, B. J., and Shine, K. P.: A global blended tropopause based on ERA data. Part II: Trends and tropical broadening, Q. J. Roy. Meteor. Soc., 138, 576–584, https://doi.org/10.1002/qj.910, 2012.
Yang, X., Abraham, N. L., Archibald, A. T., Braesicke, P., Kee-ble, J., Telford, P. J., Warwick, N. J., and Pyle, J. A.: How sen-sitive is the recovery of stratospheric ozone to changes in con-centrations of very short-lived bromocarbons?, Atmos. Chem. Phys., 14, 10431–10438, https://doi.org/10.5194/acp-14-10431-2014, 2014.
Ziska, F., Quack, B., Abrahamsson, K., Archer, S. D., Atlas, E., Bell, T., Butler, J. H., Carpenter, L. J., Jones, C. E., Harris, N. R. P., Hepach, H., Heumann, K. G., Hughes, C., Kuss, J., Krüger, K., Liss, P., Moore, R. M., Orlikowska, A., Raimund, S., Reeves, C. E., Reifenhäuser, W., Robinson, A. D., Schall, C., Tanhua, T., Tegtmeier, S., Turner, S., Wang, L., Wallace, D., Williams, J., Yamamoto, H., Yvon-Lewis, S., and Yokouchi, Y.: Global sea-to-air flux climatology for bromoform, dibro-momethane and methyl iodide, Atmos. Chem. Phys., 13, 8915– 8934, https://doi.org/10.5194/acp-13-8915-2013, 2013. Ziska, F., Quack, B., Tegtmeier, S., Stemmler, I., and Krüger, K.:
Future emissions of marine halogenated very-short lived sub-stances under climate change, J. Atmos. Chem., 74, 245–260, https://doi.org/10.1007/s10874-016-9355-3, 2017.