HAL Id: hal-03146165
https://hal.archives-ouvertes.fr/hal-03146165
Submitted on 18 Feb 2021
HAL is a multi-disciplinary open access archive for the deposit and dissemination of sci-entific research documents, whether they are pub-lished or not. The documents may come from teaching and research institutions in France or abroad, or from public or private research centers.
L’archive ouverte pluridisciplinaire HAL, est destinée au dépôt et à la diffusion de documents scientifiques de niveau recherche, publiés ou non, émanant des établissements d’enseignement et de recherche français ou étrangers, des laboratoires publics ou privés.
Is RBD a risk factor for impulse control disorder in
Parkinson’s disease?
Maria Livia Fantini, Janel Fedler, Bruno Pereira, Daniel Weintraub,
Ana-Raquel Marques, Franck Durif
To cite this version:
Maria Livia Fantini, Janel Fedler, Bruno Pereira, Daniel Weintraub, Ana-Raquel Marques, et al.. Is RBD a risk factor for impulse control disorder in Parkinson’s disease?. Annals of Neurology, Wiley, 2020, 88 (4), pp.759-770. �10.1002/ana.25798�. �hal-03146165�
Is RBD a risk factor for impulse control disorder in Parkinson’s disease?
Fantini ML,1,2 Fedler J,3 Pereira B,4 Weintraub D,5 Marques A,1,2 Durif F1,2
1Neurology Department, CHU Clermont-Ferrand, France, 2EA 7280 – University
Clermont-Auvergne University, 3 College of Public Health, University of Iowa, USA 4DRCI, Clinical Research Department, CHU Clermont-Ferrand, France,5 Perelman School of Medicine at the
University of Pennsylvania; Parkinson’s Disease Research, Education and Clinical Center (PADRECC), Philadelphia Veterans Affairs Medical Center, USA
(Words count: Title: 73 characters; Running head: 23 characters; Abstract: 252; Introduction: 482 words; Discussion: 1147 words; Body of the manuscript: 3933 words; Tables: 5; Figures:
3; References: 48)
Running head: ICB RISK IN PD WITH RBD Submitted to: Annals of Neurology
Corresponding Author: Maria Livia Fantini, MD, PhD
Sleep and EEG Unit, Neurology Department, CHU Gabriel Montpied
58, rue Montalembert, 63000 Clermont Ferrand Phone: +33 (0)4 73 75 16 66 Fax: +33 (0)4 73 75 16 68
Abstract
Objective: To assess the association between REM sleep behavior disorder (RBD) and
other determinants and incident impulse control disorder behaviors (ICBs) in patients with early Parkinson’s disease (PD) using longitudinal data from the Parkinson's Progression Markers Initiative (PPMI).
Methods: 401 newly-diagnosed PD patients were prospectively evaluated at baseline (BL),
month 6, and annually for 5 years. Probable RBD (pRBD) was assessed with the RBD Screening Questionnaire and dichotomized using a cut-off value ≥6. The association of BL and time-dependent (TD) pRBD and other covariates with the development of ICB
symptoms, was evaluated using Cox proportional hazards regression and general estimating equations logistic regression. Models considered adjustment for age, sex, MDS-UPDRS III, Geriatric Depression Scale (GDS-15), RBD medication use, total levodopa equivalent daily dose (LEDD), and dopamine agonist (DA) and antidepressant medication use.
Results: Both baseline pRBD and TD pRBD were not associated with an increased risk for
incident ICB symptoms after adjustment for covariates (adjusted HR=1.17, p=0.458 and HR=1.27, p=0.257 respectively). In a modified-TD pRBD model (i.e., considering subjects as pRBD onward from the first time point with RBDSQ score ≥6), the risk for incident ICB symptoms was higher in pRBD in unadjusted (HR=1.48, p=0.038), but not adjusted
(HR=1.29, p=0.202) models. TD DA use (HR=1.64, p=0.039), TD GDS-15 score (HR=1.12, p<0.001), and male sex (year 3: HR=2.10,p=0.009; year 4: HR=3.04,p=0.006; year 5: HR=4.40,p=0.007) were associated with increased ICB symptom risk.
Interpretation:pRBD is not clearly associated with ICB symptom development in early PD,
Introduction
A variable proportion of Parkinson’s disease (PD) patients, ranging from 14% to 60% may develop impulse control disorder behaviors (ICBs) during the course of the disease.1 These include impulse control disorders (ICDs), such as pathological gambling, hypersexuality, compulsive shopping and compulsive eating, as well as related behaviors, such as punding, hobbyism, walkabout and dopamine dysregulation syndrome. ICBs in drug-naïve PD patients have the same prevalence than in the general population,2 thus ICBs appear to be related to PD treatment, and specifically strongly associated with dopamine agonist (DA) use, with a dose-effect relationship.3
Other non-motor symptoms (NMS) in PD are also frequent and often disabling. About 33% to 60% of PD patients have REM sleep behavior disorder (RBD),4 a parasomnia characterized by elaborate and violent motor behaviors during sleep, often associated with vivid aggressive dreams.5 RBD is a premotor, or prodromal, symptom of PD, has a prevalence estimated up to 25% in de novo parkinsonian patients,6 and tends to increase over the initial years of the disease.6-9 PD comorbid with RBD predicts a more severe course of the disease, with earlier axial symptoms and greater cognitive decline.10,11
Six cross-sectional studies have examined the relationship between ICBs and RBD in PD patients. We found that patients with probable RBD assessed by questionnaire (pRBD, not confirmed by video-polysomnography) have an increased prevalence of ICB symptoms compared with PD patients without pRBD.12 A similar study replicated the finding.13An increased prevalence of video polysomnographic (vPSG)-confirmed RBD was also observed in PD patients with ICBs compared to those without.14 However, three other studies, using either a questionnaire or standard criteria to diagnose both RBD and ICBs, did not find this association.15-17 A recent meta-analysis, including 10 observational cross-sectional studies and involving a total of 2781 PD patients, found that RBD was associated with a more than twofold higher risk of having ICBs, and the same result was obtained after stratifying subgroups based on methods for diagnosing RBD and ICBs.18
Although one study assessed longitudinal severity of ICBs and its predictors in PD using multiple imputation analysis,17 to date only one longitudinal study has assessed whether RBD is a possible risk factor for the development of incident ICBs.19 This study, using Parkinson’s Progression Markers Initiative (PPMI) cohort data, found that pRBD at baseline, defined by a score ≥5 on the RBD Screening Questionnaire (RBDSQ), was an independent predictor of ICD development over time, after adjusting for some covariates (sex, age of disease onset, disease severity and duration, cognitive abilities, anxiety, and depression). However, this study did not control for total levodopa equivalent daily dose (LEDD), only for DA use by stratifying the sample. Furthermore, the study did not look at the clinical longitudinal variability in pRBD and other time-varying covariates.
Using the PPMI database, we aimed to evaluate the association between both pRBD and other predictors and the development of ICB symptoms in PD using validated longitudinal assessments.
Material and Methods
PPMI is an ongoing observational, international, multicenter study aimed at identifying biomarkers of PD progression in a large cohort of participants with early untreated (de novo) PD at enrollment, compared with healthy controls (HC). The aims and methodology of the study have been published elsewhere (www.ppmi-info.org/study-design).20The study is conducted in accordance with Good Clinical Practice and any applicable national and local regulations. Although PPMI mainly aims the study of biological markers of PD progression, it provides clinical information, including some focus on neuropsychiatric symptoms. Validated screening questionnaires for both RBD (RBDSQ)21 and ICB symptoms (Questionnaire for Impulsive-Compulsive Disorders in Parkinson’s Disease, QUIP) are among the longitudinal assessments administered.22 Both the baseline and longitudinal RBD and ICBs data from the PPMI cohort have already been used to demonstrate longitudinal course of these and other key NMS of PD.23 Data downloaded on April 1, 2019 were used for this analysis.
Participants
Four hundred twenty-three newly diagnosed, untreated (at baseline, BL) patients with PD were enrolled in PPMI. Inclusion and exclusion criteria have been described elsewhere.20 Data for this analysis was limited to subjects that had no missing baseline RBDSQ or baseline QUIP, and had at least one additional follow-up RBDSQ and QUIP at year one or later (n=401). Data up through year 5 was used.
Clinical assessment
Demographical and clinical data (sex, age, age of disease onset, duration of PD, current treatment) were collected for all participants. The severity of PD was assessed by means of the Hoehn and Yahr Stage24 and MDS-UPDRS part III25 at each visit.
All patients completed the RBDSQ at BL, 6 months, and annually starting at year 1. The RBDSQ is a 10-item patient self-rating questionnaire, with “yes” or “no” questions, with a maximum score of 13 points, covering the clinical features of RBD.21 A cut-off value ≥6 represents the best cut-off value for detecting RBD (sensitivity=0.84, specificity=0.96) in PD.26
ICB symptoms were also evaluated at BL, 6 months, and annually starting at year 1, using the short version of the QUIP. This is a self-completed screening instrument specifically developed and validated to detect the presence of current ICB symptoms in PD. In this study, the presence of ICB symptoms was defined by a score ≥1 on any of the four items related to ICDs (gambling, hypersexuality, compulsive buying and compulsive eating) or related behaviors (hobbyism, punding and walkabout).22 We did not include the item related to dopaminergic dysregulation syndrome since this disorder is uncommon in early PD, as patients are rarely on high-dose levodopa early in the disease.
As depression may be a risk factor for ICBs,27 we included the 15-item Geriatric Depression Scale (GDS-15), which has 15 dichotomous (yes/no) questions generating a score that
ranges from 0 to 15. It has been studied and validated in young and old PD patients.28 GDS-15 was treated as a continuous covariate for analysis.
Total LEDD was calculated for every participant, as well as the percentage of participants taking a DA and the DA LEDD specifically.29 As antidepressants are a risk factor for RBD,30 antidepressant use was also determined, as well as use of RBD medications (e.g.,
clonazepam and melatonin).
Statistical analysis
Probable RBD status (RBD+ or RBD-) was measured at BL, month 6, and months 12, 24, 36, 48, and 60. The pRBD status can change at each of these time points, thus pRBD is time-varying or time-dependent (TD). Along with baseline pRBD, we examined a TD and a modified time-dependent (mTD) pRBD in our analysis. RBD status assessed by
questionnaire can fluctuate during the evolution of PD,7,31,32 while vPSG-assessed RBD tends to persist over time.6-8 This can be due to the lower accuracy of questionnaires compared to PSG, but also to spontaneous changes in clinical, but not polysomnographic, manifestations of the parasomnia. Based on these assumptions, in the mTD pRBD, we treated subjects as pRBD+ from the first month onward from the time the patient first had a RBDSQ score ≥6.
Differences in baseline demographic and clinical characteristics between baseline pRBD+ and pRBD- were analyzed with the use of Student’s t-test or Wilcoxon rank-sum test for continuous variables, and chi-square test or Fisher’s Exact test for nominal variables. Time to first development of ICB symptoms was evaluated using Cox proportional- hazards (PH) and generalized estimating equations (GEE) logistic regression models. Probable RBD status was examined in three different ways: baseline pRBD, TD pRBD and mTD pRBD.
We first considered a Cox PH model with baseline pRBD and potential other baseline covariates (age, sex, MDS-UPDRS part III (continuous), GDS-15 (continuous), RBD medication use (yes/no), and antidepressant use (yes/no)). The model including baseline covariates only examined covariates’ long-term effects on ICB symptom development over the 5-year period. Subjects with symptoms of ICB at BL were excluded (n=83), and we assumed all other subjects were symptom free prior to participating in the study.
To limit the number of predictors in the final multivariate model we implemented a screening procedure. PH for a covariate was examined by including the interaction of time and the covariate (a TD coefficient) in a model with only pRBD and the covariate. If the p-value of the interaction was <0.10, PH was considered to not be satisfied and the interaction along with the covariate main effect was retained in the multivariate model.33 If PH did not appear to be violated, we proceeded to fit a Cox regression model with only the candidate covariate and pRBD status. If the p-value of the covariate was less than 0.10, the predictor was included in the multivariate model. Baseline age and antidepressant use were forced in to the final model based on clinical relevance. Hazard ratios (HR) along with 95% confidence intervals were estimated using Cox regression. The final cox regression model adjusted for age, baseline antidepressant use, sex and the interaction of months and sex (PH was not satisfied for sex). Schoenfeld’s test did not indicate a violation of PH in the final model.34 We present these results for completeness acknowledging that relating the risk for ICB symptom
development considering pRBD status at baseline only is not optimal since pRBD status changes over time.
Next, Cox PH models including TD covariates were fit. Including a TD covariate in a survival model examines the short-term effect of a covariate on the development of the event.34-36 Specifically, we related the pRBD status from the last visit with hazard of developing ICB symptoms at the current visit (i.e., a one-visit lag time relationship between covariate and event). The models examining the TD and mTD pRBD considered the following covariates for adjustment: baseline age, sex, baseline MDS-UPDRS III (continuous), TD GDS-15 (continuous), TD RBD medication use (yes/no), TD LEDD (continuous), TD DA use (yes/no),
and TD antidepressant use (yes/no). The final multivariate model was selected using the same screening procedure as for the baseline covariates model. Age, TD antidepressant use and TD DA use were forced in to the final models regardless of statistical significance.The mTD and TD pRBD final Cox regression models adjusted for age, TD antidepressant use, TD DA use, TD GDS-15, sex and the interaction of months and sex (PH was not satisfied for sex). Schoenfeld’s test did not indicate a violation of PH in the final model. HRs and 95% confidence intervals are reported. Survival probabilities are estimated from the final models and used to illustrate effects of the covariates.37 In relating the serial measurements to ICB symptoms, missing data for covariates resulted in a reduced number of events in the models. As a sensitivity analysis, we used last observation carried forward (LOCF) to impute missing values for the TD covariates.
Evaluating pRBD in a TD manner is limited by the frequency of study visits (i.e., how often pRBD status is updated). In this study, we were limited by visits every 6 months and then annually. While the biological effect of relating pRBD to ICB symptom development is not certain, it is plausible that a shorter evaluation relating pRBD to the possible risk of ICB symptoms would be reasonable. In fact, as soon as one has RBD, susceptibility to develop ICB could be increased, especially in the face of DA exposure.In order to evaluate the instantaneous association of pRBD with ICB symptom development, we fit a GEE logistic regression model. The GEE model allows us to associate the pRBD status and ICB
symptoms development captured at the same visit, which cannot be evaluated using a Cox regression model. All other TD covariates were treated instantaneously (no lag effect) as well. All patients (n = 401) were included in this analysis. Similar to the Cox regression models, data after a subject has developed ICB symptoms or was censored, whichever occurred first, was not used in the model. We considered both TD and mTD pRBD. To fit the GEE model, we first determined the optimal time trend (linear, quadratic, or non-linear) for a model with (TD and mTD) pRBD alone using quasilikelihood information criterion (QICu).38 An unstructured covariance structure was used. The non-linear (categorical time) model was optimal using the model selection criteria. Due to model fit issues, a model with all candidate
predictors could not be fit. Therefore, we implemented a variable screening procedure in order to limit the number of predictors in the final models. To screen the predictors, a GEE model with the candidate covariate and the interaction of pRBD and time was fit. If the p-value of the covariate was <0.10 the covariate was retained in the multivariate model. QIC was used to determine whether the interaction of the covariate and time were included. Age, TD antidepressant use and TD DA use were forced in to the final models based on clinical relevance. The final multivariate models for TD and mTD pRBD adjusted for age, TD antidepressant use, TD DA use, and TD GDS-15. Data were analyzed using SAS 9.4 Software (SAS Institute, Cary, NC) and R.39
Results
Descriptive statistics
The BL clinical characteristics of PD patients are shown in Table 1. Out of the 401 subjects, 89 (22%) patients did not have data available at the 5-year follow up. 24.9% of PD patients were pRBD+ at BL. Prevalence of pRBD increased to 36.9% at year 5. Out of the 401 subjects, 213 (53.12%) did not change RBD status over the five years; of them, 43 (20.2%) subjects had pRBD at all their visits, and 170 (79.8%) never had pRBD. In 188 participants (46.9%) RBD status changed over the 5-year period.
The cumulative prevalence of patients who had pRBD at some point increased from 24.9% at BL to 58.0% over the follow-up. Forty-three patients were treated for their RBD at some point during the observation period. At BL, RBD+ patients had higher MDS-UPDRS part III and GDS-15 scores, and were more likely to take antidepressant and RBD medications (Table 1).
The overall prevalence of patients screening positive for ICB symptoms increased from 20.7% at BL to 26.3% at year 5. The prevalence of each ICB symptom over time is illustrated in Figure 1.
At BL, patients screening positive for ICB symptoms were more frequent in pRBD+ group compared to pRBD- (28.0% vs. 18.3%, p=0.04). Prevalence of ICB symptoms slightly increased from baseline to year 5 years only in pRBD+, and the between-group difference remained significant at year 5 (pRBD+ = 32.0%; pRBD- = 18.3%, p=0.007).
Mean GDS-15 score in the whole sample was 2.32 ± 2.47, median 2.0 (range 0, 14) at BL. At follow-up, mean GDS-15 score was 2.79 ± 2.81, median 2.0, (range 0, 15), n=313.
Impact of pRBD on incident ICBs
Excluding participants with baseline ICB symptoms (n=83), 124/318 (39%) patients developed ICB symptoms over the 5-year period. The percentage of participants with incident ICB symptoms was not statistically different based on BL RBD status (pRBD+ = 47%, pRBD- = 37%). Results of univariate and multivariate HR estimates for BL Cox model and TD pRBD are illustrated in Table 2. Baseline pRBD was not associated with an
increased risk for development of ICB symptoms (unadjusted HR=1.36, 95% CI (0.92, 2.02), p=0.125; adjusted HR=1.17, 95% CI (0.77, 1.77), p=0.458).
In the TD pRBD model, an increased risk for incident ICBs was not observed in pRBD patients (unadjusted HR=1.43, 95% CI (0.97, 2.10), p=0.069; adjusted HR=1.27, 95% CI (0.84, 1.90), p=0.257). In the mTD pRBD model, the risk for ICB symptoms was higher in pRBD patients in unadjusted (HR=1.48, 95% CI (1.02, 2.14), p=0.038) but not adjusted (HR=1.29, 95% CI (0.88, 1.90), p=0.202) models (see Table 3a).
In the TD pRBD model, variables associated with an increased risk for incident ICB
symptoms were TD DA use (HR=1.64, 95% CI (1.03, 2.64), p=0.039), TD GDS-15 (HR=1.12, 95% CI (1.06, 1.19), p<0.0001), and male sex. The effect of sex varied over time; as time progressed, ICBs symptoms became increasingly more common in males (year 3: HR=2.10, 95% CI (1.20, 3.67), p=0.009; year 4: HR=3.04, 95% CI (1.37, 6.73), p=0.006, year 5:
HR=4.40 95% CI (1.5-12.8) p=0.007). Similar analyses in the mTD pRBD model led to identical results (see Table 3a).
As showed in Table 3b, according to HR estimates for LOCF (allowing to impute missing values for the TD covariates), in mTD RBD Cox model the risk for ICB symptoms was higher in pRBD patients in unadjusted (HR=1.52, 95% CI (1.06, 2.18), p=0.023) but not adjusted (HR=1.33, 95% CI (0.91, 1.94), p=0.134) models.
Instantaneous association of pRBD with ICB symptom development
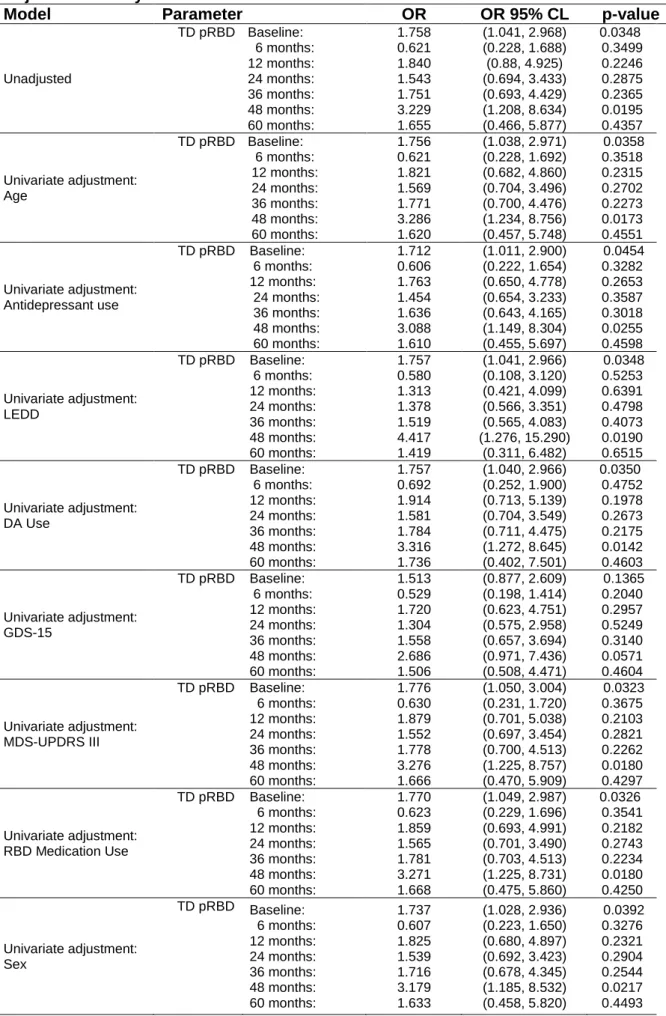
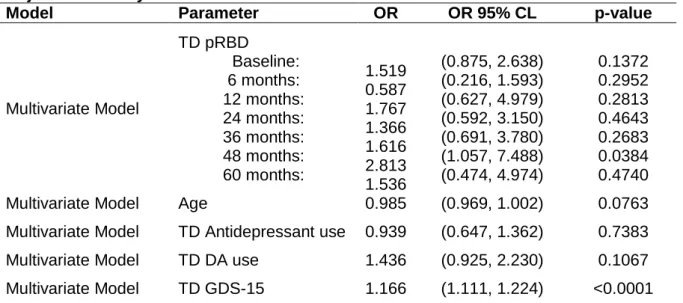
GEE logistic regression model, allowing to assess the pRBD status and ICB symptoms development captured at the same visit, showed that pRBD+ had an increased risk for ICBs symptoms at BL (HR: 1.75, 95% CI (1.04-2.97) p=0.035) and at year 4 (HR: 3.23, 95% CI (1.21-8.63); p=0.020). However, results were not significant after adjusting for covariates related to ICBs development (see Tables 4-5).
Discussion
This study found that depression, DA use and male sex are strong predictors of the development of ICB symptoms, while RBD is not robustly associated with incident ICBs.
Younger age or younger age at disease onset, male sex, DA use, and depression are knowns risk factors or correlates for ICBs in PD.20,40,41 In this study, incident ICBs through the 5-year follow-up period were correlated with DA use and depression, but not with age. While most previous cross-sectional studies found an association between ICBs and younger age, the few longitudinal studies conducted have reported conflicting results.3,42,43 The current study, performed on a large, de novo PD cohort with a long follow-up period, suggests that younger age is not a risk factor when controlling for confounding factors.
Male sex has been shown to be associated with ICBs in PD, in both cross-sectional and longitudinal studies.3,41,44 Interestingly in our study, the effect of sex varied over time; male
sex was not associated with an increased risk to develop ICBs over the first two years of follow-up, but as time progressed ICBs became increasingly more common in males. Sex differences in the prevalence of ICBs have been reported for some type of ICBs in PD (e.g. hypersexuality being more prevalent in men, buying and eating in women).44,45 Future studies should investigate the relationship between sex and timing in the development of each ICD/ICB, in order to better study the trajectories of the evolution of each ICBs under DA treatment.
Depression has been shown to be associated with ICBs in PD patients as well as in general population, mainly in cross-sectional studies.46-48 Recently, a longitudinal study performed on the same cohort as the present study showed that depression predisposes to development of ICDs in PD.20 In that study, patients were considered depressed if they had a GDS-15 score ≥7 or if they were taking antidepressants indicated for depression. In the present study, we decided to look at the impact of TD depression, based on GDS-15 score as continuous measure, on the development of ICBs. Results of this longitudinal analysis support the role of depressive symptoms as a risk factor for developing ICBs.
The present study found a significant association between pRBD and ICBs in cross-sectional analyses, as well as an increased risk for ICB symptoms in pRBD patients in longitudinal univariate analysis, while only a trend towards an increase risk was observed after
adjustment for covariates. Similar results were obtained when imputing missing values for the TD covariates by means of LOCF.
The relationship between RBD and ICBs is controversial; an association has been observed in several cross-sectional studies,12-14 but others studies failed to find such a correlation.15-17 Conflicting results may be ascribed to methodological differences in assessing RBD and ICBs, or to insufficient power due to low number of patients with ICBs
.
In a recent study on early PD patients followed for 3 years, the prevalence of ICBs was not associated to RBD, but only with DA use, apathy and severity of motor fluctuations, according to a multipleimputation analysis.17 Recently, a meta-analysis including 10 observational cross-sectional studies and involving data from 2781 PD patients found that RBD was associated with a more than twofold increased risk of developing ICBs, even after stratifying subgroups based on methods for diagnosing RBD and ICBs.18 Finally, another longitudinal analysis was recently performed using the PPMI cohort data, finding that pRBD at baseline was an independent predictor of ICD development over time.19 However, a cut-off off of ≥5 on the RBDSQ was used to define pRBD, as in general population, while a cut-off ≥6 has been shown to be the best value for detecting RBD in PD.28 Furthermore, the study only looked at the long-term effect of baseline pRBD, and did not look at the time-dependent effect of pRBD and other time-varying covariates in predicting ICBs with a specific time lag. Finally, results were not adjusted for LEDD, and only DA use was considered, but this covariate was not included in the Cox PH model but was rather taken into account by stratifying the sample in DA users and non-users.
Our study failed to demonstrate a clear association between RBD and the development of ICBs. A possible explanation can be that ICB rates didn’t increase much over the 5 years, rising just from 20.7% at BL to 26.3% at year 5. Actually, in a longitudinal prospective study from a French PD cohort including 411 PD patients with duration of disease at baseline of 2.6 y, the prevalence of ICBs was found to increase from 19.7% at baseline to 32.8% at 5 years.3 Therefore, one may think that the impact of BL or TD pRBD may only manifest itself once disease manifests for longer and ICB rates increase more significantly, either due to disease impact or to longer or greater exposure to dopaminergic treatments.
A main limitation of the present study is the fact that ascertainment of RBD was
questionnaire-assessed and not confirmed by video polysomnography at baseline and during follow-up. However, the RBDSQ in PD has been found to show a moderate to high sensitivity and specificity (0.842 and 0.962 respectively) using a cut-off ≥6.26 Moreover, no information from bedpartner or caretaker was available, potentially leading to an underestimate of the prevalence of both RBD and ICBs.Furthermore, RBD status, especially assessed by
questionnaire, can fluctuate during the evolution of PD,4,30,31 while PSG-assessed RBD has been found to persist over time.3-5 This can be due to the lower accuracy of the questionnaire compared to PSG, but also to spontaneous changes in the clinical, but not
polysomnographic, manifestations of the parasomnia.6-8 In order to take into account this phenomenon, a set of analyses was performed in PD patients according to the “modified time-dependent” RBD model (i.e., considering subjects as pRBD+ from the first month onward that the patient had an RBDSQ score ≥6).
This study investigated the relationship between RBD and ICBs in PD in a longitudinal approach. Strengths of this study are the use of a large de novo PD cohort with a long follow up, the use of validated tools to assess RBD, ICBs and depression, and a sound,
comprehensive statistical plan.
In this analysis, we examined several time-relationships between pRBD and ICB symptom development: the long-term effect of baseline pRBD, the one visit-lag, and the instantaneous association. These analysis methods are limited in that they only utilize one pRBD status at a time in the model estimation. Further studies could include analyses that incorporate more complex models utilizing the entire covariate history of pRBD, such as a joint model.
In conclusion, DA use, depression, and male sex, but not clearly pRBD, are strongly associated with ICB symptom development in early PD. Further longitudinal studies are needed to further elucidate the association between RBD and ICBs in this population.
ACKNOWLEDGEMENTS
The authors wish to thank Ms. Celine Lambert, PhD, for helping in creating graphics of the manuscript.
AUTHOR CONTRIBUTIONS
MLF, JF, BP, DW, AM and FD contributed to the conception and design of the study; JF and BP contributed to the acquisition and analysis of data; MLF, JF, BP and FD contributed to the drafting the text and preparing the figures.
POTENTIAL CONFLICTS OF INTEREST Nothing to report
REFERENCES
1. Molde H, Moussavi Y, Kopperud ST et al. Impulse-Control Disorders in Parkinson’s Disease: A Meta-Analysis and Review of Case-Control Studies. Front Neurol 2018; 9:330.
2. Weintraub D, Papay K, Siderowf A, P. P. M. Initiative, and others. Screening for impulse control symptoms in patients with de novo Parkinson disease A case-control study. Neurology 2013;80:176-180
3. Corvol J-C, Artaud F, Cormier-Dequaire F et al. Longitudinal analysis of impulse control disorders in Parkinson disease. Neurology 2018;91:e189-e201
4. Zhang X, Sun X, Wang J et al. Prevalence of rapid eye movement sleep behavior disorder (RBD) in Parkinson’s disease: a meta and meta-regression analysis. Neurol Sci 2017;38:163–170.
5. American Academy of Sleep Medicine, International classification of sleep disorders. Darien, IL: American Academy of Sleep Medicine, 2014
6. Sixel-Döring F, Zimmermann J, Wegener A et al. The Evolution of REM Sleep Behavior Disorder in Early Parkinson Disease. SLEEP 2016;39:1737-1742
7. Sixel-Döring F, Zimansky L, Muntean ML et al. REM sleep behavior disorder and REM sleep without atonia is a progression marker in Parkinson’s disease: a report from the DeNoPa cohort [abstract]. Mov Disord. 2019; 34 (suppl 2).
https://www.mdsabstracts.org/abstract/rem-sleep-behavior-disorder-and-rem-sleep- without-atonia-is-a-progression-marker-in-parkinsons-disease-a-report-from-the-denopa-cohort/. Accessed October 20, 2019.
8. M. Figorilli, A. Marques, M. Meloni, B. Pereira, M. Puligheddu, F. Durif, ML. Fantini. Does REM Sleep Behavior Disorder Change in the Progression of Parkinson’s Disease? Mov Disord. 2019; 34 (suppl 2). ttps://www.mdsabstracts.org/abstract/does-rem-sleep-behavior-disorder-change-in-the-progression-of-parkinsons-disease/. Accessed October 20, 2019.
9. Bugalho P and Viana-Baptista M. REM sleep behavior disorder and motor dysfunction in Parkinson’s disease--a longitudinal study. Parkinsonism Relat Disord,
2013;19:1084-1087.
10. Howell MJ and Schenck CH Rapid Eye Movement Sleep Behavior Disorder and Neurodegenerative Disease,” JAMA Neurol 2015;72:707-712
11. Fereshtehnejad SM, Romenets R, Anang JBM et al. New Clinical Subtypes of Parkinson Disease and Their Longitudinal Progression: A Prospective Cohort Comparison With Other Phenotypes JAMA Neurol 2015; 72: 863–873.
12. Fantini ML, Macedo L, Zibetti M et al. Increased risk of impulse control symptoms in Parkinson’s disease with REM sleep behaviour disorder. J. Neurol. Neurosurg. Psychiatry, 2015;86:174-179
13. Bellosta Diago E, Lopez Del Val LJ, Santos Lasaosa S, et al. Association between REM sleep behaviour disorder and impulse control disorder in patients with
Parkinson’s disease. Neurol. Barc. Spain, 2016;32:494-499
14. Fantini ML, Figorilli M, Arnulf I et al. Sleep and REM sleep behaviour disorder in Parkinson’s disease with impulse control disorder. J Neurol Neurosurg Psychiatry 2017;89:305-310
15. Kim YE, Jeon BS, Yang HJ et al. REM sleep behavior disorder: association with motor complications and impulse control disorders in Parkinson’s disease. Parkinsonism
Relat Disord 2014;20: pp. 1081-1084
16. Bayard S, Dauvilliers Y, Yu H, et al., Impulse control disorder and rapid eye movement sleep behavior disorder in Parkinson’s disease. Parkinsonism Relat. Disord
2014:20:1411-1414
17. Baig F, Kelly MJ, Lawton MA et al., Impulse control disorders in Parkinson disease and RBD: A longitudinal study of severity. Neurology 2019;93:e675–e687
18. Lu HT, Shen QY, Zhao QZ et al. Association between REM sleep behavior disorder and impulsive-compulsive behaviors in Parkinson's disease: a systematic review and meta-analysis of observational studies. J Neurol 2019 doi: 10.1007/s00415-019-09588-3.
19. Cao R, Chen X, Xing F, Xie C, Hu P, Wang K. Cross-sectional and longitudinal associations between probable rapid eye movement sleep behavior
disorder and impulse control disorders in Parkinson's disease. Eur J Neurol. 2020 Feb 17. doi: 10.1111/ene.14177. [Epub ahead of print]
20. http://www.ppmi-info.org/wp-content/uploads/2018/02/PPMI-AM-13-Protocol.pdf
21. Stiasny-Kolster K, Mayer G, Schäfer G, et al. The REM sleep behavior disorder screening questionnaire-A new diagnostic instrument. Mov Disord 2007;22:2386-2393 22. Weintraub D, Hoops S, Shea JA et al., Validation of the questionnaire for
impulsive-compulsive disorders in Parkinson’s disease. Mov Disord 2009;24:1461-1467 23. Simuni T, Caspell-Garcia C, Coffey CS et al. Baseline prevalence and longitudinal
evolution of non-motor symptoms in early Parkinson’s disease: the PPMI cohort. J Neurol Neurosurg Psychiatry 2018;89:78–88
24. Goetz CG, Poewe W, Rascol O, et al. Movement Disorder Society Task Force report on the Hoehn and Yahr staging scale: status and recommendations. Mov Disord 2004;19:1020-1028
25. Goetz CG, Tilley BC, Shaftman SR et al. Movement Disorder Society-sponsored revision of the Unified Parkinson’s Disease Rating Scale (MDS-UPDRS): scale presentation and clinimetric testing results. Mov Disord 2008;23:2129-2170 26. Nomura T, Inoue Y, Kagimura T, et al. Utility of the REM sleep behavior disorder
screening questionnaire (RBDSQ) in Parkinson’s disease patients. Sleep Med 2001:12:711-713.
27. Marín-Lahoz J, Sampedro F, Martinez-Horta S, et al. Depression as a Risk Factor for Impulse Control Disorders in Parkinson Disease. Ann Neurol 2019; 86(5):762-769 28. Schrag A, Barone P, Brown RG et al. Depression rating scales in Parkinson’s disease:
critique and recommendations. Mov Disord 2007;22:1077-1092
29. Tomlinson CL, Stowe R, Patel S, et al. Systematic review of levodopa dose equivalency reporting in Parkinson’s disease. Mov Disord 2010;25:2649-2653. 30. McCarter SJ, St Louis EK, Sandness DJ et al. Antidepressants Increase REM Sleep
Muscle Tone in Patients with and without REM Sleep Behavior Disorder. SLEEP 2015;38:907-917
31. Lavault S, Leu-Semenescu S, Tezenas du Montcel S, et al. Does clinical rapid eye movement behavior disorder predict worse outcomes in Parkinson’s disease? J Neurol 2010;257:1154-1159
32. Gjerstad MD, Boeve B, Wentzel-Larsen T, et al. Occurrence and clinical correlates of REM sleep behaviour disorder in patients with Parkinson’s disease over time. J Neurol Neurosurg Psychiatry 2008;79:387-391
33. Hosmer, D. W. & Lemeshow, S. (1989). Applied Logistic Regression, New York: John Wiley & Sons, Inc.
34. Zhang, Z., Reinikainen, J., Adeleke, K., Pieterse, M., and Groothuis-Oudshoorn, C. Time-varying covariates and coefficients in Cox regression models. Annals of Translational Medicine, 2018, 6(7), doi: 10.21037/atm.2018.02.12.
35. Dekker, F., de Mutser, R., van Dijk, P., Zoccali, C., and Jager, K. Survival analysis: time-dependent effects and time-varying risk factors. Kidney International, 2008, 74, pg 994-997, doi:10.1038/ki.2008.328.
36. Therneau, T., Crowson, C. and Atkinson, E. Using time dependent covariates and time dependent coefficients in the cox model. Mayo clinic, 2019.
37. Thomas, L. and Reyes, E. Tutorial: Survival estimation for Cox regression models with time-varying coefficients using SAS and R. Journal of Statistical Software, 2014, Volume 61, Code Snippet 1.
38. Pan W. Akaike’s information criterion in generalized estimating equations,” Biometrics 2001;7:120–125
39. Team RC. R: A language and environment for statistical computing. 2019. 40. Marques A, Durif F, and Fernagut PO. Impulse control disorders in Parkinson’s
disease. J. Neural Transm. 2018;125:1299-1312
41. Liu B, Luo W, Mo Y et al. Meta-analysis of related factors of impulse control disorders in patients with Parkinson’s disease. Neurosci. Lett. 707, 134313 (2019).
42. Bastiaens, J., Dorfman, B. J., Christos, P. J. and Nirenberg, M. J. Prospective cohort study of impulse control disorders in Parkinson’s disease. Mov. Disord. 28, 327–333 (2013).
43. Marinus, J., Zhu, K., Marras, C., et al. Risk factors for non-motor symptoms in Parkinson’s disease. The Lancet. Neurology, 2018: 17(6), 559–568.
44. Weintraub D, Koester J, Potenza MN et al., Impulse control disorders in Parkinson disease: a cross-sectional study of 3090 patients. Archives of Neurology, 2010; 67(5), 589–595.
45. Nakum S, Cavanna, AE. The prevalence and clinical characteristics of hypersexuality in patients with Parkinson’s disease following dopaminergic therapy: A systematic literature review. Parkinsonism & Related Disorders, 2016:25, 10–16.
46. Joutsa J, Martikainen K, Vahlberg T, et al. Impulse control disorders and depression in Finnish patients with Parkinson’s disease. Parkin-sonism Relat Disord 2012;18:155– 160.
47. Callesen MB, Weintraub D, Damholdt MF, Møller A. Impulsive and compulsive behaviors among Danish patients with Parkinson’s disease: prevalence, depression, and personality. Parkinson Relat Disord 2014;20:22–26.
48. Goerlich-Dobre KS, Probst C, Winter L, et al. Alexithymia—an independent risk factor for impulsive-compulsive disorders in Parkinson’s disease. Mov Disord 2014;29:214– 220.
FIGURE TITLES
Figure 1: Frequency of Impulsive-Compulsive Behaviors at baseline and during the 5-years follow-up.
Figure 2: Survival Probability Estimates for pRBD+ vs pRBD-
Figure 3: Survival Probability Estimates for Male vs Female
FIGURE LEGENDS
Figure 1: no legend
Figure 2: Estimates generated from the mTD pRBD Cox model for a patient pRBD+ at baseline (and all subsequent visits) versus pRBD- at all visits leaving all other factors equal (male subject age 61 years with no DA or antidepressant use at any visit and GDS-15 of 2 at all visits).
Figure 3: Estimates generated from the mTD pRBD Cox model for a male versus female patient leaving all other factors equal (pRBD+ at all visits, age 61 years with no DA or antidepressant use at any visit and GDS-15 of 2 at all visits).
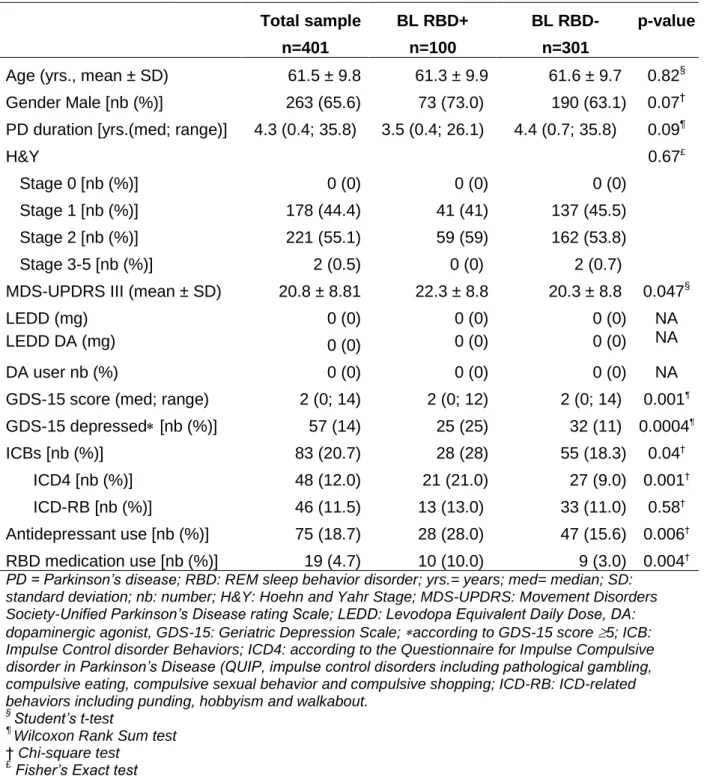
Table 1: Baseline (BL) clinical and demographic characteristics of PD patients Total sample n=401 BL RBD+ n=100 BL RBD-n=301 p-value
Age (yrs., mean ± SD) 61.5 ± 9.8 61.3 ± 9.9 61.6 ± 9.7 0.82§
Gender Male [nb (%)] 263 (65.6) 73 (73.0) 190 (63.1) 0.07†
PD duration [yrs.(med; range)] 4.3 (0.4; 35.8) 3.5 (0.4; 26.1) 4.4 (0.7; 35.8) 0.09¶ H&Y Stage 0 [nb (%)] Stage 1 [nb (%)] Stage 2 [nb (%)] Stage 3-5 [nb (%)] 0 (0) 178 (44.4) 221 (55.1) 2 (0.5) 0 (0) 41 (41) 59 (59) 0 (0) 0 (0) 137 (45.5) 162 (53.8) 2 (0.7) 0.67£
MDS-UPDRS III (mean ± SD) 20.8 ± 8.81 22.3 ± 8.8 20.3 ± 8.8 0.047§
LEDD (mg) 0 (0) 0 (0) 0 (0) NA
LEDD DA (mg) 0 (0) 0 (0) 0 (0) NA
DA user nb (%) 0 (0) 0 (0) 0 (0) NA
GDS-15 score (med; range) 2 (0; 14) 2 (0; 12) 2 (0; 14) 0.001¶
GDS-15 depressed [nb (%)] 57 (14) 25 (25) 32 (11) 0.0004¶ ICBs [nb (%)] ICD4 [nb (%)] ICD-RB [nb (%)] 83 (20.7) 48 (12.0) 46 (11.5) 28 (28) 21 (21.0) 13 (13.0) 55 (18.3) 27 (9.0) 33 (11.0) 0.04† 0.001† 0.58† Antidepressant use [nb (%)] 75 (18.7) 28 (28.0) 47 (15.6) 0.006† RBD medication use [nb (%)] 19 (4.7) 10 (10.0) 9 (3.0) 0.004†
PD = Parkinson’s disease; RBD: REM sleep behavior disorder; yrs.= years; med= median; SD: standard deviation; nb: number; H&Y: Hoehn and Yahr Stage; MDS-UPDRS: Movement Disorders Society-Unified Parkinson’s Disease rating Scale; LEDD: Levodopa Equivalent Daily Dose, DA: dopaminergic agonist, GDS-15: Geriatric Depression Scale; according to GDS-15 score 5; ICB: Impulse Control disorder Behaviors; ICD4: according to the Questionnaire for Impulse Compulsive disorder in Parkinson’s Disease (QUIP, impulse control disorders including pathological gambling, compulsive eating, compulsive sexual behavior and compulsive shopping; ICD-RB: ICD-related behaviors including punding, hobbyism and walkabout.
§ Student’s t-test ¶
Wilcoxon Rank Sum test
† Chi-square test
Table 2
2a: Hazard Ratio (HR) Estimates for Baseline pRBD
Model Parameter HR HR 95% CL p-value # of ICB
Events
Unadjusted Baseline pRBD 1.363 (0.918, 2.023) 0.1245 124
Univariate adjustment:
Age Baseline pRBD 1.349 (0.908, 2.003) 0.1378 124
Antidepressant use Baseline pRBD 1.296 (0.863, 1.946) 0.2118 124
GDS-15 Baseline pRBD 1.283 (0.860, 1.915) 0.2217 124
MDS-UPDRS III Baseline pRBD 1.349 (0.907, 2.005) 0.1394 124
RBD Medication Use Baseline pRBD 1.357 (0.910, 2.022) 0.1341 124
Sex and Sex*months Baseline pRBD 1.325 (0.891, 1.969) 0.1642 124
Multivariate Model Baseline pRBD 1.170 (0.773, 1.770) 0.4579 124
Multivariate Model Age 0.982 (0.964, 1.001) 0.0656 124
Multivariate Model Antidepressant use 1.274 (0.804, 2.020) 0.3027 124
Multivariate Model GDS-15 1.059 (0.989, 1.134) 0.1026 124
Sex* (male vs female) 124
6 months: 0.905 (0.502, 1.630) 0.7391
Multivariate Model 12 months: 1.045 (0.638, 1.712) 0.8618
24 months: 1.393 (0.928, 2.092) 0.1100
36 months: 1.858 (1.120, 3.080) 0.0164
48 months: 2.477 (1.208, 5.077) 0.0133
60 months: 3.302 (1.250, 8.724) 0.0159
2b: HR Estimates for Time-Dependent RBD Cox Models
Model Parameter HR HR 95% CL p-value # of ICB
Events Unadjusted TD pRBD 1.428 (1.022, 2.138) 0.0380 118 Age TD pRBD 1.434 (1.024, 2.141) 0.0370 118 Antidepressant use TD pRBD 1.384 (0.986, 2.106) 0.0592 118 LEDD TD pRBD 1.271 (1.051, 2.202) 0.0260 118 DA Use TD pRBD 1.465 (0.889, 1.882) 0.1789 117 GDS-15 TD pRBD 1.287 (0.869, 2.030) 0.1895 91 MDS-UPDRS III TD pRBD 1.408 (1.007, 2.119) 0.0461 118 RBD Medication Use TD pRBD 1.386 (0.988, 2.097) 0.0576 118
Sex and Sex*months TD pRBD 1.373 (0.983, 2.069) 0.0617 118
Multivariate Model TD pRBD 1.266 (0.842, 1.902) 0.2569 117
Multivariate Model Age 0.985 (0.966, 1.005) 0.1416 117
Multivariate Model TD Antidepressant use 0.989 (0.627, 1.562) 0.9634 117
Multivariate Model TD DA use 1.644 (1.025, 2.635) 0.0390 117
Multivariate Model TD GDS-15 1.122 (1.061, 1.186) <0.0001 117
Sex* (male vs female) 117
6 months: 0.835 0.459, 1.519) 0.5544
Multivariate Model 12 months: 1.004 (0.608, 1.658 0.9875
24 months: 1.452 (0.947, 2.230) 0.0880
36 months: 2.101 (1.205, 3.670) 0.0091
48 months: 3.039 (1.374, 6.738) 0.0062
60 months: 4.397 (1.508, 12.859) 0.0068
pRBD: probable REM behavior disorder; CI: confidence interval; ICB: Impulse Control disorder Behaviors; MDS-UPDRS III: Movement Disorders Society-Unified Parkinson’s Disease Rating Scale part III; GDS
-15
: Geriatric Depression Scale-15 Items; TD: Time Dependent; LEDD: Levodopa Equivalent Daily Dose, DA: dopaminergic agonist;Table 3
3a. Hazard Ratio (HR) Estimates for modified Time-Dependent pRBD Cox Models
Model Parameter HR HR 95% CL p-value ICBs (n) Unadjusted mTD pRBD 1.478 (1.022, 2.138) 0.0380 118 Univariate adjustment: 1.481 (1.024, 2.141) 0.0370 Age mTD pRBD 1.441 (0.986, 2.106) 0.0592 118 Antidepressant use mTD pRBD 1.328 (0.869, 2.030) 0.1895 118 LEDD mTD pRBD 1.521 (1.051, 2.202) 0.0260 118 DA Use mTD pRBD 1.293 (0.889, 1.882) 0.1789 117 GDS-15 mTD pRBD 1.461 (1.007, 2.119) 0.0461 91 MDS-UPDRS III mTD pRBD 1.440 (0.988, 2.097) 0.0576 118 RBD Medication Use mTD pRBD 1.426 (0.983, 2.069) 0.0617 118 Sex and Sex*months mTD pRBD 1.478 (1.022, 2.138) 0.0380 118 Multivariate analysis mTD pRBD 1.288 (0.873, 1.901) 0.2025 117
Age 0.985 (0.966, 1.005) 0.1417 117
TD Antidepressant use 0.986 (0.626, 1.553) 0.9517 117 TD DA use 1.652 (1.031, 2.646) 0.0368 117 TD GDS-15 1.122 (1.060, 1.186) <0.0001 117
Sex* (male vs female) 117
6 months: 0.835 (0.459, 1.519) 0.5542 12 months: 1.004 (0.608, 1.658) 0.9869 24 months: 1.453 (0.947, 2.230) 0.0871 36 months: 2.103 (1.205, 3.670) 0.0089 48 months: 3.043 (1.374, 6.738) 0.0061 60 months: 4.403 (1.508, 12.859 0.0067
3b. Hazard Ratio (HR) estimates for LOCF modified Time-Dependent pRBD Cox Models
Model Parameter HR HR 95% CL p-value ICBs (n)
Unadjusted mTD pRBD 1.519 (1.022, 2.138) 0.0380 124 Univariate adjustment: 124 Age mTD pRBD 1.523 (1.024, 2.141) 0.0370 124 Antidepressant use mTD pRBD 1.465 (0.986, 2.106) 0.0592 124 LEDD mTD pRBD 1.557 (1.051, 2.202) 0.0260 124 DA Use mTD pRBD 1.351 (0.889, 1.882) 0.1789 124 GDS-15 mTD pRBD 1.518 (0.869, 2.030) 0.1895 124 MDS-UPDRS III mTD pRBD 1.504 (1.007, 2.119) 0.0461 124 RBD Medication Use mTD pRBD 1.491 (0.988, 2.097) 0.0576 124 Sex and Sex*months mTD pRBD 1.475 (0.983, 2.069) 0.0617 124 Multivariate analysis mTD pRBD 1.334 (0.915, 1.944) 0.1342 124
Age 0.983 (0.964, 1.002) 0.0822 124
TD Antidepressant use 1.028 (0.665, 1.588) 0.9022 124 TD DA use 1.590 (1.007, 2.510) 0.0467 124 TD GDS-15 1.123 (1.063, 1.186) <0.0001 124
Sex* (male vs female) 124
6 months: 0.888 (0.493, 1.599) 0.6923 12 months: 1.024 (0.625, 1.678) 0.9250 24 months: 1.362 (0.908, 2.043) 0.1356 36 months: 1.811 (1.095, 2.997 0.0208 48 months: 2.409 (1.179, 4.922) 0.0159 60 months: 3.204 (1.218, 8.428) 0.0183 pRBD: probable REM Sleep Behavior Disorder; ICB: Impulse Control disorder Behaviors; mTD pRBD: modified Time-Dependent probable REM Sleep Behavior Disorder; LEDD: Levodopa Equivalent Daily Dose, DA: dopaminergic agonist; GDS-15: Geriatric Depression Scale 15 items; MDS-UPDRS III: Movement Disorders
Table 4: Odd Ratio (OR) Estimates for Time-Dependent RBD GEE Models – Univariate Adjustment Analysis
Model Parameter OR OR 95% CL p-value
Unadjusted TD pRBD Baseline: 6 months: 12 months: 24 months: 36 months: 48 months: 60 months: 1.758 0.621 1.840 1.543 1.751 3.229 1.655 (1.041, 2.968) (0.228, 1.688) (0.88, 4.925) (0.694, 3.433) (0.693, 4.429) (1.208, 8.634) (0.466, 5.877) 0.0348 0.3499 0.2246 0.2875 0.2365 0.0195 0.4357 Univariate adjustment: Age TD pRBD Baseline: 6 months: 12 months: 24 months: 36 months: 48 months: 60 months: 1.756 0.621 1.821 1.569 1.771 3.286 1.620 (1.038, 2.971) (0.228, 1.692) (0.682, 4.860) (0.704, 3.496) (0.700, 4.476) (1.234, 8.756) (0.457, 5.748) 0.0358 0.3518 0.2315 0.2702 0.2273 0.0173 0.4551 Univariate adjustment: Antidepressant use TD pRBD Baseline: 6 months: 12 months: 24 months: 36 months: 48 months: 60 months: 1.712 0.606 1.763 1.454 1.636 3.088 1.610 (1.011, 2.900) (0.222, 1.654) (0.650, 4.778) (0.654, 3.233) (0.643, 4.165) (1.149, 8.304) (0.455, 5.697) 0.0454 0.3282 0.2653 0.3587 0.3018 0.0255 0.4598 Univariate adjustment: LEDD TD pRBD Baseline: 6 months: 12 months: 24 months: 36 months: 48 months: 60 months: 1.757 0.580 1.313 1.378 1.519 4.417 1.419 (1.041, 2.966) (0.108, 3.120) (0.421, 4.099) (0.566, 3.351) (0.565, 4.083) (1.276, 15.290) (0.311, 6.482) 0.0348 0.5253 0.6391 0.4798 0.4073 0.0190 0.6515 Univariate adjustment: DA Use TD pRBD Baseline: 6 months: 12 months: 24 months: 36 months: 48 months: 60 months: 1.757 0.692 1.914 1.581 1.784 3.316 1.736 (1.040, 2.966) (0.252, 1.900) (0.713, 5.139) (0.704, 3.549) (0.711, 4.475) (1.272, 8.645) (0.402, 7.501) 0.0350 0.4752 0.1978 0.2673 0.2175 0.0142 0.4603 Univariate adjustment: GDS-15 TD pRBD Baseline: 6 months: 12 months: 24 months: 36 months: 48 months: 60 months: 1.513 0.529 1.720 1.304 1.558 2.686 1.506 (0.877, 2.609) (0.198, 1.414) (0.623, 4.751) (0.575, 2.958) (0.657, 3.694) (0.971, 7.436) (0.508, 4.471) 0.1365 0.2040 0.2957 0.5249 0.3140 0.0571 0.4604 Univariate adjustment: MDS-UPDRS III TD pRBD Baseline: 6 months: 12 months: 24 months: 36 months: 48 months: 60 months: 1.776 0.630 1.879 1.552 1.778 3.276 1.666 (1.050, 3.004) (0.231, 1.720) (0.701, 5.038) (0.697, 3.454) (0.700, 4.513) (1.225, 8.757) (0.470, 5.909) 0.0323 0.3675 0.2103 0.2821 0.2262 0.0180 0.4297 Univariate adjustment: RBD Medication Use TD pRBD Baseline: 6 months: 12 months: 24 months: 36 months: 48 months: 60 months: 1.770 0.623 1.859 1.565 1.781 3.271 1.668 (1.049, 2.987) (0.229, 1.696) (0.693, 4.991) (0.701, 3.490) (0.703, 4.513) (1.225, 8.731) (0.475, 5.860) 0.0326 0.3541 0.2182 0.2743 0.2234 0.0180 0.4250 Univariate adjustment: Sex TD pRBD Baseline: 6 months: 12 months: 24 months: 36 months: 48 months: 60 months: 1.737 0.607 1.825 1.539 1.716 3.179 1.633 (1.028, 2.936) (0.223, 1.650) (0.680, 4.897) (0.692, 3.423) (0.678, 4.345) (1.185, 8.532) (0.458, 5.820) 0.0392 0.3276 0.2321 0.2904 0.2544 0.0217 0.4493
RBD: REM behavior disorder; GEE: Generalized Estimating Equation; TD: Time Dependent; pRBD: probable RBD; LEDD: Levodopa Equivalent Daily Dose, DA: dopaminergic agonist; GDS-15: Geriatric Depression Scale 15 Items; MDS-UPDRS III: Movement Disorders Society-Unified Parkinson’s Disease Rating Scale part III.
Table 5: OR Estimates for Time-Dependent RBD GEE Models – Multivariate Adjustment Analysis
Model Parameter OR OR 95% CL p-value
Multivariate Model TD pRBD Baseline: 6 months: 12 months: 24 months: 36 months: 48 months: 60 months: 1.519 0.587 1.767 1.366 1.616 2.813 1.536 (0.875, 2.638) (0.216, 1.593) (0.627, 4.979) (0.592, 3.150) (0.691, 3.780) (1.057, 7.488) (0.474, 4.974) 0.1372 0.2952 0.2813 0.4643 0.2683 0.0384 0.4740
Multivariate Model Age 0.985 (0.969, 1.002) 0.0763
Multivariate Model TD Antidepressant use 0.939 (0.647, 1.362) 0.7383
Multivariate Model TD DA use 1.436 (0.925, 2.230) 0.1067
Multivariate Model TD GDS-15 1.166 (1.111, 1.224) <0.0001
GEE: Generalized Estimating Equation; CI: confidence interval; TD: Time Dependent; pRBD: probable REM behavior disorder; DA: dopaminergic agonist; GDS-15: Geriatric Depression Scale 15 Items.