Acoustical breakdown of materials by focusing
of laser-generated Rayleigh surface waves
The MIT Faculty has made this article openly available. Please share how this access benefits you. Your story matters.Citation Veysset, David, A. A. Maznev, István A. Veres, Thomas Pezeril, Steven E. Kooi, Alexey M. Lomonosov, and Keith A. Nelson. “Acoustical Breakdown of Materials by Focusing of Laser-Generated Rayleigh Surface Waves.” Applied Physics Letters 111, no. 3 (July 17, 2017): 031901.
As Published https://doi.org/10.1063/1.4993586
Publisher American Institute of Physics (AIP)
Version Author's final manuscript
Citable link http://hdl.handle.net/1721.1/118639
Terms of Use Creative Commons Attribution-Noncommercial-Share Alike
Acoustical Breakdown of Materials by Focusing of
Laser-Generated Rayleigh Surface Waves
David Veysset
1,2,a), A. A. Maznev
1,2, István A. Veres
3, Thomas Pezeril
4,
Steven E. Kooi
1,2, Alexey M. Lomonosov
5, and Keith A. Nelson
1,2.
1Department of Chemistry, MIT, Cambridge, Massachusetts 02139, USA
2Institute for Soldier Nanotechnologies, MIT, Cambridge, Massachusetts 02139, USA
3Research Center for Non-Destructive Testing GmbH, Altenberger Str. 69, 4040 Linz, Austria 4Institut Molécules et Matériaux du Mans, UMR CNRS 6283, Université du Maine, 72085 Le Mans,
France
5Institute of Physical Chemistry, University of Heidelberg, Im Neuenheimer Feld 253, D-69120
Heidelberg, Germany
Citation: Appl. Phys. Lett. 111, 031901 (2017); doi: 10.1063/1.4993586
View online: http://dx.doi.org/10.1063/1.4993586
View Table of Contents: http://aip.scitation.org/toc/apl/111/3 Published by the American Institute of Physics
Focusing of high-amplitude surface acoustic waves leading to material damage is visualized in an all-optical experiment. The optical set-up includes a lens and an axicon that focuses an intense picosecond excitation pulse into a ring-shaped pattern at the surface of a gold-coated glass substrate. Optical excitation induces a surface acoustic wave (SAW) that propagates in the plane of the sample and converges toward the center. The evolution of the SAW profile is monitored using interferometry with a femtosecond probe pulse at variable time delays. The quantitative analysis of the full-field images provides direct information about the surface displacement profiles, which are compared to calculations. The high stress at the focal point leads to the removal of the gold coating and, at higher excitation energies, to damage of the glass substrate. The results open the prospect for testing material strength on the microscale using laser-generated SAWs.
Surface acoustic waves (SAWs), also known as Rayleigh waves, play an important role in many areas of science and technology from seismology1 to signal processing2 and non– destructive material characterization.3–5 Similarly to other types of waves, SAWs can be focused to a small spot, ultimately limited by the wavelength. Focusing can, for instance, be performed by a lens–shaped thin film structure or a curved interdigital transducer (IDT).6 The enhancement of the SAW amplitude by focusing has found applications in the design of acousto-optic devices7,8 and, more recently, in microfluidics.9–11 The use of laser pulses to generate SAWs makes it possible to achieve focusing by shaping the excitation laser beam12,13
without any structures on the surface. One can imagine that focused SAWs may be able to reach the limit of the material strength and cause damage. This aspect of SAW focusing has not hitherto been explored. The fact that high-amplitude SAWs can cause material damage has generally been well recognized. For example, SAWs are the leading cause of damage produced by earthquakes.14 On the microscale, brittle fracture by SAWs has been previously observed in the nonlinear regime of SAW propagation,15–17 wherein the increase in stress at the surface occurred due to the formation of “surface shock waves” without the aid of focusing. With this approach, multiple randomly located linear cracks were formed in the path of the SAW propagation. By contrast, SAW focusing is expected to produce material damage at a well-defined location.
In this work, high-amplitude focused SAWs are generated by ring-shaped laser pulses in an arrangement resembling the one that was used to focus shock waves in a thin liquid layer18,19 and in highly–ordered pyrolytic graphite.20 The “acoustical breakdown” takes place at the focal point in the linear regime of the SAW propagation. The magnitude of stress in the material is quantified based on interferometric images of the surface displacement field.
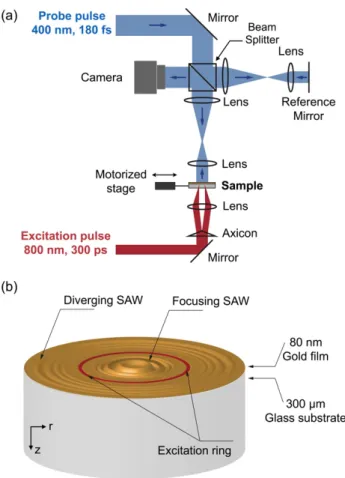
The experimental setup and sample configuration are shown schematically in Fig. 1. A 300-picosecond, 800-nm wavelength, laser pulse with energy varying from 80 µJ to 2.4 mJ was focused onto the surface of a 300 µm-thick glass substrate (Schott D263) sputter-coated with an 80 nm-thick gold film. Using a 0.5° axicon prism and a lens with a 30-mm focal length, the excitation pulse was focused into a ring with a 200-µm diameter and a 10-µm width. The gold coating was ablated from the glass substrate at the laser ring location launching surface acoustic waves. An inward-propagating surface wave converged towards the center whereas an outward-propagating wave diverged out of the excitation ring. A variably delayed 180-fs duration, 400-nm wavelength probe pulse derived from the same laser system was used to record interferometric images of the sample surface using a Michelson interferometer. The reference mirror of the interferometer was tilted in order to obtain parallel interference fringes with a desired fringe density of about 250 fringes/mm.
FIG. 1. Optical setup and sample configuration. (a) The axicon-lens combination is used to focus the excitation into a ring on the gold-coated surface of the glass substrate. The surface is imaged onto a CCD camera at 10× magnification using a variably-delayed femtosecond probe pulse and a Michelson interferometer configuration to obtain interferometric images of the surface displacement. (b) Sample configuration schematically showing the ring-shaped excitation and propagation of focusing and diverging SAWs.
Figure 2 shows a typical set of interferometric images captured at an excitation fluence of 2.5 J/cm2 at six representative delays showing the convergence of the SAW and subsequent divergence after passing through the focal point. We note that this is not a real-time sequence, as each image was taken using a separate laser shot, and the sample was translated laterally between the shots to move the laser spot to an undamaged area of the sample. Fringes of constant phase bended as the surface was displaced vertically and the optical path, directly proportional to the surface displacement, was changed; hence the SAW profiles were directly observable in the images.
FIG. 2. Interferometric images of propagating SAWs recorded with varying delay between the excitation pulse and the imaging probe pulse at a laser excitation fluence of 2.5 J/cm2. (a) CCD image
at a delay of 15.6 ns. The propagating SAW is characterized by a bend in the interference fringes. The directions of the SAW propagation, inward and outward, are indicated by yellow arrows. The dark ring is formed due to the removal of the gold coating along the laser irradiation ring. (b-f) Cropped CCD images at increasing delays show focusing (b-d) of the SAW followed by divergence (e,f). After the convergence of the SAW, a black spot appears at the focal point revealing damage in the gold film caused by the SAW (e,f).
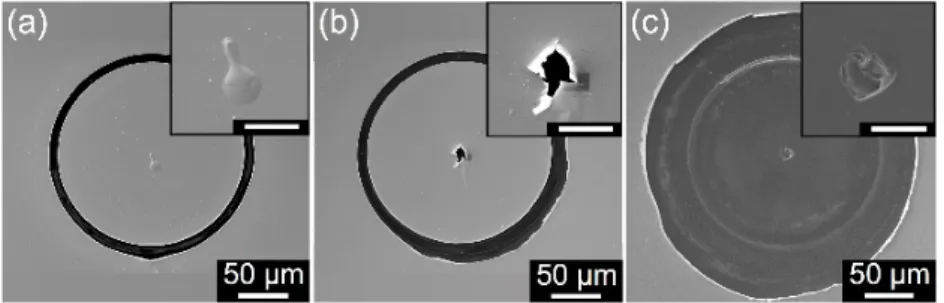
As shown in Fig. 2(e), a dark area appeared at the focal point after the passage of the SAW, revealing damage of the gold film. Permanent damage was also caused by direct laser exposure and is evidenced in Fig. 2(a) by a dark ring area (now bare glass) where the laser was focused. These damage features were confirmed by post-mortem scanning electron microscope (SEM) images shown in Fig. 3. At a smaller excitation energy and therefore smaller acoustic amplitude, the gold coating at the center delaminated from the glass substrate but was not removed (Fig 3(a)). The resulting bump at the center, measured with a surface profilometer,
showed a height of about 270 nm. At a fluence of 2.5 J/cm2 the center portion of the gold film was removed, in agreement with time-resolved images in Fig. 2(e,f). With increased laser excitation energy, the damage was not restricted to the gold layer but extended to the glass substrate. A higher acoustic amplitude led to a more dramatic acoustical breakdown of the glass at the focus (Fig. 3(c)). In addition to crater formation, the entire gold film inside the laser ring was removed from the substrate. A set of time-resolved interferometric images at high laser fluences has not yet been obtained, as the extensive gold film damage substantially worsened the image quality.
FIG. 3. Post–mortem SEM micrographs for three different excitation fluences: (a) 1.3 J/cm2, (b) 2.5 J/cm2, and (c) 38.2 J/cm2. Insets are close–up views of the center region.
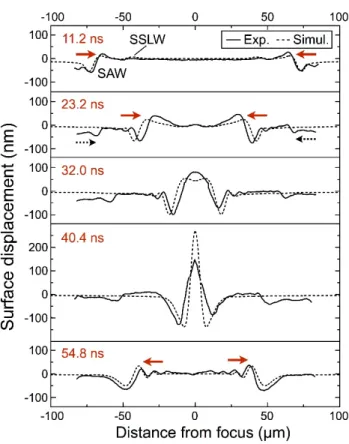
The vertical surface displacement field, 𝑢"(𝑥, 𝑦), of the gold–coated substrate can be obtained from interferometric images by comparing the fringe patterns before and after excitation. The relationship ∆𝜑 4𝜋 = 𝑢" 𝜆 was used to extract the displacement profile quantitatively where ∆𝜑, 𝑢", and 𝜆 denote the phase shift with respect to the reference image, the surface displacement, and the wavelength of the probe beam, respectively. The surface displacement profile was extracted for multiple delays along a ring diameter, taking advantage of the cylindrical symmetry of the experiment21 (see supplementary material for more details). The surface displacement profiles extracted from the images are presented in Fig. 4 for five representative delays for a laser excitation fluence of 2.5 J/cm2. As expected, the amplitude of the SAW increased as it focused towards the center: from a peak–to–peak value of 80 nm at 11.2 ns to 270 nm near the center at 40.4 ns. Dispersion of SAWs due to the presence of the 80 nm–thick gold layer was clearly visible from the surface displacement plots, particularly at later times. For example, at a delay of 32.0 ns (Fig. 4), the lower frequency component of the acoustic wave reached the center while the highest observable frequencies were still tens of microns away from it. It is also worth noting that, simultaneously with the SAW generation, a blast wave was generated and propagated in the air above the sample. The density change in the air, caused by this blast pressure wave, also induced a phase shift in the probe beam and was therefore detected in the deformed fringe pattern. However, the measurements of the SAW were not affected by the blast wave as the latter travelled at a lower speed than the SAW (at approximately 1.1 km/s).
FIG. 4. Measured (solid curves) and calculated (dashed curves) vertical surface displacement profiles at different delays at 2.5 J/cm2 excitation fluence. The SAW propagation direction is indicated by red
solid arrows. The weaker surface skimming longitudinal wave (SSLW) is also detected. Positive values correspond to outward displacements. The blast wave contribution to the phase shift is indicated by dotted black arrows.
While interferometric images yield SAW profiles in terms of the surface displacement, the stress distribution causing material damage is not directly observable. In order to determine the stresses associated with focusing SAWs, numerical simulations were carried out. The SAW propagation was simulated using the finite element time domain method with a commercial software package PZFlex. The simulated surface displacements shown in Fig. 4 yield good agreement with the experimental data. The discrepancies arise from uncertainty in the experimentally measured time delays; this is particularly noticeable in the 40.4 ns profile (close to the maximum focusing) when the amplitude at the center is very sensitive to the time delay (see supplementary material). Having established that the simulations reproduce the surface displacement measured in the experiment, we can compute the stresses in the sample which are not accessible to experimental observations.
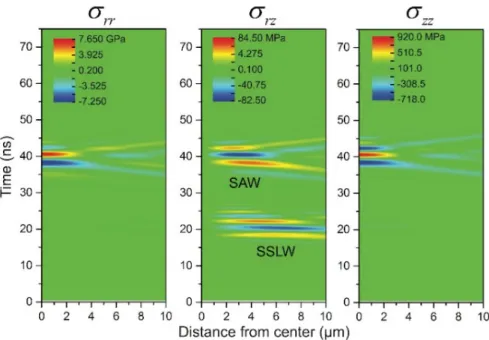
The time evolution of the stresses close to the focus computed at the film-substrate interface for the last numerical element in the gold film is shown in Fig. 5. (The corresponding strain maps presented in the supplementary material yielded strain rates up to 6×10⁷ s-1.) We
believe that the delamination of the gold film is caused by the tensile stress szz which reaches
its maximum value of 0.92 GPa at 40.4 ns. The in-plane tensile stress srr, reaching a much
greater value in excess of 7 GPa, cannot cause delamination but it can fracture the gold film thus facilitating its removal. Relatively small values of szz are due to the fact that its value at
the free surface ought to be identically zero, and the interface is located at a small depth compared to the SAW wavelength (the same is true to srz; in addition, the latter is identically
value of 2.4 GPa is reached inside the glass substrate at a depth of 3.5 µm. It should be noted that both srr and szz greatly exceed the static tensile strength of both gold and borosilicate glass
(30 to ~400 MPa for gold depending on film thickness and 20-200 MPa for glass).22–24 However, in our case the tensile stress is only applied for about a nanosecond. It is known, largely from shock spallation experiments,25–27 that the dynamic material strength can greatly exceed the static strength: for example, it was found that the spall strength of copper exceeded 10 GPa and approached the theoretical limit predicted by the equation of state at strain rates over 108 s-1;27 in another shock spallation experiment, soda lime glass was found to withstand tensile stress up to 3 GPa without damage.25
FIG. 5. Stresses computed close to the focus 𝑟 ≤ 10 𝜇𝑚 at the film-substrate interface for the last numerical element in the gold film −67 𝑛𝑚 ≤ 𝑧 ≤ −80 𝑛𝑚 . The scale bars show the maximum and minimum values reached for each stress component.
Unlike in previous studies of material damage by high-amplitude nonlinear SAWs,15– 17 in our experiment the SAW propagation was in the linear regime as indicated by a good
agreement between the experiment and the simulations based on the linear model. The absence of nonlinear effects is explained by the SAW dispersion caused by the gold film. The linear SAW propagation regime has an advantage in terms of quantifying the stress magnitude. Indeed, in the nonlinear regime, the formation of a shock front leads to a singularity in the in-plane stress at the surface.15–17 Quantifying the stress magnitude requires the knowledge of the width of the shock front which cannot be measured due to the limited spatial resolution of the optical probe. In the linear regime, this difficulty does not arise: once the simulations match the measured displacement profile, we have a high confidence in the calculated stress pattern.
testing approaches proposed for preventing damage by earthquake-generated SAWs28 in a microscale experiment. Studying SAW focusing on an uncoated surface in the nonlinear regime presents yet another avenue for future research.
See supplementary material for image analysis procedure, materials properties, simulations details, strain maps, and effect of time delay adjustment.
The authors would like to thank Ryan Duncan, Doug Shin, Lingping Zeng, and Jeff Eliason for their help in the sample characterization. This work was supported in part by the U. S. Army Research Laboratory and the U. S. Army Research Office through the Institute for Soldier Nanotechnologies, under contract number W911NF-13-D-0001. The authors acknowledge financial support from CNRS (Centre National de la Recherche Scientifique) under grant Projet International de Coopération Scientifique.
References
1 A. Mordret, T.D. Mikesell, C. Harig, B.P. Lipovsky, and A. Prieto, Sci. Adv. 1, e1501538
(2015).
2 C. Campbell, Surface Acoustic Wave Devices and Their Signal Processing Applications
(Academic Press, Boston, MA, 1989).
3 A.G. Every, Meas. Sci. Technol. 13, R21 (2002).
4 J.A. Rogers, A.A. Maznev, M.J. Banet, and K.A. Nelson, Annu. Rev. Mater. Sci. 30, 117
(2000).
5 B. Sherman, H.-C.C. Liou, and O. Balogun, J. Appl. Phys. 118, 135303 (2015). 6 I.M. Mason, J. Acoust. Soc. Am. 53, 1123 (1973).
7 H.E. Engan, T. Myrtveit, and J.O. Askautrud, Opt. Lett. 16, 24 (1991).
8 M.M. de Lima, F. Alsina, W. Seidel, and P. V. Santos, J. Appl. Phys. 94, 7848 (2003). 9 M. Tan, J.R. Friend, and L.L. Yeo, Phys. Rev. Lett. 103, 24501 (2009).
10 Y. Ai and B.L. Marrone, Microfluid. Nanofluidics 13, 715 (2012).
11 G. Destgeer, S. Im, B. Hang Ha, J. Ho Jung, M. Ahmad Ansari, and H. Jin Sung, Appl. Phys.
Lett. 104, 023506 (2014).
12 A.A. Kolomenskii, S. Jerebtsov, and H. Schuessler, Opt. Lett. 30, 2019 (2005). 13 S.D. Sharples, M. Clark, and M.G. Somekh, Ultrasonics 41, 295 (2003). 14 H. Kawase, Seismol. Res. Lett. 67, 25 (1996).
15 V. Kozhushko, A. Lomonosov, and P. Hess, Phys. Rev. Lett. 98, 195505 (2007).
16 G. Lehmann, A.M. Lomonosov, P. Hess, and P. Gumbsch, J. Appl. Phys. 94, 2907 (2003). 17 A.M. Lomonosov and P. Hess, Phys. Rev. Lett. 89, 95501 (2002).
18 T. Pezeril, G. Saini, D. Veysset, S. Kooi, P. Fidkowski, R. Radovitzky, and K.A. Nelson,
Phys. Rev. Lett. 106, 214503 (2011).
19 D. Veysset, A.A. Мaznev, T. Pezeril, S. Kooi, and K.A. Nelson, Sci. Rep. 6, 24 (2016). 20 D. Veysset, T. Pezeril, S. Kooi, A. Bulou, and K.A. Nelson, Appl. Phys. Lett. 106, 161902
(2015).
21 D. Veysset, A.A. Maznev, G. Saini, S.E. Kooi, T. Pezeril, and K.A. Nelson, in AIP Conf.
Proc. 1426 (2012), pp. 1597–1600.
22 E.M. Savitskii and A. Prince, editors , Handbook of Precious Metals (1989).
23 J.-H. Kim, A. Nizami, Y. Hwangbo, B. Jang, H.-J. Lee, C.-S. Woo, S. Hyun, and T.-S. Kim,
Nat. Commun. 4, 2520 (2013).
24 Data provided for the glass by the manufacturer. Schott Technical Glasses.
Physical and technical properties. www.us.schott.com.
25 Z. Rosenberg, D. Yaziv, and S. Bless, J. Appl. Phys. 58, 3249 (1985). 26 D.E. Grady, J. Mech. Phys. Solids 36, 353 (1988).
27 E. Moshe, S. Eliezer, Z. Henis, M. Werdiger, E. Dekel, Y. Horovitz, S. Maman, I.B.
Goldberg, and D. Eliezer, Appl. Phys. Lett. 76, 1555 (2000).
Supplementary Material
Phase extraction
The pixel intensity is extracted from raw CCD images over a 4-µm width (~ 1 fringe period) along a diameter that is parallel to a fringe going through the center (see Fig S1(a)). The pixel intensity is then fitted with a sinusoidal function over the scan width in order to retrieve the phase (see Fig S1 (b,c)). The operation is repeated to obtain the phase for each point along the selected diameter. The phase profile is finally subtracted from the reference phase profile, which is obtained following the same procedure.
FIG. S1. Raw interferometric image at a time delay of 23.2 ns (from Fig. 2(b)). The orange rectangle marks the area over which the pixel intensity is extracted. (b) Pixel intensity along the selected diameter over a 4-µm width. (c) Pixel intensity profile at -30 µm extracted from (b) (solid line) and its corresponding fitted profile (dashed line).
Because the phase shift is determined by following the intensity profile of the image along a ring diameter over a fringe period (4 µm), the surface displacement is not extracted at the center of the ring when the radius of curvature of the deformation falls below 4 µm as, for instance, in Fig. 2(b) for a delay of 40.4 ns. In such a case, the first procedure explained above is not accurate at the center of focus as a constant phase is assumed prior to fitting over the scan width. We take advantage of the axial symmetry to retrieve the phase information along the diameter that is perpendicular to the fringes. From the pixel intensity along that diameter (see Fig S2(a)), a phase increase of π is accounted for at each extremum coordinate, yielding to Fig S2(b). The phase profile is then subtracted from the reference phase that is measured likewise. The resulting displacement profile, using this second procedure, is shown in Fig S2(c, top plot) and shows good agreement with the profile obtained using the first approach described above (Fig S2(c, bottom plot)). The experimental points obtained with the second procedure are used to complete the missing data at the center for the profile at 40.4 ns only.
FIG. S2. (a) Pixel intensity profile extracted along a diameter (white dashed line) perpendicular to the fringes of interference. (b) Phase accumulation retrieved from (a) over the selected diameter. (c) (top profile) Surface displacement obtained using the phase information shown in (b) compared with the surface displacement obtained using the first procedure (bottom profile).
Materials properties used for simulations
Table I lists material properties and other parameters used in the simulations. The gold film thickness was measured using a profilometer and yielded a thickness of 80 nm. The materials properties for the gold film were found in the literature.1 The elastic properties of the glass substrate were determined from the longitudinal and Rayleigh wave velocities measured independently in our lab. The longitudinal acoustic velocity of the substrate cL was measured
using a picosecond acoustic interferometry method.2 The substrate Rayleigh wave velocity was measured using the laser-induced transient grating technique.3 The transverse acoustic velocity of the substrate cS was then calculated from the longitudinal and Rayleigh velocities.
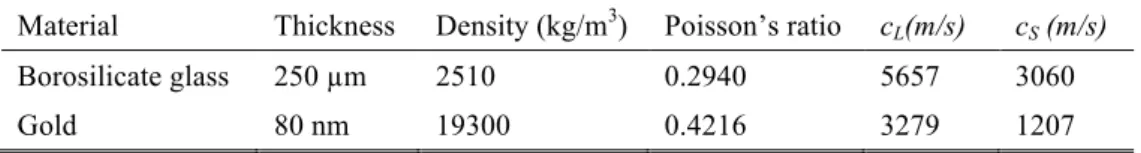
TABLE I. Materials properties.
Material Thickness Density (kg/m3) Poisson’s ratio cL(m/s) cS (m/s) Borosilicate glass 250 µm 2510 0.2940 5657 3060
vertical force was applied to the surface at 𝑡 = 0 with a Gaussian spatial distribution given by 𝑓 𝑟 = 𝐴×𝑒C(DCE)F GF, where 𝐴 = 25 𝐺𝑃𝑎, 𝑑 = 4.0 𝜇𝑚, 𝑅 = 200 𝜇𝑚, and a temporal
distribution given by 𝑔 𝑡 = 𝑒COF PF
, where 𝑇 = 100 𝑝𝑠. The sample was modeled on an orthogonal grid (𝑟, 𝑧) with element dimensions of 40 nm ´ 13 nm. The magnitude of the vertical force was set to match the wave amplitude at the first experimental point
𝑡 = 11.2 𝑛𝑠 .
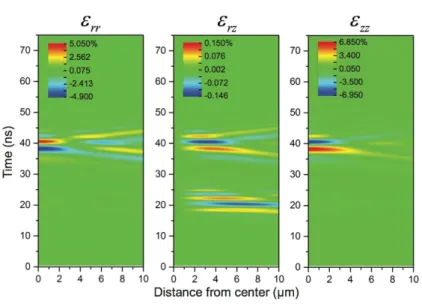
Strain maps corresponding to stress maps shown in Fig. 5.
FIG. S3. Strains computed close to the focus 𝑟 ≤ 10 𝜇𝑚 at the film-substrate interface for the last numerical element in the gold film −67 𝑛𝑚 ≤ 𝑧 ≤ −80 𝑛𝑚 for a laser excitation fluence of 2.5 J/cm2. The scale bars show the maximum and minimum values reached for each strain component.
Effect of the time delay adjustment on the simulation of the 40.4 ns profile
The larger disagreement between the experimental and simulated profiles at 40.4 ns results from the fact that SAW amplitude varies quickly at the center of focus. Consequently, a timing discrepancy between the experimentally-measured time delay and the simulated delay significantly deteriorates the match between the profiles. This can be manually corrected by selecting a simulated profile at a close but slightly different time delay. As shown in Fig. S4, the experimentally-measured profile at 40.4 ns matches better the calculated profile at 41.5 ns.
FIG. S4. Measured (solid curve) and calculated (dashed curves) surface displacement profiles at 40.4 ns and 41.5 ns for a 2.5 J/cm2 excitation fluence.
Supplementary References
1 G. Simmons and H. Wang, Single Crystal Elastic Constants and Calculated Aggregate
Properties: A Handbook, 2nd ed. (M.I.T. Press, 1971).
2 H.N. Lin, R.J. Stoner, H.J. Maris, and J. Tauc, J. Appl. Phys. 69, 3816 (1991).
3 J.A. Rogers, A.A. Maznev, M.J. Banet, and K.A. Nelson, Annu. Rev. Mater. Sci. 30, 117