HAL Id: inserm-00646245
https://www.hal.inserm.fr/inserm-00646245
Submitted on 29 Nov 2011HAL is a multi-disciplinary open access archive for the deposit and dissemination of sci-entific research documents, whether they are pub-lished or not. The documents may come from teaching and research institutions in France or abroad, or from public or private research centers.
L’archive ouverte pluridisciplinaire HAL, est destinée au dépôt et à la diffusion de documents scientifiques de niveau recherche, publiés ou non, émanant des établissements d’enseignement et de recherche français ou étrangers, des laboratoires publics ou privés.
Improvement of protein structure comparison using a
structural alphabet.
Agnel Praveen Joseph, Narayanaswamy Srinivasan, Alexandre de Brevern
To cite this version:
Agnel Praveen Joseph, Narayanaswamy Srinivasan, Alexandre de Brevern. Improvement of protein structure comparison using a structural alphabet.. Biochimie, Elsevier, 2011, 93 (9), pp.1434-45. �10.1016/j.biochi.2011.04.010�. �inserm-00646245�
Improvement of protein structure comparison using a
structural alphabet
Agnel Praveen Joseph 1,2,3,
*, N. Srinivasan 4
& Alexandre G. de Brevern 1,2,3
1
INSERM, UMR-S 665, Dynamique des Structures et Interactions des Macromolécules Biologiques (DSIMB), 6, rue Alexandre Cabanel, 75739 Paris cedex 15, France.
2
Université Paris Diderot - Paris 7, 6, rue Alexandre Cabanel, 75739 Paris cedex 15, France.
3
Institut National de la Transfusion Sanguine (INTS), 6, rue Alexandre Cabanel, 75739 Paris cedex 15, France.
4 Molecular Biophysics Unit, Indian Institute of Science, Bangalore 560012, India.
Short title: improved Protein Block Alignment
* Corresponding author:
mailing address: Joseph A.P., INSERM UMR-S 665, Dynamique des Structures et Interactions des Macromolécules Biologiques (DSIMB), Université Denis Diderot - Paris 7, INTS, 6, rue Alexandre Cabanel, 75739 Paris cedex 15, France
E-mail: [email protected] Tel: +33(1) 44 49 31 14
Fax: +33(1) 47 34 74 31
Key words: amino acid; structural alphabet; Protein Blocks; semi-global alignment, anchor-based alignment, protein folds, structural comparison, protein structure mining, Protein Data Bank.
Abstract
The three dimensional structure of a protein provides major insights into its function. Protein structure comparison has implications in functional and evolutionary studies. A structural alphabet (SA) is a library of local protein structure prototypes that can abstract every part of protein main chain conformation. Protein Blocks (PBs) is a widely used SA, composed of 16 prototypes, each representing a pentapeptide backbone conformation defined in terms of dihedral angles. Through this description, the 3D structural information can be translated into a 1D sequence of PBs.
In a previous study, we have used this approach to compare protein structures encoded in terms of PBs. A classical sequence alignment procedure based on dynamic programming was used, with a dedicated PB Substitution Matrix (SM). PB-based pairwise structural alignment method gave an excellent performance, when compared to other established methods for mining.
In this study, we have (i) refined the SMs and (ii) improved the Protein Block Alignment methodology (namely iPBA). The SM was normalized in regards to sequence and structural similarity. Alignment of protein structures often involves similar structural regions separated by dissimilar stretches. A dynamic programming algorithm that weighs these local similar stretches has been designed. Amino acid substitutions scores were also coupled linearly with the PB substitutions. iPBA improves (i) the mining efficiency rate by 6.8% and (ii) more than 82% of the alignments have a better quality. A higher efficiency in aligning multi-domain proteins could be also demonstrated. The quality of alignment is better than DALI and MUSTANG in 81.3% of the cases. Thus our study has resulted in an impressive improvement in the quality of protein structural alignment.
Introduction
The functional properties of a protein depend mainly on its three-dimensional (3D) structure. A protein performs its function by interaction with ligands or other proteins with the help of its 3D structure. Comprehensive understanding of the biological role of a protein requires a good knowledge of its structure {Baker, 2001 #9; Byers, 2007 #109}. For instance, many drug molecules have been designed with the help of information on the structure of the protein target {Leach, 2007 #1; Scapin, 2006 #3; Verlinde, 1994 #2}.
The knowledge of the protein folds necessitates development of methods and tools to compare and classify them. Comparing protein structures helps also in deriving evolutionary relationships between proteins, this is extremely helpful when the sequence comparison method fails (e.g., very low sequence identity between related proteins) {Bhaduri, 2004 #7; Marti-Renom, 2001 #5; Mizuguchi, 1998 #4; Sujatha, 2001 #8; Agarwal, 2009 #119}. It is the basis of many protein threading approaches. For the study of sequence-structure relationships, structure comparison has a significant role {Akutsu, 1999 #12; Standley, 2001 #11}. Structural alignments are also used in the analysis of specific functional roles and in flexibility studies {Baker, 2001 #9; Skolnick, 2000 #10}.
Nonetheless, the alignment of protein structures is far from being a trivial task. Defining and quantifying similarity of two protein structures is difficult and no universally similarity accepted measure of has been defined {Gibrat, 1996 #14; Hasegawa, 2009 #16; Koehl, 2001 #13; Novotny, 2004 #15}. Several structural properties are being used to carry out structure comparison. Approaches like rigid body transformation, fragment assembly and double dynamic programming give an optimal set of residue equivalences {Hasegawa, 2009 #16}. Popular methods include DALI {Holm, 1993 #18}, SSAP {Taylor, 1989 #28} and CE {Shindyalov, 1998 #24}. They utilize a reduced representation of backbone conformation in terms of distance matrices. In these methods, the global alignment is obtained by dynamic
programming and/or Monte Carlo optimization techniques. Most of the structure comparison methods work by optimizing certain structural measures; they usually have a high computational cost.
Depending on the measure of quantifying structural similarity and the method used, there are several ways in which two proteins can be aligned {Feng, 1996 #48; Godzik, 1996 #49}. Unlike sequence alignment, it is difficult to obtain a global convergence as different regions are tightly associated as part of the same 3D structure and hence a change in the alignment in one part affects the rest of the alignment. Some methods like FlexProt {Shatsky, 2002 #50} and FATCAT {Ye, 2003 #23} carry out flexible superposition by introducing twists between aligned fragment pairs.
With the considerable increase in the number of protein structures solved, the need for a fast and efficient structure comparison technique has increased. A common strategy for obtaining an initial alignment of protein structures is to define the 3D structure as a series of secondary structural elements (SSEs) {Gibrat, 1996 #14; Harrison, 2002 #37; Krissinel, 2004 #33; Lu, 2000 #51}. The three-state secondary structure representation however does not approximate every local structure in proteins. Indeed 50% of the residues remain associated to coil state which encompasses very different backbone conformations. Different groups have generated set of local structure prototypes, which could give an approximation of all local structures in proteins. These sets of protein fragments are called Structural Alphabets (SAs) {de Brevern, 2000 #59; Kolodny, 2002 #60; Micheletti, 2000 #55; Rooman, 1990 #56; Schuchhardt, 1996 #57; Unger, 1989 #58; Sander, 2006 #99; Tung, 2007 #43; Ku, 2008 #61; Yang, 2008 #45}. Abstraction of protein structures in terms of SA transform 3D information into a 1D sequence of alphabets {Offmann, 2007 #110}. Thus the 3D superposition of protein structures can be performed with an alignment of sequences (i.e., protein structures encoded in terms of structural alphabets). These alignments, which are similar to amino acid sequence
alignments, can be used to compare three dimensional structural data. A few methods of protein structure comparison, based on structural alphabets, have been developed, (e.g., {Friedberg, 2007 #42; Guyon, 2004 #40; Ku, 2008 #61; Sacan, 2008 #41; Tung, 2007 #43; Wang, 2008 #44; Yang, 2008 #45}). These approaches are proved to be significantly faster, when compared to those methods based on optimization of 3D structural measures. However they also have the classical limitations of sequence alignment approaches, in terms of accuracy.
A structural alphabet consisting of 16 pentapeptide motifs called Protein Blocks (PBs) was developed in our laboratory {de Brevern, 2005 #62; de Brevern, 2000 #59}. Each of the prototypes describe a vector of 8 dihedral angles and are labeled by a character alphabet ranging from a to p. This structural alphabet allows a reasonable abstraction of local protein 3D structures with a root mean square deviation (rmsd) of about 0.42 Å {de Brevern, 2005 #62}. PB based approaches have been used to perform local structure prediction {de Brevern, 2000 #59; de Brevern, 2004 #64; Etchebest, 2005 #67; Zimmermann, 2008 #70; Dong, 2008 #66; Benros, 2009 #63; De Brevern, 2007 #65; Li, 2009 #68; Tyagi, 2009 #69; Joseph, 2010 #111}. Several other applications based on the PB structural alphabet have also given successful results {Dudev, 2007 #71; Faure, 2009 #72;; Tyagi, 2009 #69; Tyagi, 2008 #75; Zuo, 2009 #104}, see {Joseph, 2010 #127} for a recent review.
To develop a structure comparison algorithm based on PBs, a substitution matrix (SM) {Tyagi, 2006 #77} was generated based on all PB substitutions observed in pairwise structure alignments in PALI dataset {Balaji, 2001 #76; Gowri, 2003 #78}. This SM was used with simple dynamic programming approaches to develop an efficient and fast method for fast pairwise structural comparison of proteins {Tyagi, 2008 #75; Tyagi, 2006 #79}. The performance of PB based structure comparison (PBALIGN) was assessed by checking the efficiency for mining homologues and for the quality of structural alignment. In all these
assessment procedures, the performance of PBALIGN was impressive. It had outperformed other established methods {Carpentier, 2005 #30; Gibrat, 1996 #14; Holm, 1993 #18; Krissinel, 2004 #33; Lu, 2000 #51; Shindyalov, 1998 #24; Singh, 1997 #39; Ye, 2003 #23; Kawabata, 2003 #101; Kleywegt, 1997 #102}.
Here we improve the efficiency of our structural alignment algorithm by (i) refining the substitution matrix and (ii) designing an improved dynamic programming algorithm. Indeed, the distributions of pairwise domain alignments across different SCOP {Murzin, 1995 #46} classes, folds, superfamilies and families in PALI database {Balaji, 2001 #76; Gowri, 2003 #78; Sujatha, 2001 #8} are not uniform. The bias in the substitution scores resulting from a redundant dataset can be minimized by carrying out normalizations based on the sequence or structural similarity. Furthermore, a global alignment based on Needleman-Wunsch algorithm cannot distinguish local regions of similarity from the dissimilar stretches. Sequence alignment methods that can weigh local stretches of similarity are found to give better alignments with a few misaligned pairs {Bray, 2003 #85; Brudno, 2003 #84; Chakrabarti, 2004 #86; Huang, 2006 #80; Morgenstern, 2004 #81; Needleman, 1970 #82; Notredame, 2000 #83}. Use of such approaches had helped to improve the quality of alignments generated and the efficiency in mining. This improved structure comparison method is named iPBA (improved Protein Block Alignment).
Methods
Protein Blocks. Protein Blocks (PBs) correspond to a set of 16 local prototypes, labeled from a to p, of 5 residues length described based on the , dihedral angles. They were obtained by an unsupervised classifier similar to Kohonen Maps {Kohonen, 2001 #97} and hidden Markov models {Rabiner, 1989 #98}. The PBs m and d are prototypes for the central region of α-helix and β-strand, respectively. PBs a through c primarily represent the
N-cap of β-strand while e and f correspond to C-caps; PBs g through j are specific to coils, PBs k and l correspond to N cap of α-helix while PBs n through p to C-caps. PBs have been assigned using in-house Python software (available upon request), similar assignment is carried out by the PBE web server (http://bioinformatics.univ-reunion.fr/PBE/) {Tyagi, 2006 #79}.
Dataset of structural alignments. PALI datasets {Balaji, 2001 #76; Gowri, 2003 #78; Sujatha, 2001 #8} were used to analyze the protein structure alignments. The earlier version of PALI used by Tyagi and co-workers {Tyagi, 2006 #77} for generation of PB substitution matrix was based on STAMP {Russell, 1992 #88} alignments. The recent version of PALI dataset V 2.8a {Balaji, 2001 #76; Gowri, 2003 #78; Sujatha, 2001 #8} consists of 1922 domain families comprising of 231022 alignment pairs. Structural alignments in this version are generated using MUSTANG {Konagurthu, 2006 #89}.
Substitution matrices. The pairwise structural alignments were first translated to PB sequence alignments. The PB pairs occurring in the structurally conserved regions (Cα atoms within 3 Å) were counted for calculating the substitution frequencies. As in our previous work {Tyagi, 2006 #79}, the method presented by Johnson and Overington {Johnson, 1993 #90} was adopted for calculating log odd scores from raw frequencies:
M i M j j i M i j i M j j i j i e j i N N N N S 1 1 , 1 , 1 , , , log (1)where Si,j is the substitution weight and Ni,j is the raw substitution frequency between
PB i and PB j, M is the total number of different PBs (i.e., 16).
Improvement of substitution matrices. The substitution matrix used in our previous works {Tyagi, 2008 #75; Tyagi, 2006 #77; Tyagi, 2006 #79}, named here as Orig, was generated from an entire alignment dataset that was not normalised. Here, different normalisation and selection criteria based on sequence and structure similarities were used for generating non-redundant sets of alignments used to build substitution matrices (SMs).
(i) An updated matrix was generated(ALL). It corresponds to all the recent protein structural alignments in the recent version of PALI database.
(ii) A normalisation of substitution frequencies has been carried out based on the number of pairwise alignments in a SCOP family (Fnorm). Here, the substitution frequencies from each family is normalised with the size of the family. Hence, each SCOP family have the same weight for the computation of the substitution matrix.
(iii) Following the same idea, further normalisation of substitution frequencies have been performed taking both into account the number of pairwise alignments in a SCOP family and the number of families in a class (CFnorm).
(iv) An SM was generated from a dataset containing only domain pairs sharing a sequence identity less than 40% (IDnorm). This resulted in 61,787 domain alignment pairs from 1,792 families.
Finally, different criteria were combined. (v) The substitution frequencies were obtained from the dataset (see (iv) above) where no domains pairs have sequence identity greater than 40%, and the frequencies were further normalised based on the number of alignments in each domain family (IDFnorm).
(vi) In the same way, with the dataset obtained using a sequence identity cutoff of 40%, a normalisation has been done further based on the sizes of different SCOP classes, this
SM is named IDCnorm.
Test Dataset. The different modifications to the alignment approach were tested with a smaller dataset composed of highly diverged domain pairs. The dataset was chosen to have largely uniform representation from different superfamilies and present a good difficult test set for mining.
From each SCOP superfamily in the PALI dataset (with two or more families), two families were randomly chosen and from each of these families, a domain pair with sequence identity less than 40%, was chosen. It represents 1,050 proteins (comprising of 188,760 residues). This dataset has been used in this study for comparing mining efficiency and the quality of structural alignments.
SCOP database version 1.73, filtered at a sequence identity cutoff of 95%, was used to check the efficiency of our approach in mining homologues distant from the query structure. This was used while comparing the performance of our approach with other available methods.
3D structural alignment. Profit (version 3.1) {Martin, 2010 #95} performs least squares fit of protein structures based on the residue equivalences in a given sequence alignment. As in our previous work, this software was used to obtain the 3D alignment of two protein structures (based on a PB-based sequence alignment). The PB sequence alignment was first translated into an amino acid sequence alignment. This is given as input for Profit for reading the aligned pairs of residues. The fit is performed on the aligned residue pairs and the Root Mean Square deviation (rmsd) is calculated. Profit can also perform a refinement of the fit based on an iterative update of the residue pairs within a given distance (3.0 Å).
in the work of Zemla et al {Zemla, 2003 #91; Zemla, 2007 #92} was used to indicate the quality of structural alignment. rmsd cut-offs of 1, 2 , 3, 4 and 5 Å were used for calculating the Local Continuous Segments (LCS) while distance cut off from 0.5 to 8 Å (steps of 0.5 Å) were used for the Global Distance Test (GDT).
LGA_S score = ω *GDT + (1- ω)*LCS (2)
A weighting factor ω of 0.75 was used for the GDT while calculation the LGA_S score {Zemla, 2007 #92}.
iPBA: Anchor based PB sequence alignment. In the earlier version (PBALIGN) {Tyagi, 2008 #75; Tyagi, 2006 #77}, classical Needleman - Wunsch {Needleman, 1970 #82} and Smith - Waterman {Smith, 1981 #93} dynamic programming approaches were used to perform PB alignment (3D structures were translated in terms of PB sequences and aligned using dedicated SM). Linear gap penalties were used; gap penalty values were -3.0 and -5.0 for global and local alignments respectively.
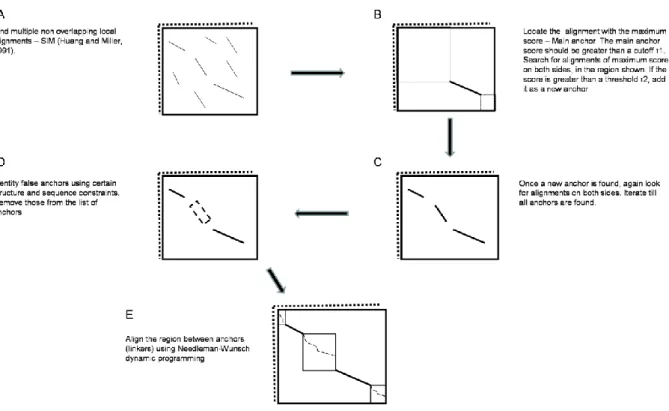
Use of variable gap penalties for aligning conserved and variable stretches can improve the quality of alignment. A global alignment approach however, does not permit variability in gap penalties for different segments of the alignment. Semi-global alignments were carried out without using gap penalties for the alignment of the ends of the sequences. A method to extract a set of local alignments with a high alignment score can help in finding conserved stretches in the sequences. For identifying an optimal set of non-overlapping local alignments, the SIM algorithm developed by Huang and Miller {Huang, 1991 #94} was used (see Figure 1A). This algorithm uses linear space dynamic programming approach for alignment. The local alignment with the maximum score was chosen as the main anchor if the score is greater than a specified threshold (1) (see Figure 1B). Other regions of local
Figure 1C). At each iteration, the regions between the current set of anchors were searched for the presence of new anchors. Only those anchors with alignment score greater than a given threshold (2), were chosen.
The set of anchors found were further filtered based on 2 criterions (see Figure 1D): (i) if the difference in lengths of sequence fragments between two consecutive anchors is greater than 50 residues, the one with a low anchor alignment score (if less than a cut-off, 3) is
removed from the set, and (ii) For each of the two structures to be aligned, the structural distances between the main anchor and any other anchor, are calculated. If the difference in these distances calculated for the two structures, is more than 8 Å, the anchor is removed from the set.
The regions separating the set of local alignments (or linkers) were aligned using the Needleman - Wunsch algorithm taking into account, the alignment operations (insertion, deletion and substitution) at the end of the anchors bounding the linker (see Figure 1E). Linker regions often involve fragments having a large length difference. To restrict the number of short stretches of gaps, the initiation penalty is calculated using an exponential function of the minimum number of gaps (difference in lengths) required to align the two segments.
Indel weights. It is a critical issue to weigh the gap penalties. Affine gap penalties were used for alignment of the anchors. PB specific gap substitution weights were calculated by evaluating the gap substitution probabilities from the PALI alignments. These weights are added to the opening penalties in a linear way, i.e., Gap Opening Penalty, GOP = gop (1+weight), where gop is the initial penalty given by the user. A fixed gap extension penalty was used.
Results
The main goal of this work is to improve the method developed for structure comparison based on PBs, i.e., PBALIGN. This method gave an excellent performance as shown with different benchmarks {Tyagi, 2008 #75}. The improvement is quantified with two criteria (i) the efficiencies in mining homologues of known structure from a databank and (ii) quality of structural alignment. In the first step, substitution matrices were generated from refined datasets and assessed by comparison with the Orig matrix used in the work published earlier {Tyagi, 2006 #77}. Then, we propose a dedicated alignment approach, namely iPBA, based on a modified dynamic programming algorithm.
1. Effect of normalised datasets
The substitution matrix (SM), published earlier, was used as the reference (Orig). Since then, PALI database {Balaji, 2001 #76; Sujatha, 2001 #8} has been updated and the recent version has about 10.7 times more alignments than the earlier. The superimposition approach currently used for the generation of alignments is MUSTANG {Konagurthu, 2006 #89}, instead of STAMP {Russell, 1992 #88}. Thus, an updated SM (named ALL) has been generated using the identical strategy as that of Tyagi et al {Tyagi, 2006 #77}. PALI database consists of structural alignments of protein domains grouped based on the SCOP definitions. Hence, the family sizes vary extensively, V-set (antibody variable domain like) domains has about 107,499 substitution pairs, while other families are represented by only two proteins.. Thus a normalized SM (Fnorm) has been generated taking this disequilibrium into account. In the same way, the distribution of families across SCOP classes is not uniform, e.g. all- class contains about 60% of all alignments. Both the variable distributions in families and classes were accounted with a new SM (named CFnorm). Normalisation was also carried out based on the extent of sequence similarity within each family. The domains taken into account share
less than 40% sequence identity ( IDnorm SM). Finally, we combine the sequence and structure based normalisations, to define new SMs, IDFnorm and IDCnorm, which are derived from the dataset obtained at 40% sequence identity cut-off but also takes into account, the family and class sizes respectively. Other refinement criteria were also tested, but they gave less pertinent results (data not shown).
1.1. Mining Efficiency. Each protein domain in the test dataset was compared with other entries in the dataset to check the efficiency in identifying structurally similar proteins over others. Mining efficiency is assessed by considering hits with their class, fold, family or superfamily as per SCOP definition {Murzin, 1995 #46}. The dynamic programming alignment score normalised by the alignment length, was used to rank the hits obtained in mining The efficiency in identifying the homologous domain in the first 1, 5 and 10 hits was calculated.
The two SMs generated with datasets normalized on class and family sizes (CFnorm) and based on sequence identity and family sizes (IDFnorm), performed better than others (see Supplementary data 1A&B). Considering the overall performance, the CFnorm matrix was chosen for the rest of the mining studies. The distribution of difference in the ranks of top true superfamily hits when compared to the Orig SM shows that a significant percent of the targets were ranked higher. Hence, the distribution of gain in the ranks of true top hit belonging to the same superfamily was analyzed. More than 3/4th of the cases exhibit a better ranking with CFnorm when compared to Orig (see supplementary Data 2). On the average, we observed a gain of 14 ranks.
1.2. Quality of structural alignment. The second part of this study is to analyze the improvement in alignment quality with the use of different SMs. The quality of structural
alignments were assessed based on a global rmsd obtained from a least squares fit of protein structures using ProFit software {Martin, 2010 #95} The LGA_S score was also used as an indicator for the quality of structural alignment. Since the calculation of this score involves both local rmsd and global distance, both local and global structural similarities are considered, unlike the simple global rmsd values.
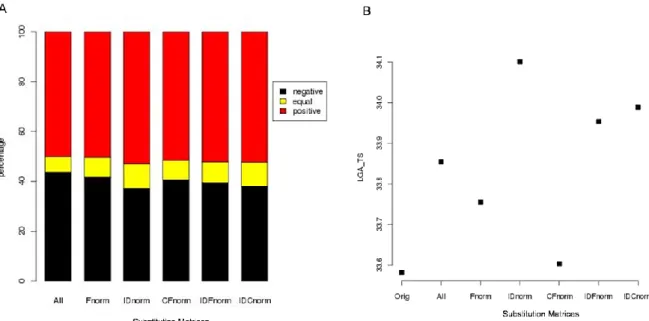
The matrix normalized based on a sequence identity cutoff of 40% (IDnorm), performed better than others (see Figure 2A and supplementary Data 3). About 57% of the alignments had rmsd lower than that of Orig SM, 6% had the same rmsd and rest 37% of rmsd values were higher. For 82% of these negative cases, the rmsd increase is low (less than 0.5 Å, see supplementary Data 3). The average LGA_S scores suggest a slight improvement, the IDnorm SM showing a better performance.
The performance was also better with datasets with domain pairs of similar length (80% coverage) and those involving alignments of different sequence identity cutoffs (Supplementary data 4A,B & C). Hence, IDnorm SM was chosen as an optimal SM to perform pairwise structural alignments.
2.
Weighing structurally similar regions
A preliminary analysis suggested that a semi-global mode of alignment can lead to a large improvement in alignment quality (see Supplementary data 5). A global alignment dynamic programming method weighed on the local regions of similarity (anchors) was developed for PB based structural alignment. The SIM algorithm developed by Huang and Miller {Huang, 1991 #94} was modified to identify a set of local alignments (anchors) between the two PB sequences. Sequence and structure based constraints were added to filter false anchors from the complete set of anchors (see Methods section and Figure 1).
Affine gap penalties were used for aligning the anchor and linker regions. In order to study the variation of alignment quality with different gap penalties, alignments were carried out across a range of initiation and extension penalties. The initiation and extension penalties for the linker were varied, keeping the anchor associated penalties fixed. Then the optimal set of linker penalties was fixed and penalties for anchor alignment were varied.
Different opening and extension penalties were used for optimizing the alignment of anchor. The initial gap opening penalty (gop) was chosen from -500 to -800 and the gap extension penalty from -900 to-1100. Note that a linear gap penalty of -1000 (-5 scaled by 200) was used earlier {Tyagi, 2008 #75; Tyagi, 2006 #77}. The cutoff of main anchor alignment score was set to 15000 (τ1) and for the rest of the anchors a cutoff of 3000 (τ2) was
used. The threshold for filtering anchors based on the sequence based constraint (See Methods
section), τ3 was set to 5000. These values were fixed after an assessment of alignments
generated with different cut-offs. For a given opening and extension penalty, if the main anchor could not be found, further iterations with penalty values lowered by 100 are carried out. If no anchors were found, a classical Needleman Wunsch global alignment is carried out. For the linker regions, the initial opening penalty was chosen from among (-300 to -500), based on the quality of the alignments generated. The extension penalty was held constant.
For the anchor regions, no single set of gap penalties performing better than the others could be found. The best alignments were spread across different penalty values (Supplementary data 6). Use of a high initiation penalty gave the best alignment in majority of the cases. However, most of the alignments that were comparable to the best were found associated with a more relaxed set of penalties. This final approach has been named improved Protein Block Alignment (iPBA).
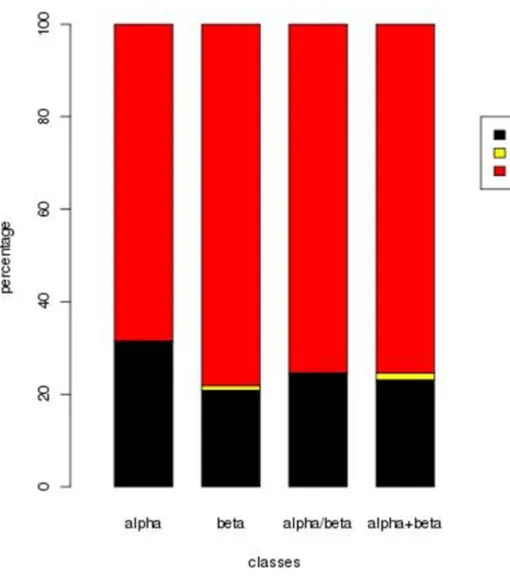
Anchor based alignments (using IDnorm matrix), with an initial gap opening penalty of -600 and extension penalty of -900, were better in 74.4% of the cases (only 15% worse) in comparison to global alignment (PBALIGN with Orig SM, see Figure 3). The performance was better in the case of all-/ and + classes (78.1%, 75.4% and 75.4%% respectively), when compared to the all- class (68.5% better and 31.5% worse).
2.1.1. AA substitution weights. Weighing the alignment scores based on the amino acid substitutions can improve the alignment especially in the regions of long stretches of same PBs (which can be considered as a low complexity sequence). A linear combination of PB substitution scores and AA substitution scores was used. The AA substitution matrix was generated in a similar way as that of the IDnorm matrix. The best alignments obtained using different initiation and extension penalties, generated with and without the addition of AA substitution weights, were chosen. 60.6% of the alignments have a better (lowered) rmsd with the use of amino acid substitution weights, with better performances in all- and all- classes compared to others (see Figure 4A).
About 28.8% of the cases are negative, i.e., the addition of AA substitution weights increased the rmsd of the alignment (see Figure 4B). About 78.7% of these had a comparable
rmsd (<0.5Å). The cases where the addition of amino acid substitution scores results in an
alignment of poor quality were looked into. Many of these alignments have a low sequence identity. In a few cases, wrong anchors were chosen as a result of addition of amino acid substitution weights.
2.1.1.1. Mining Efficiency. In mining tests, the iPBA alignment approach (with CFnorm SM) performed better than the global alignment using Orig. Significant improvement in efficiency was achieved mainly for the all- and all- classes at the family, super-family
and fold levels (see Figure 5). Efficiency of finding the true hit (from the same superfamily) in the Top 1, Top 5 and Top 10 hits increase by 7.9%, 6.1%, 0.6% and 4.5% in the all-
all-, /and+ classes respectively. In finding the true hit as the top hit, an average gain of 6.8% was obtained.
While comparing the ranks of top true hits using the above method and that of the previous approach (PBALIGN), about 80% of the targets were ranked higher and the differences in ranks were large when compared to the global alignment approach using the new CFnorm matrix (see supplementary Data 7).
2.1.1.2. Quality of Structure Alignment. Also, while comparing the iPBA approach based on the quality of alignment, impressive improvement was seen. More than 82.2% of the alignments had a lower rmsd compared to the original approach with PBALIGN (see Figure 6A). In terms of the LGA_S score also, the quality of alignments were found to be better across all SCOP classes (see Figure 6B).
Difference in rmsd values of alignments between iPBA (with IDnorm matrix) and Original method were analyzed. The real negative cases where the global alignment rmsd lower by 2 Å or more were analyzed. Most of the time, the main anchor is not correctly selected, in which case the entire alignment becomes wrong. In a few other cases, false anchors were associated with the main anchor. Most of these alignments correspond to cases where the similarity is spread throughout the sequences and not constrained to local stretches. Comparison of LGA_S scores also suggests that the quality of alignment shows improvement across all the major SCOP classes.
3.1. Alignment Quality. The alignments of domains in the test dataset, generated using
iPBA, were compared with the MUSTANG based alignments of PALI (Figure 7A). 84.2% of the alignments have better rmsd than those generated by MUSTANG. 89% of these alignments with better rmsd also show an increase in the number of aligned residue pairs (Nal,
i.e. residue aligned with a distance less than 3 Å, Figure 7B). Comparison with DALI
alignments on a subset of 296 domain pairs also showed better performance. 78.4% had better
rmsd values and 70% of these alignments had higher Nal values (Figure 7C&D). The
alignment quality is largely better than that of MUSTANG while considerable improvement is also obtained when compared to DALI.
The quality of structural alignments generated by PBALIGN {Tyagi, 2008 #75} were compared with VAST {Gibrat, 1996 #14}, CE {Shindyalov, 1998 #24}, DALI {Holm, 2000 #32}, FATCAT {Ye, 2003 #23} and PROFIT [95], for 10 difficult cases {Ye, 2003 #23}. The performance of PBALIGN was comparable to that of other methods and better alignments were obtained in many cases. The same experiment was repeated with iPBA. Similar results were obtained and in some cases large improvements were seen. e.g. the rmsd of alignment of proteins with PBD IDs 1TEN, chain A {Leahy, 1992 #122} and 3HHR, chain B {de Vos, 1992 #123} improved by 2.5Å with iPBA (Supplementary data 8).
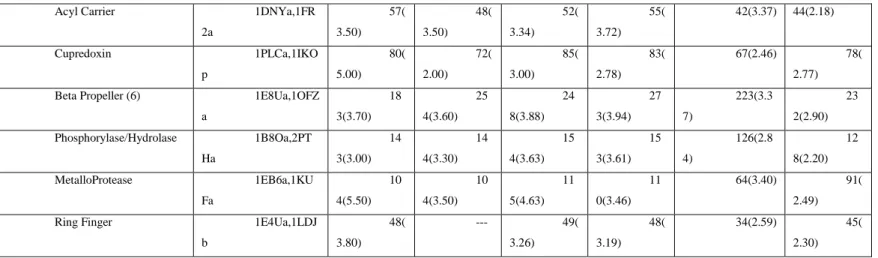
In a similar test, the alignment quality of iPBA was compared with DALI {Holm, 2000 #32}, CE{Shindyalov, 1998 #24}, FATCAT {Ye, 2003 #23}, TM-align {Zhang, 2005 #125} and GANGSTA+ {Guerler, 2008 #124} for protein pairs chosen from 7 folds in the SABmark dataset {Van Walle, 2005 #126}, these alignments are in the twilight zone. This dataset consists of folds with representatives sharing a sequence identity less than 25%. In these 7 folds chosen, each protein was chosen from a different superfamily (if more than one superfamily is available), according to SCOP {Murzin, 1995 #46}. The rmsd of alignments generated by iPBA was lower than that of the others (Table 1). However, the number of
residues aligned is also lower in many cases. Indeed, only the residue pairs within 5Å were considered for calculating rmsd. The performance was better than CE in about 4 cases and in almost all cases when compared to GANGSTA+. The alignment quality is largely comparable to that of FATCAT and TM-align.
3.2. Efficiency in mining. In our previous work, we had compared PBALIGN with the
major structure comparison servers, for mining the right homologues from the databank. Here we carry out a similar test which is a slight variant of the earlier work. As in our previous work {Tyagi, 2008 #75; Tyagi, 2006 #77}, the results of Novotny et al. and Carpentier et al. {Carpentier, 2005 #30; Novotny, 2004 #15} were used for comparison. 61 proteins from four major classes in CATH {Greene, 2007 #100} were used as representatives for mining by Novotny et al. {Novotny, 2004 #19}. These proteins were used as queries to probe for proteins from the representative set, belonging to the same family in CATH. Different structure comparison servers (listed in Supplementary Data 9 {Holm, 1993 #18; Kleywegt, 1997 #98; Shindyalov, 1998 #24; Gaspari, 2005 #104; Kawabata, 2003 #102; Singh, 1997 #39}) were compared based on the performance in mining, using this query set. We perform a similar test but the SCOP 1.73 database filtered at 95% sequence identity (with 14,669 domains), was used as the databank for mining. 17(/19), 19(/19), 13(/15) and 8(/8) were correctly found in the all- ,all-, mixed / and the class with few secondary structural elements, respectively (see Supplementary data 9).
Also 14 cases of non-trivial structure comparison, used in the work of Carpentier and co-workers {Carpentier, 2005 #30}, was used to test the efficiency of mining. 50% efficiency was obtained with iPBA, CE{Shindyalov, 1998 #24} and YAKUSA{Carpentier, 2005 #30}, while DALI{Holm, 1993 #18} was successful in 29% of cases. These experiments suggest that the performance of iPBA in finding structural homologues, is better than most of the
other structure comparison tools, including DALI {Holm, 1993 #18} and is comparable to the performance of CE {Shindyalov, 1998 #24} and YAKUSA {Carpentier, 2005 #30}.
The presence of more than one domain in the tertiary structure can affect the efficiency of identifying homologues during mining. Two multidomain protein pairs were chosen from a set of multidomain pairs in PALI with sequence identity less than 40%. Bacterial RNA polymerase (PDB code 1I6V {Campbell, 2001 #113}, chain D) and 3-dehydroquinate synthase (PDB code 1SG6 {Nichols, 2004 #114}, chain B) were used as queries while homologous proteins 1TWF ({Westover, 2004 #115}, chain B) and 1JG5 ({Bader, 2001 #116}, chain A) were considered as the true targets respectively. The true hits were found among the top 10 hits, using iPBA. Both YAKUSA and CE failed in one case, while DALI was successful in both cases (the top 100 hits were searched here).
Discussion
With respect to the PALI database {Balaji, 2001 #76; Sujatha, 2001 #8} the distribution of PB substitutions in each SCOP class shows considerable variations with the all-β class being dominant covering about 60% of all substitution pairs. Also, the distribution of domains in different families, super-families and folds are not uniform. The bias in the substitution scores resulting from a redundant dataset can be minimized by carrying out normalizations to account for the variable distributions.
In mining experiments, the PB substitution matrices normalized on the family sizes (Fnorm), both family and class sizes (CFnorm), sequence identity and family sizes (IDFnorm) performed better than the Orig SM. The matrix normalized based on sequence identity (IDnorm), which generated better quality alignments, gave a relatively poor performance in mining. This could be because of the consequence of the basis of normalization, as the mining efficiency was checked across different SCOP classification levels. The cases where the true
family hit was not found in the top 100 hits were mainly due to large difference in the lengths between the domain pairs. They also reflect some particular cases of association of proteins in the same SCOP cluster, which most of the other automatic approaches are not able to establish.
The limitations of using a pure global or local alignment approach can be avoided by using an improved dynamic programming algorithm that differentiates structurally similar regions from the variable ones. Several methods for the alignment of protein and DNA sequences based on anchor regions exist {Bray, 2003 #85; Brudno, 2003 #84; Delcher, 2002 #105; Huang, 2006 #80}. Some are based on weighing the anchor regions in an otherwise global alignment while others fix the anchors and align the rest of the sequence segments to obtain a global alignment. The main advantage of using an anchor based approach is the possibility of using different alignment parameters like gap penalties and substitution weights for the locally similar and dissimilar stretches.
Alignment of PB sequences often involves continuous stretches of PBs which can be compared to low complexity stretches (e.g., helices and strands). Alignment in these stretches becomes difficult especially when the two segments have a significant length difference. Addition of weights for amino acid substitution is expected to help in minimizing this problem of low complexity. Use of amino acid substitution weights in structural alignments have been reported in earlier studies {Birzele, 2007 #103; Kawabata, 2003 #102; Madhusudhan, 2009 #101; Wang, 2008 #44}.
Some of the cases where the addition of amino acid weights brings about a large improvement in the quality of the alignment were looked into. In most of the cases, the possible errors that arise while performing the alignment of long stretches of similar PBs are avoided with the addition of amino acid substitution weights. Though all the alignment pairs
had a sequence identity less than 40%, short conserved motifs or amino acid substitutions of similar nature, help in the refinement of the alignment. One such case is the alignment of structures of dehydrogenases (see Figure 8A, PDB code 2D29 (Shimizu and Kunishima) and 1R2J {Watanabe, 2003 #108}). The alignment rmsd improves by more than 4 Å with the addition of amino acid substitution weights. Theses structures have 5 and 4 helices respectively. As seen in the figure, the alignment mainly involves long series of PB m. In the absence of amino acid substitution weights, a wrong anchor alignment is obtained. Short conserved sequence motifs are spread across the two sequences. Weighing the alignment in these region helps to find the correct anchor for the alignment and the global alignment gets improved.
Alignment of multidomain proteins.
While aligning protein chains with more than one domain, the anchor based alignment is expected to give better alignments. We have considered some difficult cases of alignment in the class of multidomain proteins, with the domain pairs having sequence identity less than 40%. Comparison of structures of DNA polymerases from Archae (PDB code: 1WN7 {Kuroita, 2005 #106}) and phage (PDB code 1IH7 {Franklin, 2001 #107}), with the anchor based approach (iPBA) provides an alignment with rmsd 11.2 Å lower than that obtained with the earlier approach, PBALIGN (see Figure 8B). These structures have 3 domains namely, palm, thumb and finger domains; the palm domain has a ferredoxin like fold. Two different anchor alignments were obtained, corresponding to the alignment of two of these domains.
Alignments involving conformational shifts
The alignment in terms of PB sequences can be used to compare structures involving flexible movements or conformational shifts. This is demonstrated with an example taken
from the work of Ye et al {Ye, 2003 #23}. The crystal structure of repeating segments of Spectrin (2SPC{Yan, 1993 #121}, chain A) was compared to a NMR derived structure (1AJ3{Pascual, 1997 #120}). Both the structures are made of three helices. As shown in Figure 9, one of the helices in 1AJ3 is bent; FATCAT {Ye, 2003 #23} introduced two twists between the 3 helices to obtain an alignment that takes the flexibility into account. iPBA was able to generate a similar alignment, where a single anchor covers the region of alignment of the 3 helices. In a similar way, multidomain proteins involving domain movements with interdomain hinges, can be also compared using iPBA.
In conclusion, iPBA (improved PBALIGN approach) provides a fast and efficient means for recognizing protein domains with same fold as the query from a large databank. The improvement is highly significant with respect to the quality of alignment. The performance in general is largely better than most of the available tools for structure comparison. The different parameters used in optimizing this approach, adds flexibility for the use of the method. These parameters can be carefully altered, especially when the structures to be aligned are distant homologues. The use of specialized SMs for mining (CFnorm) and for pairwise alignments (IDnorm), further enhances the efficiency.
Acknowledgments
These works were supported by grants from the French Ministry of Research, University of Paris Diderot – Paris 7, French National Institute for Blood Transfusion (INTS), French Institute for Health and Medical Research (INSERM) and Department of Biotechnology, India. APJ is supported by CEFIPRA number 3903-E. NS and AdB also acknowledge to CEFIPRA for collaborative grant (number 3903-E).
Figure legends
Figure 1. The dynamic programming approach used in iPBA. (A) From a set of
non-overlapping local alignments extracted using SIM algorithm {Huang, 1991 #94}, an optimal chain of anchors are identified. (B) At first the most similar subsequence (main anchor) is identified and (C) then the other similar subsequences associated with this one are selected. (D) Structure and sequence based constraints are used to refine the chain of anchors. (E) Finally the regions between anchors (linkers) are aligned using Needleman-Wunsch algorithm.
Figure 2. Comparison of alignments obtained using the new refined SMs with respect
to the Orig SM. (A) Gain in the alignment quality based on rmsd of superposition. Percent of
alignments with better (lower) rmsd are highlighted in red, percent that are of equal rmsd are in yellow and the rest are in black. (B) Average LGA_S values obtained for the alignments carried out using different SMs.
Figure 3. Gain in the alignment quality based (RMSD): Anchor Based alignments
with IDnorm SM vs. Global dynamic programming with Orig SM. Alignments with better
(lower) rmsd are highlighted in red, percentage of equal rmsd is in yellow and the rest is in black.
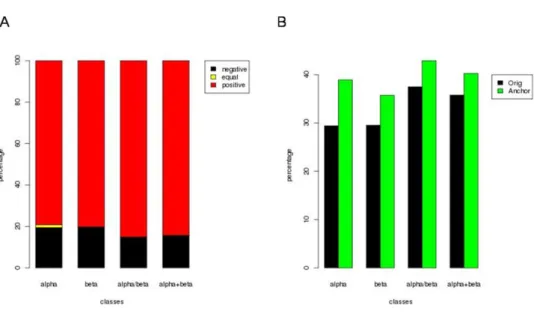
Figure 4. Improvement in alignment quality with the use of amino-acid substitution
weights. (A) Gain in the alignment quality based on rmsd: Anchor based approach using
amino acid weights vs. Anchor based approach without amino acid weights. (red) alignments with better (lower) rmsd are in red, same rmsd in yellow and worse rmsd are in black. (B) Distribution of differences in rmsd values for alignments generated with & without including amino acid substitution weights
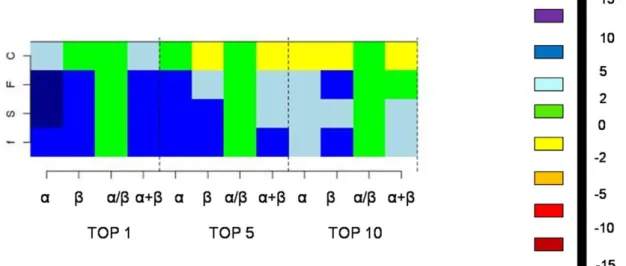
Figure 5. Improvement in the efficiency of mining carried out using Anchor Based
alignment (with CFnorm matrix) when compared to the previous approach (Orig). The cells
in the matrix are colored based on the percentage increase in the mining efficiency (see right for the scale). Each cell corresponds to a specific SCOP class (α, β, α/β, α+β) and a specific SCOP classification level at which the true hit is assigned (f: family, S: superfamily, F: fold and C:class).
Figure 6. Comparison of alignments obtained using the Anchor Based approach
(amino acid weights, IDnorm matrix) and the Orig SM which is non-normalised. (A) Gain in
the alignment quality based on rmsd of superposition, across the SCOP classes. Percent of alignments with better (lower) rmsd are highlighted in red, percent that are of equal rmsd are in yellow and the rest are in black. (B) Average LGA_S values obtained for the alignments across the major SCOP classes: New approach (green) vs. Original (black).
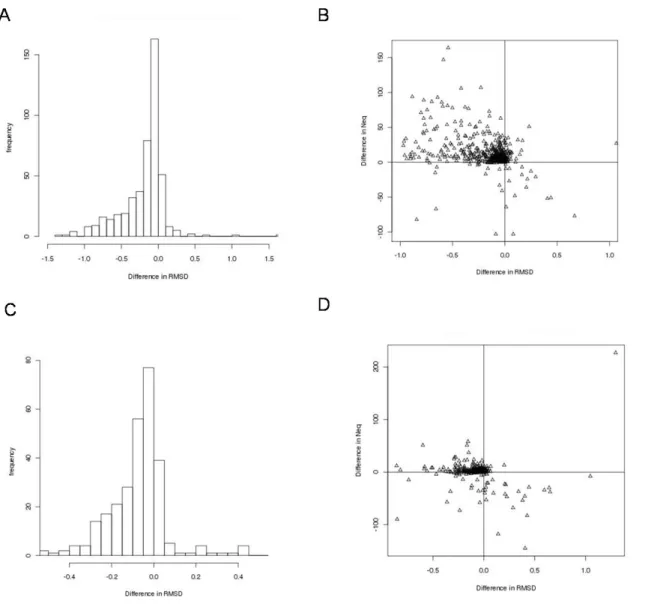
Figure 7. Comparison of iPBA with MUSTANG and DALI in terms of the alignment
quality. (A) Plot of difference in rmsd obtained while comparing domain pairs using iPBA
and MUSTANG. rmsd difference is plotted against difference in Nal (number of residue pairs within 3Å) gain respectively, for alignments generated by iPBA and MUSTANG. (C-D) Plots of difference in rmsd and rmsd difference versus Nal gain respectively, for alignments generated by iPBA and DALI. Note than a negative rmsd difference implies an improvement.
Figure 8. Features of the iPBA algorithm. (A) Comparison of structures of
pyrophosphatases (PDB codes: 1VMG and 2GTA), based on the PB sequence alignment (top). Improvement in the alignment with the addition of amino acid substitution weights (bottom). (B) Alignment of structures of DNA polymerases (PDB codes: 1WN7 and 1IH7) using the earlier approach i.e. PBALIGN with Orig (left) and the improvement in the alignment using iPBA (right).
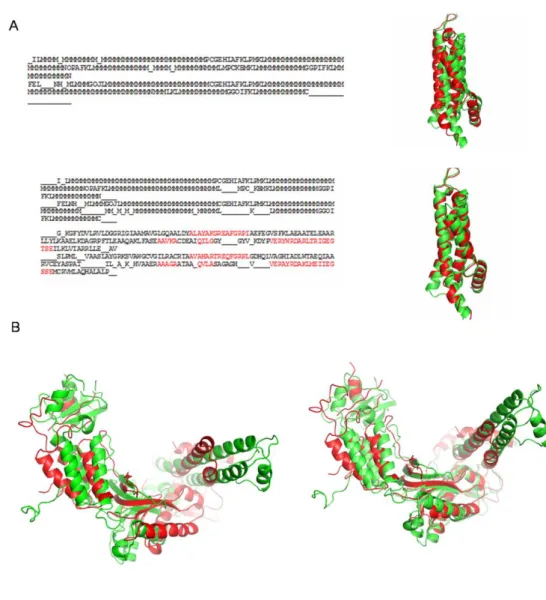
Figure 9. Flexible alignments with iPBA. (A) 3D superposition of structures of
spectrin repeats in different conformations (PDB IDs 1AJ3 and 2SPC (chain A)), using Profit[95]. (B) PB sequence based alignment of the spectrin repeats generated using iPBA. (C) Amino acid sequence alignment corresponding to the PB alignment in (B). The alignment of helical region in different conformations is highlighted. The terminal residues are absent in the PB alignment as the dihedral angles cannot be determined for these residues.
Family/Fold PDBs CE DA LI FA TCAT T M-align GANGS TA+ iP BA Globins 1A6Ma,2GD Ma 14 6(2.40) 14 6(2.40) 14 4(2.24) 14 4(2.14) 142(3.1 9) 14 2(2.23)
Table 1. Comparison of iPBA with different structural alignment tools. Each protein
pair is chosen from different families in the SABmark database. The number of aligned residues (as defined by different methods) and their rmsd is given within parentheses.
Acyl Carrier 1DNYa,1FR 2a 57( 3.50) 48( 3.50) 52( 3.34) 55( 3.72) 42(3.37) 44(2.18) Cupredoxin 1PLCa,1IKO p 80( 5.00) 72( 2.00) 85( 3.00) 83( 2.78) 67(2.46) 78( 2.77) Beta Propeller (6) 1E8Ua,1OFZ
a 18 3(3.70) 25 4(3.60) 24 8(3.88) 27 3(3.94) 223(3.3 7) 23 2(2.90) Phosphorylase/Hydrolase 1B8Oa,2PT Ha 14 3(3.00) 14 4(3.30) 15 4(3.63) 15 3(3.61) 126(2.8 4) 12 8(2.20) MetalloProtease 1EB6a,1KU Fa 10 4(5.50) 10 4(3.50) 11 5(4.63) 11 0(3.46) 64(3.40) 91( 2.49) Ring Finger 1E4Ua,1LDJ
b 48( 3.80) --- 49( 3.26) 48( 3.19) 34(2.59) 45( 2.30)
![Figure 9. Flexible alignments with iPBA. (A) 3D superposition of structures of spectrin repeats in different conformations (PDB IDs 1AJ3 and 2SPC (chain A)), using Profit[95]](https://thumb-eu.123doks.com/thumbv2/123doknet/14615935.546312/32.892.97.808.245.904/figure-flexible-alignments-superposition-structures-spectrin-different-conformations.webp)