HAL Id: hal-01771532
https://hal-univ-rennes1.archives-ouvertes.fr/hal-01771532
Submitted on 12 Apr 2019HAL is a multi-disciplinary open access archive for the deposit and dissemination of sci-entific research documents, whether they are pub-lished or not. The documents may come from teaching and research institutions in France or abroad, or from public or private research centers.
L’archive ouverte pluridisciplinaire HAL, est destinée au dépôt et à la diffusion de documents scientifiques de niveau recherche, publiés ou non, émanant des établissements d’enseignement et de recherche français ou étrangers, des laboratoires publics ou privés.
CBCT-guided evolutive library for cervical adaptive
IMRT
Bastien Rigaud, Antoine Simon, Maxime Gobeli, Caroline Lafond, Julie
Leseur, Anais Barateau, Nicolas Jaksic, Joël Castelli, Danièle Williaume,
Pascal Haigron, et al.
To cite this version:
Bastien Rigaud, Antoine Simon, Maxime Gobeli, Caroline Lafond, Julie Leseur, et al.. CBCT-guided evolutive library for cervical adaptive IMRT. Medical Physics, American Association of Physicists in Medicine, 2018, 45 (4), pp.1379-1390. �10.1002/mp.12818�. �hal-01771532�
Accepted
Article
Article Type: Research Article
CBCT-guided evolutive library for cervical adaptive
IMRT
Bastien Rigaud MSc (1,2)*, Antoine Simon PhD (1,2), Maxime Gobeli MD (3), Caroline Lafond MD, PhD (1, 3)
, Julie Leseur MD (3), Anais Barateau MSc (1,2), Nicolas Jaksic MD (3), Joël Castelli MD, MSc (1,2,3), Danièle Williaume MD (3), Pascal Haigron PhD (1,2) and Renaud De Crevoisier MD, PhD (1,2,3)*
1. Université de Rennes 1, LTSI, Campus de Beaulieu, Rennes, F-35042
2. INSERM, U1099, Campus de Beaulieu, Rennes, F-35042
3. Centre Eugene Marquis, Radiotherapy Department, Rennes, F-35000
Running title:
Adaptive radiotherapy strategy in cervical IMRT
* Corresponding authors: email addresses: [email protected] or [email protected], tel.: +33(0)299253031.
Conflict of interest: The authors declare that they have no competing interests.
Acknowledgements: This work was partly funded by the French National Research Association (ANR) as part of the Investissement d’Avenir programme (Labex CAMI) under reference ANR-11-LABX-0004, by the French “Ligue contre le Cancer”, and by the French organization “La Vannetaise”.
Accepted
Article
Abstract
Purpose
In the context of adaptive radiation therapy (ART) for locally advanced cervical carcinoma (LACC), this study proposed an original cone-beam computed tomography (CBCT)-guided “Evolutive library” and evaluated it against four other known radiotherapy (RT) strategies.
Material and methods
For 20 patients who underwent intensity-modulated radiation therapy (IMRT) for LACC, three planning CTs (with empty [EB], intermediate [IB], and full [FB] bladder volumes), a CT scan at 20 Gy and bi-weekly CBCTs for 5 weeks were performed. Five RT strategies were simulated for each patient: “Standard RT” was based on one IB planning CT; “internal target volume (ITV)-based RT” was an ITV built from the three planning CTs; “RT with one mid-treatment replanning (MidTtReplan)” corresponded to the standard RT with a replanning at 20 Gy; “Pretreatment library ART” using a planning library based on the three planning CTs; and the “Evolutive library ART”, which was the “Pretreatment library ART” strategy enriched by including some CBCT anatomies into the library when the daily clinical target volume (CTV) shape differed from the ones in the library. Two planning target volume (PTV) margins of 7 and 10 mm were evaluated. All the strategies were geometrically compared in terms of the percentage of coverage by the PTV, for the CTV and the organs at risk (OAR) delineated on the CBCT. Inadequate coverage of the CTV and OARs by the PTV was also assessed using deformable image registration. The cumulated dose distributions of each strategy were likewise estimated and compared for one patient.
Results
The “Evolutive library ART” strategy involved a number of added CBCTs: 0 for 55%; 1 for 30%; 2 for 5%; and 3 for 10% of patients. Compared with the other four, this strategy provided the highest CTV geometric coverage by the PTV, with a mean (min – max) coverage of 98.5% (96.4 – 100) for 10 mm margins and 96.2% (93.0 – 99.7) for 7 mm margins (p < 0.05). Moreover, this strategy
Accepted
Article
significantly decreased the geometric coverage of the bowel. CTV undercoverage by PTV occurred in the anterior and superior uterine regions for all strategies. The dosimetric analysis at 7 mm similarly demonstrated that the “Evolutive library ART” increased the V42.75Gy of the CTV by 27%, 20%, 13% and 28% compared with “Standard RT”, “ITV-based RT”, “MidTtReplan” and “Pretreatment library ART”, respectively. The dose to the bowel was also decreased by the “Evolutive library ART” compared with that by the other strategies.
Conclusion
The “Evolutive library ART” is a personalized ART strategy that comprises a pretreatment planning library of three CT scans, enriched for half of the patients by one to three per-treatment CBCTs. This original strategy increased both the CTV coverage and bowel sparing compared with all the other tested strategies and enables us to consider a PTV margin reduction.
1. Introduction
Intensity-modulated radiation therapy (IMRT) is increasingly used as a means to reduce normal tissue toxicity in cervical cancer, with or without treatment intensification, such as extended-field radiotherapy or concomitant boost radiotherapy [1-3]. Large intrapelvic intra- and inter-fraction anatomic variations may impede the benefits of IMRT. When occurring in steep-dose gradients around tight planning target volume (PTV) margins, these variations can expose patients to both tumour underdosage and organs at risk (OAR) overdosage [4-6]. Inter-fraction cervical displacements of up to 25 mm, 36 mm, and 23 mm have been reported in the anterior-posterior (AP), superior-inferior (SI), and left-right (LR) directions, respectively [7,8]. Moreover, uterus maximum displacements of 48 mm, 36 mm, and 28 mm have been reported in the AP, SI, and LR directions, respectively [9,10]. Uterine motion is mostly related to bladder filling, while vagina and cervix motion is linked to rectum filling [5,11-18]. Furthermore, large tumour regressions have been observed during treatment, with a mean decrease of 46% (up to 100%) of the gross cervical tumour volume achieved at 30 Gy [19] and 63% (up to 87%) of the cervix at the end of treatment [11,20,21].
Accepted
Article
Several strategies have previously been proposed to account for these anatomic variations. Defining an internal target volume (ITV) is a simple solution to overcome the risk of clinical target volume (CTV) underdosage, yet with the drawback of increasing OAR overdosage. Replanning at mid-treatment or following many fractions and weekly replannings have been proposed, with a deformable image registration (DIR)-based workflow [22-24]. Some authors have recently proposed adaptive radiation therapy (ART) based on a pretreatment planning library [15,25-29]. However, this approach may be limited in cases of cervix fixity at the planning or of per-treatment tumor shrinking. Nevertheless, these different strategies have not been compared in the same cohort. Moreover, no study has investigated the benefits of using per-treatment CTV shape variations to update a planning library into a tight-fitting planning library, with the aims of improving CTV coverage and OAR sparing [26].
Considering the use of ART for LACC, this work proposed an original strategy named the “cone-beam CT (CBCT)-guided evolutive library”. This strategy takes advantage of the CBCT images acquired during treatment to assess patient positioning and trigger per-treatment replannings, thereby optimizing the treatment library by considering both tumour deformation and shrinkage. This strategy was simulated and compared with four others: standard planning; ITV-based planning; mid-treatment replanning; and a pretreatment planning library.
2. Materials and methods
2.1 Patients, tumours, and treatment
This study enrolled 20 patients with a mean age of 51 years (range, 27-68). Stage distribution, according to the International Federation of Gynecology and Obstetrics (FIGO) classification [30], was as follows: IB2, n = 7; IIA-B, n = 9; IIIA-B, n = 3; and IVA, n = 1. Histology revealed squamous cell carcinoma in fifteen patients and adenocarcinoma in five. All patients were treated with a combination of external beam radiation therapy (EBRT) and pulse-dose-rate (PDR) brachytherapy (BT). PDR-BT was delivered in accordance with the GEC-ESTRO recommendations [31]. EBRT
Accepted
Article
delivered a total dose of 45 Gy to the pelvis (supine position), at 1.8 Gy per fraction, using IMRT along with concomitant weekly cisplatin (40 mg/m2). All patients provided signed informed consent.
2.2 Planning CTs and bi-weekly CBCT imaging
Each patient underwent three planning CTs (3 mm slice thickness, Big Bore Philips) at different bladder volumes: empty (EB); intermediate (IB); and full (FB). One hour prior to acquiring the first CT (IB-CT), the patients consumed 250 mL of water. The patients then consumed an additional 500 mL of water, and the FB CT was acquired 20 minutes later. The patients then emptied their bladders for the EB CT. Following the injection of intravenous contrast (IB only), CT images were obtained from the upper border of the L2 vertebral body to 3 cm below the ischial tuberosity. Before each treatment fraction, the IB procedure was reproduced.
CBCTs (2 mm slice thickness, XVI Elekta) were acquired on days 1, 2, and 3, then bi-weekly during the 5 weeks of treatment, with an average of 12 (range, 9 – 17) CBCTs acquired per patient. Patients underwent a supplementary IB CT at mid-treatment (20 Gy), without intravenous contrast medium injection. All CTs, CBCTs and RT fractions were performed with the patient in a supine position with personalized immobilization.
2.3 Region of interest delineation on CTs and CBCTs
The CTV included both the primary tumour site (CTV-T) and the regional lymphatics (CTV-N). The CTV-T included the cervical tumour and the uterus. In the event of vaginal involvement, it also included 2 cm below the most caudal tumour extension in addition to the parametria. The CTV-N included the common, external and internal iliac vessels, along with the obturator vessels and the presacral lymph nodes [32]. The inguinal lymph nodes were included in cases of lower vaginal involvement. The delineated OARs were the rectum, bladder, and bowel; the latter included the sigmoid colon. The sigmoid colon was not delineated because it was not individually distinguishable on CBCT.
Accepted
Article
One experienced radiation oncologist manually delineated the CTV-T and the OAR on all CT scans and CBCTs. The CTV-N was only delineated on the CT scans. All delineations were validated by a second experienced radiation oncologist. The “CTV-T” is simplified to “CTV” in this manuscript.
2.4 Definitions of RT/ART strategies and PTV margins
Five radiotherapy (RT) strategies were geometrically simulated for each patient (Figure 1).
(1) The standard RT was based on the planning CT with IB.
(2) The “ITV-based RT” used an ITV created by combining the delineated CTV from the three planning CT scans (EB, IB, and FB), following rigid bone registration of the two CT scans (EB and FB) to the IB CT scan. The ITV contour was smoothed by a Gaussian filter (standard deviation, 2 mm).
(3) The RT strategy with one mid-treatment replanning (named “MidTtReplan”) corresponded to the standard RT with one additional replanning based on the CT acquired after the tumour received 20 Gy.
(4) The “Pretreatment library ART” was a PTV library defined from the three planning CTs. For daily treatment, one PTV was selected from the library. This PTV was the one that provided the maximum overlap (using the Sørensen-Dice similarity coefficient [DSC] [33]) between the CTV of the library and the daily CTV delineated in the CBCT, following rigid bone registration of the planning CT scans to the CBCT.
(5) The “Evolutive library ART” was an enriched version of this “Pretreatment library ART” and included new CTVs from the CBCTs in the pretreatment planning library, if the given CTV shape of the day differed from those in the library. Following each CBCT, if the overlap coefficients between the entire CTV library and the CTV of the day did not reach a defined threshold (i.e., the CTV shape of the day was not represented in the current library), the CBCT CTV was added to the library. Figure 2 illustrates the evolutive library-based ART strategy. Whether each CBCT CTV was included in the
Accepted
Article
library depended upon the results of the similarity test. When a CBCT CTV was added to the library, it was considered available from the next fraction onwards. This strategy was thus off-line. All overlap coefficient thresholds were tested (range, 0.05-0.95).
Two PTV margins were used: 10 mm, considered to be the standard margin, and 7 mm to evaluate the ability of a narrow PTV to cover the target during treatment. PTVs were calculated by an isotropic expansion of the CTVs.
2.5 Morphologic analysis
To quantify the movements represented in the pretreatment planning library, bladder volumes and CTV angles were measured on the planning CTs. The CTV angle was defined using three manually placed points at the top of the uterus, cervix, and vagina, as previously described [9,34]. Pearson’s coefficient (r) was calculated to assess correlations between the CTV angle and the bladder volume.
During treatment, tumour shrinkage was quantified by calculating the volume of the CTV delineations on the planning CT and on the CBCTs. Vaginal displacement was also assessed by considering the displacement of a vaginal point defined as the centre of the inferior part (most inferior slice) of the CTV, after pelvic bone registration (Figure S-4b). The average of this vaginal displacement per patient was computed. Pearson’s coefficient was calculated to assess correlations between vaginal displacement and rectum coverage by the PTV.
2.6 Geometric evaluation of the five strategies
For the treatment simulations, the planning CT scans and the corresponding PTV were bone-registered to the per-treatment imaging (CBCT and mid-treatment CT). The different strategies were compared using a geometric criterion. The main endpoint was the “coverage” of the volumes of interest (VOI) by the PTV, which required calculation of the “overlapping volume” between the PTV
Accepted
Article
and the VOI (CTV, bladder, rectum, or bowel). Coverage was defined as the ratio between the overlapping volume and the VOI volume. A total of 668 PTVs that evaluated the two margin values were computed (200 on the planning CTs; 468 on the per-treatment images). For each patient and each VOI, the mean coverage was calculated based on the patient’s CBCTs (range, 9 – 17). The mean coverage values that corresponded to the different strategies were compared two by two using a non-parametric test (Wilcoxon signed-rank test). Each strategy was compared with the standard RT and the evolutive library strategy for each PTV margin.
To provide a spatial analysis of the coverage of the VOIs by the PTV, a probability map was generated that depicted overlapping between the PTV and the volumes of interest (CTV and OAR) (Figure S-5). A unique template anatomy was first chosen in the cohort, corresponding to the IB CT scan with the median CTV volume (Stage III disease). Based on the contours of the VOIs, a rigid registration was first performed between the CBCTs of all the patients and the template, followed by deformable image registration (DIR) using the diffeomorphic Demons algorithm with a signed distance map [35,36]. The resulting deformation vector fields were used to propagate the overlapping volumes of the CBCT to the template. A map was thus generated, enabling visualization of the mean covered area of the CTV and the OARs for each patient. Finally, the mean of all patient maps was calculated for each RT strategy. DIR accuracy was estimated by calculating the Dice similarity coefficient (DSC). The mean (min – max) DSC values were 0.94 (0.93 – 0.95) for the CTV, 0.94 (0.91 – 0.95) for the rectum, 0.97 (0.96 – 0.98) for the bladder, and 0.97 (0.97 – 0.98) for the bowel.
2.7 Dosimetric evaluation of the five strategies
To illustrate the dosimetric impact of the five strategies, each strategy was simulated for a selected patient, and the associated dose distributions were calculated. The patient with the lowest coverage of the CTV by the PTV (“standard RT” strategy) was selected. Step and shoot IMRT plans were generated with the Pinnacle treatment planning system (v.9.10) using 7 coplanar 6-MV photons beams. The dose constraints recommended by RTOG 0418 were respected. A total of eight dose plans were computed for each PTV margin (7 and 10 mm): on each planning CT (EB, IB, and FB); on the
Accepted
Article
CT at 20 Gy; on the IB planning CT with ITV; and on the per-treatment CBCTs included in the evolutive library (three CBCTs corresponding to the 1st, 2nd and 16th treatment fractions). The density overriding method was implemented to calculate the dose distribution on CT and CBCT images (water-air-bone: 0, -1000, 650 HU, respectively) [37]. Figure S-2 shows the dose distributions, with a 7 mm PTV margin, of each corresponding image, along with the corresponding dose volume histograms (DVH). The field of view of the replanning CBCTs was extended in the cranial-caudal direction with the CT image that provided the most realistic body contour.
To estimate the total received dose for each strategy, two approaches were considered. For the rectum and the bladder, a dose accumulation method based on deformable image registration was applied (with the method described in Section 2.6). The fraction doses were then warped from the CBCT to the planning CT using the estimated deformation vector fields [38]. The warped doses were added together to obtain the cumulated dose, and the DVH was calculated. The DIR method’s accuracy in assessing the cumulated dose, in terms of mean (min – max) DSC, was 0.93 (0.92 – 0.94) and 0.98 (0.95 – 0.98) for the rectum and bladder. For the CTV and the bowel, due to tissue disappearance/appearance, DIR-based dose accumulation was not appropriate to calculate [39,40], and the average DVH was thus computed. The following dosimetric indices were calculated to compare the strategies: the CTV (in %) receiving at least 42.75 Gy (95% of the prescribed dose) (V42.75); V40 (in %) of the rectum and the bladder; and V35 (in cc) of the bowel.
3. Results
3.1 Morphologic analysis
The mean (min – max) CTV angles and bladder volumes were 79.7° (37.8 – 113.1°) and 50.5 cc (22.9 – 109.9 cc) for the EB CT scans, 80° (46.9 – 113.2°) and 209.7 cc (57.9 – 713.2 cc) for IB, and 85.2° (55.5 – 134.8°) and 282.6 cc (61.9 – 809.2 cc) for FB. The correlation between CTV angles and bladder volumes was low (r = 0.24; p = 0.06).
Accepted
Article
The mean (min – max) of the average vagina displacement per patient were -0.5 mm (-8.6 – 5.8 mm), -4.4 mm (-21.4 – 6.1 mm), -5.5 mm (-18.6 – 13.3 mm) in the left-right (LR), anterior-posterior (AP) and superior-inferior (SI) directions, respectively. The mean (min – max) magnitude of the displacement was 12.3 mm (3.8 – 29.1 mm).
Figure S-3 presents the mean PTV volume used for the strategies at planning and during the 5 weeks of treatment, considering each CBCT to generate a potentially new PTV. The mean weekly CTV decrease was 10.9 cc, resulting in mean PTV decreases of 19 cc and 23 cc for a 7 mm and 10 mm margin, respectively.
3.2 Evolutive library implementation
The right portion of Figure 3a presents the mean CTV coverage by the PTV achieved by increasing the DSC threshold value and, thus, the number of CBCTs added to the evolutive library (i.e., the number of replannings). The value of the DSC threshold, which provided a minimum mean CTV coverage over 95% for a 10 mm PTV margin, was 0.55. Using this threshold, the mean number of replannings per patient was 0.7 (range, 0 – 3). Eleven patients had no replannings; six patients had 1 replanning, while one patient had 2 replannings, and two patients had 3 replannings. The mean time from the beginning of treatment to per-treatment replanning was 17 days for patients with one replanning, 15 and 27 days for those with two replannings, and 11, 12, and 23 days for those with three replannings.
3.3 Comparison of CTV geometric coverage for all strategies
Figure 3a and Table 1 represent the coverage of the CTV by the PTV for each strategy. Compared with standard RT, all strategies except the MidTtReplan significantly increased the CTV coverage. Compared with the evolutive library strategy, all others, except for the ITV-based RT, significantly decreased the CTV coverage. The mean (min – max) CTV coverage difference between the evolutive library and standard RT was 3.8% (0 – 26.1%). Five patients benefitted from an improved CTV coverage of more than 5%. Figure 4 shows that the CTV undercoverage was primarily located in the
Accepted
Article
anterior and superior regions of the uterus and in the posterior region of the cervix and that the coverage of these regions was improved by the evolutive library-based strategy.
3.4 Comparison of OAR geometric coverage for all strategies
Figures 3b, 3c, and 3d along with Table 1 represent the bladder, rectum, and bowel coverage by the PTV for each strategy, respectively. The ITV-based strategy significantly increased OAR coverage compared with standard RT. All except the ITV-based strategy significantly decreased the bowel coverage compared with the standard RT strategy. The pretreatment library-based and evolutive library-based strategies significantly increased the rectum coverage compared with the standard RT strategy. When using the evolutive library, eight patients had increased rectum coverage of more than 5% (up to 43.3% with 10 mm PTV margin). This rectum overcoverage correlated with the anterior-posterior (r = -0.53; p < 0.02) direction and with the magnitude of the vagina point displacement (r = 0.76; p < 0.001). However, eight patients had decreased bowel coverage of more than 2% (up to 6.7%). Seven patients had decreased bladder coverage of more than 5% (up to 27.5%). These OAR coverage differences were related to a better overlap between the CTV and the PTV, as illustrated in Figure S-4b. The OAR overcoverage volumes were primarily those located close to the CTV and occurred in the same anatomic location in all RT strategies (Figure 4).
3.5 CTV and OAR dosimetric analysis for all strategies
Figure 5 represents the estimated cumulated DVH of the CTV and the OARs of each strategy and the two PTV margins (7 and 10 mm) for one patient only. Table 2 shows the dosimetric indices of the CTV and OAR with respect to each strategy. For the sake of comparison, Table S-1 shows the corresponding geometric indices.
The highest CTV coverage was obtained with the evolutive library strategy. However, the dosimetric coverage of the bladder achieved with this strategy was higher than that obtained with other strategies. Considering a 10 mm (respectively, 7 mm) PTV margin, the coverage of the rectum using the evolutive library was higher (respectively, of the same order of magnitude) than that with the other strategies. For the bowel, dosimetric coverage was the lowest with the evolutive library.
Accepted
Article
4. Discussion
Using simulations, this study sought to compare five RT strategies, including an original evolutive library-based ART, in the context of LACC. The evolutive library strategy consisted of using a pretreatment library of three planning CT scans, enriched by at least one CBCT for half of the selected patients. This personalized strategy automatically triggered a replanning when the CBCT CTV differed from the CTVs in the planning library. Compared with the four other strategies, the enriched “evolutive library” offers significantly better target coverage with a reduced geometric coverage of the bowel. Indeed, due to anatomic variations, the standard RT approach indicated a relative undercoverage of the CTV by the PTV, involving mainly the uterus in its anterior and superior part and the cervix in its posterior part to a lesser extent (Figure 4). However, the rectum and the bladder are at risk of being more irradiated when using the evolutive library due to the movements of the uterus and the vagina towards these OARs, as illustrated in Figure S-4a, b. Combining the evolutive library with a moderately reduced PTV margin (7 mm) compared with standard RT with a standard margin (10 mm) permits an increased dose of CTV and decreased dose to OARs (Table 2).
Uterine motion has been reported to correlate with variations in bladder volume [11]. The most common method for defining the ITV and the pretreatment library in the literature is therefore based on planning CTs acquired at variable bladder volumes [11,15,26]. Our results demonstrate that the benefits of a bladder-based ITV and pretreatment library strategy were probably limited due to tumour fixation in the pelvis, as demonstrated by the absence of a correlation between the CTV angle and bladder volume prior to treatment. Furthermore, the pretreatment library strategy does not consider tumour shrinkage during the 5-week treatment (Figure S-3). Moreover, the morphologic analysis suggests that cervical cancer patients can be separated into four groups as follows: those whose uterus is mobile or not during the planning stage, and those whose uterus is mobile or not during treatment. For example, a pretreatment planning library handles “mover / mover” (mover at the planning and mover during the treatment) patients well, while the evolutive library can also adapt to the “non-mover / “non-mover” patients.
Accepted
Article
Simulations of RT strategies in cervical carcinoma patients can be achieved using geometric [27] or dosimetric endpoints [19,22-24,28,29]. The geometric criterion (coverage of the volumes of interest by the PTV) enables a large number of simulations to be performed that do not depend on a specific RT technique, with a drawback being a binary criterion that does not correspond with a dose gradient and thus, does not enable the prediction of toxicity or localized control. In our study, treatment strategies were compared among all patients using a geometric criterion, with dosimetric analysis performed for only one patient. The dosimetric evaluation produced results in accordance with the geometric analysis, as shown in Table S-1.
Various ART strategies in cervical carcinoma patients have been reported in the literature, yet with only a limited number of patients per series (≤ 30 patients) and no clinical results. Authors have compared one replanning at mid-treatment to multiple replannings (up to three) triggered by dose accumulation using deformable image registration [22]. This dose-guided ART strategy has been proven to be the most effective in maintaining all patients with CTV coverage of up to 95%. Similar results were observed in our study when increasing the number of per-treatment replannings, from the mid-treatment replanning strategy to the evolutive library strategy (Table 1). This finding stresses the usefulness of the evolutive libraries. Both the evolutive library and mid-treatment replanning strategies aim to take into consideration tumour regression during treatment [19]. Moreover, a maximalist ART strategy with weekly replannings has also reported improved CTV coverage by ensuring that all patients benefit from over 95% of the prescription dose, although there were no overall dosimetric benefits for the OAR [23,24]. In our study, the evolutive library suggests that the best timing for a replanning may be in the third week after the start of treatment (11-16 fractions corresponding to 20-29 Gy). This finding is consistent with a study on tumour recurrence prediction showing that the third week of treatment (20-22 Gy) was the best timing from tissue perfusion analysis on MRI [41].
To our knowledge, our study is the first to quantify the benefits of using a planning library with numerous per-treatment replannings for this anatomic location. Heijkoop et al [26] described another original personalized strategy using a library that includes model-predicted internal target volumes
Accepted
Article
(sub-ITV) in a cohort of 64 patients with daily CBCTs. A similar approach has been used on a cohort of 16 patients [42]. In both studies, when facing logistic trouble with implementing the planning library (e.g., image quality, OAR filling, tumour deformations), a backup plan was used. We did not evaluate this approach. This strategy appears to be complementary with the proposed evaluative library and could potentially be combined.
The sub-ITV library appears to also be an attractive option for avoiding the highest OAR coverage observed with the ITV strategy (Table 1). The use of a library based on sub-ITVs decreased the dose (V40 Gy) to the bladder, rectum and bowel in comparison with the ITV approach [28,42]. Recently, statistical shape modelling was also used to assess the dose coverage probability of 5 patients with weekly CTs [43]. That shape analysis appeared to be an excellent planning tool for modelling patient-specific deformations. However, no ART strategies were simulated using this method in this study.
The choice of PTV margin is crucial. Minimizing PTV margins permits a drastically decreased dose to the OARs, but risks CTV underdosing. In the literature, these margins are either isotropic, ranging from 3 to 15 mm [4,5,9,19,22-28,44-48], or anisotropic, ranging from 15 to 24 mm in the AP direction, 8 to 15 mm in the SI, and 10 to 20 mm in the LR [6,8,14,17,44,49]. Using a standard technique, the rational PTV margin ensuring 95% CTV coverage has been found to be 13 mm if isotropic and 20 mm and 10 mm in the AP and SI-LR directions, respectively, if anisotropic [50]. In our study, a 10 mm PTV margin was chosen as our standard because this value is widely reported in the literature [5,9,25,26,45,48]. A PTV margin moderately reduced to 7 mm was clearly inadequate at properly covering the CTV with a standard RT strategy. In this context, we found that ART permitted decreased PTV margins, while still maintaining satisfactory VOI coverage (Table 1; Figure 3 a, b, c, d). In the same perspective, a RT strategy based on two sub-ITVs with a reduced 7 mm margin enabled 90% of the patients to benefit from a CTV coverage higher than 95%, while this coverage was observed in only 64% of the patients who underwent standard RT with 16-mm margins [27].
Accepted
Article
A limitation of our evolutive library is that it is an off-line approach and therefore cannot correct for the current fraction in the event of significant new anatomic variations, which are consequently considered only for the following fractions. In these cases, another option is, as mentioned previously, to use a 3D conformal radiation therapy back-up plan, though this option carries the risk of increasing the dose to the OAR [25,26]. Moreover, our strategy does not consider intra-fraction anatomic variations. The amplitude of intra-fraction displacement has been reported to be on average between 0.1 and 4.2 mm for the cervix and between 1.1 and 3.1 mm for the uterus. These displacements were less than 5 mm in more than 97% of the cases [7,13]. Our reduced PTV margin (7 mm) therefore appears to include the vast majority of these intra-fraction displacements. Another limitation of our evolutive library strategy may be its complexity, making it difficult to implement in daily practice. Image processing tools must therefore be developed to guide the physician in choosing the right plan from the library for each day’s fraction [25], as well as in updating the library with new anatomies. Such an implementation could be performed either through auto-segmentation [51] or with a non-rigid contour propagation with model constraint [52-54]. Moreover, delineation and dose calculation for replanning based on the CBCT is challenging due to limitations related to Hounsfield unit inconsistency, low image quality, and a limited field of view. In clinical practice, replanning could thus be performed by acquiring a new CT scan after treatment delivery. Magnetic resonance imaging-guided radiation therapy could also be employed instead of CBCT in the future.
Our study has several limitations. First, the study did not evaluate the impact of intra-fraction variation. Second, though this geometric analysis was performed on a series of 20 patients, only one had a dosimetric evaluation. Furthermore, with respect to dose calculation, all CBCT image densities were overridden, and the field of view was extended with the CT slices. The dose accumulation in the rectum and bladder was also subject to uncertainties related to dose warping, even if these have previously been shown to be limited [38]. Moreover, bi-weekly CBCTs provided limited image quality for contour delineation and ART guidance. Finally, the limited number of patients did not permit a subgroup analysis.
Accepted
Article
5. Conclusion
Evolutive library ART appears to be a personalized, original ART strategy that comprises a pretreatment planning library combined with one to three per-treatment replannings for half of patients. Based on the ratio between CTV and OAR coverage, the five RT strategies tested can be classified in the following order of decreasing performance: evolutive library; pretreatment library; ITV-based strategy; mid-treatment replanning; and standard RT. The evolutive library approach thus appears to be particularly attractive, as it also permits PTV margins to be reduced. Clinical studies must now be designed and conducted to confirm the feasibility and clinical benefits of this new ART strategy.
Figure 1: Tested RT strategies in cervical IMRT
CBCT: cone-beam CT; RT: radiotherapy
Each subfigure represents a simulated strategy: (1) Standard RT strategy, which uses the PTV defined on the intermediate bladder volume CT; (2) ITV-based RT strategy, using the PTV defined by the union of the three CTVs of the planning CTs with different bladder fillings (full [FB], intermediate [IB] and empty [EB]); (3) Standard RT strategy with an additional mid-treatment replanning at 20 Gy; (4) the pretreatment library strategy, which uses the best PTV of the three planning CTs at each treatment fraction; and (5) the evolutive library strategy, which is based on the pretreatment library that can be enriched by including CBCT anatomies (cf. Figure 2)
The green, red and dark blue shapes represent the FB, IB and EB CTV, respectively. The pink shape represents the ITV. The light blue shape represents the CTV from the CT at 20 Gy. The yellow shape represents the CTV (delineated on a CBCT) added into the pretreatment library.
Figure 2: Schema of the evolutive library strategy (5th scenario, see Figure 1). Whether a new CTV is included in the library depends on the result of the similarity test
MAX_DSC: maximum Sørensen-Dice similarity coefficient; CBCT: cone-beam CT; CTV: clinical target volume
The illustrated evolutive library is composed of the pretreatment library (3 CTVs) and one per-treatment CBCT replanning that was previously added. For each CBCT of the day, the similarity test calculated the DSC between the daily CBCT CTV and each of the evolutive library CTVs (resulting in this example of four values: α, β, ɣ, and δ). The maximum DSC (MAX_DSC) enabled the identification of the plan of the day (1) and informed whether the CTV of the day should be added to the evolutive library (2).
The red shapes represent the CTVs from the evolutive library. The green shape represents the CTV from the considered daily CBCT.
Accepted
Article
Figure 3: CTV (a), bladder (b), rectum (c) and bowel (d) coverage by the PTV provided by each strategy
CTV: clinical target volume; PTV: planning target volume; MidTtReplan: mid-treatment replanning; ITV: internal target volume based RT; PreTt Library: pretreatment library; StandardRT: standard radiotherapy; CBCT: cone-beam CT
The mean coverage of the CTV and OAR by the PTV was calculated for each patient and strategy. The figure presents the distribution (mean and range values) of this coverage among all patients, with 7 mm (red) and 10 mm (blue) PTV margins. The right section represents, for the evolutive library, CTV and OAR coverage by the increasing the number of CBCTs that were included in the library, i.e., by increasing the DSC threshold.
Figure 4: Template anatomy with a 10 mm PTV margin (a) and maps that represent the probability of an overlap between the PTV and the OAR (left side) or the CTV (right side) for each strategy (b)
CTV: clinical target volume; PTV: planning target volume; Mid-Tt Replan: mid-treatment replanning; ITV-based RT: internal target volume based RT; Standard RT: standard radiotherapy The represented OAR are the bladder, rectum and bowel. The method used to calculate the overlapping probability map is described in Figure S-5.
Figure 5: Estimated cumulated DVH of the CTV and the OAR of each strategy and the two PTV margins (7 and 10 mm) for one patient only
StandardRT: standard radiotherapy (red); ITV-based RT: internal target volume based RT (purple); PreTt Library: pretreatment library (brown); MidTtReplan: mid-treatment replanning (green); Evolutive library (blue)
Two approaches were considered in the estimation of the cumulated received doses: using deformable image registration for the rectum and the bladder and calculating the average value of the fraction doses for the CTV and the bowel. The selected patient was the one with the worst coverage of the CTV by the PTV (lowest value) with the “standard RT” strategy.
References
1. Naik A, Gurjar O, Gupta K, Singh K, Nag P, Bhandari V. Comparison of dosimetric parameters and acute toxicity of intensity-modulated and three-dimensional radiotherapy in patients with cervix carcinoma: A randomized prospective study. Cancer/Radiothérapie 2016;20:370-376. 2. Vargo JA, Kim H, Choi S, Sukumvanich P, Olawaiye AB, Kelley JL, Edwards RP, Comerci JT, Beriwal S.
Extended field intensity modulated radiation therapy with concomitant boost for lymph node–positive cervical cancer: Analysis of regional control and recurrence patterns in the positron emission tomography/computed tomography era. Int J Radiat Oncol Biol Phys 2014;90:1091-1098.
3. Gandhi AK, Sharma DN, Rath GK, Julka PK, Subramani V, Sharma S, Manigandan D, Laviraj M, Kumar S, Thulkar S. Early clinical outcomes and toxicity of intensity modulated versus
Accepted
Article
conventional pelvic radiation therapy for locally advanced cervix carcinoma: A prospective randomized study. Int J Radiat Oncol Biol Phys 2013;87:542-548.
4. Han Y, Shin EH, Huh SJ, Lee JE, Park W. Interfractional dose variation during intensity-modulated radiation therapy for cervical cancer assessed by weekly ct evaluation. Int J Radiat Oncol Biol Phys 2006;65:617-623.
5. Buchali A, Koswig S, Dinges S, Rosenthal P, Salk J, Lackner G, Böhmer D, Schlenger L, Budach V. Impact of the filling status of the bladder and rectum on their integral dose distribution and the movement of the uterus in the treatment planning of gynaecological cancer. Radiother Oncol 1999;52:29-34.
6. van de Bunt L, Jürgenliemk-Schulz IM, de Kort GA, Roesink JM, Tersteeg RJ, van der Heide UA. Motion and deformation of the target volumes during imrt for cervical cancer: What margins do we need? Radiother Oncol 2008;88:233-240.
7. Jadon R, Pembroke C, Hanna C, Palaniappan N, Evans M, Cleves A, Staffurth J. A systematic review of organ motion and image-guided strategies in external beam radiotherapy for cervical cancer. Clin Oncol 2014;26:185-196.
8. Kaatee RS, Olofsen MJ, Verstraate MB, Quint S, Heijmen BJ. Detection of organ movement in cervix cancer patients using a fluoroscopic electronic portal imaging device and radiopaque markers. Int J Radiat Oncol Biol Phys 2002;54:576-583.
9. Huh SJ, Park W, Han Y. Interfractional variation in position of the uterus during radical radiotherapy for cervical cancer. Radiother Oncol 2004;71:73-79.
10. Lee JE, Han Y, Huh SJ, Park W, Kang MG, Ahn YC, Lim DH. Interfractional variation of uterine position during radical rt: Weekly ct evaluation. Gynecol Oncol 2007;104:145-151.
11. Ahmad R, Hoogeman MS, Bondar M, Dhawtal V, Quint S, De Pree I, Mens JW, Heijmen BJ. Increasing treatment accuracy for cervical cancer patients using correlations between bladder-filling change and cervix–uterus displacements: Proof of principle. Radiother Oncol 2011;98:340-346.
12. Chan P, Dinniwell R, Haider MA, Cho Y-B, Jaffray D, Lockwood G, Levin W, Manchul L, Fyles A, Milosevic M. Inter-and intrafractional tumor and organ movement in patients with cervical cancer undergoing radiotherapy: A cinematic-mri point-of-interest study. Int J Radiat Oncol Biol Phys 2008;70:1507-1515.
13. Heijkoop ST, Langerak TR, Quint S, Mens JWM, Zolnay AG, Heijmen BJ, Hoogeman MS. Quantification of intra-fraction changes during radiotherapy of cervical cancer assessed with pre-and post-fraction cone beam ct scans. Radiother Oncol 2015;117:536-541.
14. Taylor A, Powell ME. An assessment of interfractional uterine and cervical motion: Implications for radiotherapy target volume definition in gynaecological cancer. Radiother Oncol 2008;88:250-257.
15. Bondar L, Hoogeman M, Mens JW, Dhawtal G, De Pree I, Ahmad R, Quint S, Heijmen B. Toward an individualized target motion management for imrt of cervical cancer based on model-predicted cervix–uterus shape and position. Radiother Oncol 2011;99:240-245.
16. Haripotepornkul NH, Nath SK, Scanderbeg D, Saenz C, Yashar CM. Evaluation of intra-and inter-fraction movement of the cervix during intensity modulated radiation therapy. Radiother Oncol 2011;98:347-351.
17. Ahmad R, Hoogeman MS, Quint S, Mens JW, de Pree I, Heijmen BJ. Inter-fraction bladder filling variations and time trends for cervical cancer patients assessed with a portable 3-dimensional ultrasound bladder scanner. Radiother Oncol 2008;89:172-179.
18. Eminowicz G, Motlib J, Khan S, Perna C, McCormack M. Pelvic organ motion during radiotherapy for cervical cancer: Understanding patterns and recommended patient preparation. Clin Oncol 2016.
19. van de Bunt L, Van der Heide UA, Ketelaars M, de Kort GA, Jürgenliemk-Schulz IM. Conventional, conformal, and intensity-modulated radiation therapy treatment planning of external beam
Accepted
Article
radiotherapy for cervical cancer: The impact of tumor regression. Int J Radiat Oncol Biol Phys 2006;64:189-196.
20. Lim K, Chan P, Dinniwell R, Fyles A, Haider M, Cho Y-B, Jaffray D, Manchul L, Levin W, Hill RP. Cervical cancer regression measured using weekly magnetic resonance imaging during fractionated radiotherapy: Radiobiologic modeling and correlation with tumor hypoxia. Int J Radiat Oncol Biol Phys 2008;70:126-133.
21. Beadle BM, Jhingran A, Salehpour M, Sam M, Iyer RB, Eifel PJ. Cervix regression and motion during the course of external beam chemoradiation for cervical cancer. Int J Radiat Oncol Biol Phys 2009;73:235-241.
22. Lim K, Stewart J, Kelly V, Xie J, Brock KK, Moseley J, Cho Y-B, Fyles A, Lundin A, Rehbinder H. Dosimetrically triggered adaptive intensity modulated radiation therapy for cervical cancer. Int J Radiat Oncol Biol Phys 2014;90:147-154.
23. Oh S, Stewart J, Moseley J, Kelly V, Lim K, Xie J, Fyles A, Brock KK, Lundin A, Rehbinder H, Milosevic M, Jaffray D, Cho YB. Hybrid adaptive radiotherapy with on-line mri in cervix cancer imrt. Radiother Oncol 2014;110:323-328.
24. Stewart J, Lim K, Kelly V, Xie J, Brock KK, Moseley J, Cho Y-B, Fyles A, Lundin A, Rehbinder H. Automated weekly replanning for intensity-modulated radiotherapy of cervix cancer. Int J Radiat Oncol Biol Phys 2010;78:350-358.
25. Langerak T, Heijkoop S, Quint S, Mens J-W, Heijmen B, Hoogeman M. Towards automatic plan selection for radiotherapy of cervical cancer by fast automatic segmentation of cone beam ct scans Medical image computing and computer-assisted intervention–miccai 2014: Springer; 2014. pp. 528-535.
26. Heijkoop ST, Langerak TR, Quint S, Bondar L, Mens JWM, Heijmen BJ, Hoogeman MS. Clinical implementation of an online adaptive plan-of-the-day protocol for nonrigid motion management in locally advanced cervical cancer imrt. Int J Radiat Oncol Biol Phys 2014;90:673-679.
27. Bondar M, Hoogeman M, Mens J, Quint S, Ahmad R, Dhawtal G, Heijmen B. Individualized nonadaptive and online-adaptive intensity-modulated radiotherapy treatment strategies for cervical cancer patients based on pretreatment acquired variable bladder filling computed tomography scans. Int J Radiat Oncol Biol Phys 2012;83:1617-1623.
28. Seppenwoolde Y, Stock M, Buschmann M, Georg D, Bauer-Novotny K-Y, Pötter R, Georg P. Impact of organ shape variations on margin concepts for cervix cancer art. Radiother Oncol 2016.
29. van de Schoot AJ, de Boer P, Visser J, Stalpers LJ, Rasch CR, Bel A. Dosimetric advantages of a clinical daily adaptive plan selection strategy compared with a non-adaptive strategy in cervical cancer radiation therapy. Acta Oncol 2017;56:667-674.
30. Pecorelli S, Zigliani L, Odicino F. Revised figo staging for carcinoma of the cervix. International Journal of Gynecology & Obstetrics 2009;105:107-108.
31. Pötter R, Haie-Meder C, Van Limbergen E, Barillot I, De Brabandere M, Dimopoulos J, Dumas I, Erickson B, Lang S, Nulens A. Recommendations from gynaecological (gyn) gec estro working group (ii): Concepts and terms in 3d image-based treatment planning in cervix cancer brachytherapy—3d dose volume parameters and aspects of 3d image-based anatomy, radiation physics, radiobiology. Radiother Oncol 2006;78:67-77.
32. Taylor A, Rockall AG, Reznek RH, Powell ME. Mapping pelvic lymph nodes: Guidelines for delineation in intensity-modulated radiotherapy. Int J Radiat Oncol Biol Phys 2005;63:1604-1612.
33. Dice LR. Measures of the amount of ecologic association between species. Ecology 1945;26:297-302.
34. Gobeli M, Simon A, Getain M, Leseur J, Lahlou E, Lafond C, Dardelet E, Williaume D, Rigaud B, de Crevoisier R. Benefit of a pretreatment planning library-based adaptive radiotherapy for cervix carcinoma? Cancer Radiother 2015;19:471-478.
Accepted
Article
35. Rigaud B, Simon A, Castelli J, Gobeli M, Ospina Arango JD, Cazoulat G, Henry O, Haigron P, De Crevoisier R. Evaluation of deformable image registration methods for dose monitoring in head and neck radiotherapy. Biomed Res Int 2015;2015:726268.
36. Cazoulat G, Simon A, Dumenil A, Gnep K, De Crevoisier R, Acosta O, Haigron P. Surface-constrained nonrigid registration for dose monitoring in prostate cancer radiotherapy. IEEE Trans Med Imaging 2014;33:1464-1474.
37. Graves YJ, Smith A-A, Mcilvena D, Manilay Z, Lai YK, Rice R, Mell L, Jia X, Jiang SB, Cerviño L. A deformable head and neck phantom with in-vivo dosimetry for adaptive radiotherapy quality assurance. Med Phys 2015;42:1490-1497.
38. Nassef M, Simon A, Cazoulat G, Duménil A, Blay C, Lafond C, Acosta O, Balosso J, Haigron P, de Crevoisier R. Quantification of dose uncertainties in cumulated dose estimation compared to planned dose in prostate imrt. Radiother Oncol 2016;119:129-136.
39. Mencarelli A, van Kranen SR, Hamming-Vrieze O, van Beek S, Rasch CRN, van Herk M, Sonke J-J. Deformable image registration for adaptive radiation therapy of head and neck cancer: Accuracy and precision in the presence of tumor changes. Int J Radiat Oncol Biol Phys 2014;90:680-687.
40. Yeo U, Taylor M, Supple J, Smith R, Dunn L, Kron T, Franich R. Is it sensible to “deform” dose? 3d experimental validation of dose‐warping. Med Phys 2012;39:5065-5072.
41. Mayr NA, Yuh WT, Magnotta VA, Ehrhardt JC, Wheeler JA, Sorosky JI, Davis CS, Wen B-C, Martin DD, Pelsang RE. Tumor perfusion studies using fast magnetic resonance imaging technique in advanced cervical cancer: A new noninvasive predictive assay. Int J Radiat Oncol Biol Phys 1996;36:623-633.
42. Buschmann M, Majercakova K, Sturdza A, Smet S, Najjari D, Daniel M, Pötter R, Georg D, Seppenwoolde Y. Image guided adaptive external beam radiation therapy for cervix cancer: Evaluation of a clinically implemented plan-of-the-day technique. Zeitschrift für Medizinische Physik 2017.
43. Tilly D, van de Schoot AJ, Grusell E, Bel A, Ahnesjö A. Dose coverage calculation using a statistical shape model—applied to cervical cancer radiotherapy. Phys Med Biol 2017;62:4140.
44. Lim K, Kelly V, Stewart J, Xie J, Cho Y-B, Moseley J, Brock K, Fyles A, Lundin A, Rehbinder H. Pelvic radiotherapy for cancer of the cervix: Is what you plan actually what you deliver? Int J Radiat Oncol Biol Phys 2009;74:304-312.
45. Georg P, Georg D, Hillbrand M, Kirisits C, Pötter R. Factors influencing bowel sparing in intensity modulated whole pelvic radiotherapy for gynaecological malignancies. Radiother Oncol 2006;80:19-26.
46. Taylor A, Powell M. Conformal and intensity-modulated radiotherapy for cervical cancer. Clin Oncol 2008;20:417-425.
47. Whelan B, Kumar S, Dowling J, Begg J, Lambert J, Lim K, Vinod SK, Greer PB, Holloway L. Utilising pseudo-ct data for dose calculation and plan optimization in adaptive radiotherapy. Australas Phys Eng Sci Med 2015;38:561-568.
48. Nováková E, Heijkoop S, Quint S, Zolnay A, Mens J, Godart J, Heijmen B, Hoogeman M. What is the optimal number of library plans in art for locally advanced cervical cancer? Radiother Oncol 2017.
49. Lee CM, Shrieve DC, Gaffney DK. Rapid involution and mobility of carcinoma of the cervix. Int J Radiat Oncol Biol Phys 2004;58:625-630.
50. Khan A, Jensen LG, Sun S, Song WY, Yashar CM, Mundt AJ, Zhang F-q, Jiang SB, Mell LK. Optimized planning target volume for intact cervical cancer. Int J Radiat Oncol Biol Phys 2012;83:1500-1505.
51. Bondar ML, Hoogeman M, Schillemans W, Heijmen B. Intra-patient semi-automated segmentation of the cervix–uterus in ct-images for adaptive radiotherapy of cervical cancer. Phys Med Biol 2013;58:5317.
Accepted
Article
52. Zhang C, Christensen GE, Murphy MJ, Weiss E, Williamson JF. Non-rigid image registration with equally weighted assimilated surface constraint. International Workshop on Biomedical Image Registration. Springer. 2014. pp. 31-40.
53. Bondar L, Hoogeman MS, Osorio EMV, Heijmen BJ. A symmetric nonrigid registration method to handle large organ deformations in cervical cancer patients. Med Phys 2010;37:3760-3772. 54. Ghose S, Holloway L, Lim K, Chan P, Veera J, Vinod SK, Liney G, Greer PB, Dowling J. A review of
segmentation and deformable registration methods applied to adaptive cervical cancer radiation therapy treatment planning. Artif Intell Med 2015;64:75-87.
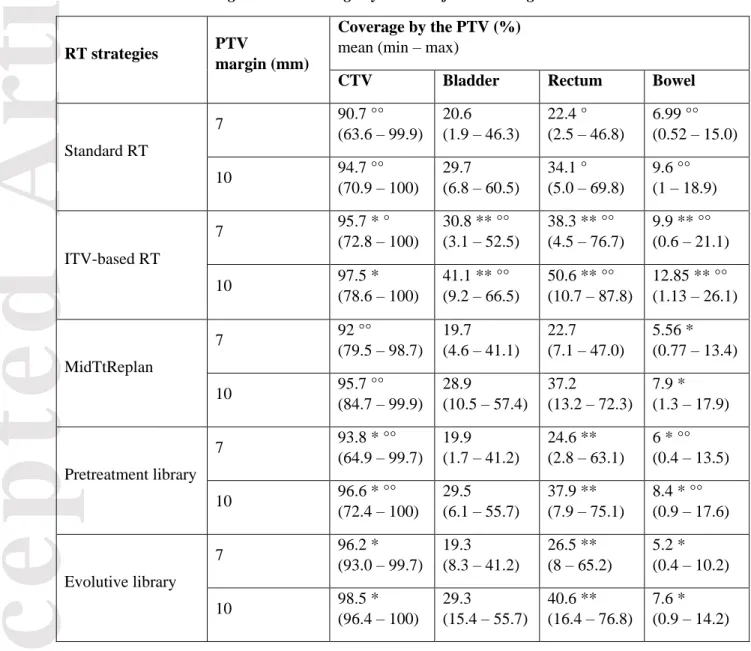
Table 1: CTV and OAR geometric coverage by the PTV for all strategies
RT strategies PTV
margin (mm)
Coverage by the PTV (%) mean (min – max)
CTV Bladder Rectum Bowel
Standard RT 7 90.7 °° (63.6 – 99.9) 20.6 (1.9 – 46.3) 22.4 ° (2.5 – 46.8) 6.99 °° (0.52 – 15.0) 10 94.7 °° (70.9 – 100) 29.7 (6.8 – 60.5) 34.1 ° (5.0 – 69.8) 9.6 °° (1 – 18.9) ITV-based RT 7 95.7 * ° (72.8 – 100) 30.8 ** °° (3.1 – 52.5) 38.3 ** °° (4.5 – 76.7) 9.9 ** °° (0.6 – 21.1) 10 97.5 * (78.6 – 100) 41.1 ** °° (9.2 – 66.5) 50.6 ** °° (10.7 – 87.8) 12.85 ** °° (1.13 – 26.1) MidTtReplan 7 92 °° (79.5 – 98.7) 19.7 (4.6 – 41.1) 22.7 (7.1 – 47.0) 5.56 * (0.77 – 13.4) 10 95.7 °° (84.7 – 99.9) 28.9 (10.5 – 57.4) 37.2 (13.2 – 72.3) 7.9 * (1.3 – 17.9) Pretreatment library 7 93.8 * °° (64.9 – 99.7) 19.9 (1.7 – 41.2) 24.6 ** (2.8 – 63.1) 6 * °° (0.4 – 13.5) 10 96.6 * °° (72.4 – 100) 29.5 (6.1 – 55.7) 37.9 ** (7.9 – 75.1) 8.4 * °° (0.9 – 17.6) Evolutive library 7 96.2 * (93.0 – 99.7) 19.3 (8.3 – 41.2) 26.5 ** (8 – 65.2) 5.2 * (0.4 – 10.2) 10 98.5 * (96.4 – 100) 29.3 (15.4 – 55.7) 40.6 ** (16.4 – 76.8) 7.6 * (0.9 – 14.2)
These coverage values corresponded to the percentage of the volume of interest overlap with the PTV. * (respectively, **) indicates that the tested strategy provided a significantly better (respectively, worse) mean coverage across all patients compared with the standard RT strategy.
° (respectively, °°) indicates that the tested strategy provided a significantly better (respectively, worse) mean coverage across all patients compared with the evolutive library strategy.
A better strategy was defined as either increased CTV coverage or decreased OAR coverage, as evaluated using the signed-rank Wilcoxon test.
PTV: planning target volume; CTV: clinical target volume; OAR: organ at risk; RT: radiotherapy; ITV: internal target volume
Accepted
Article
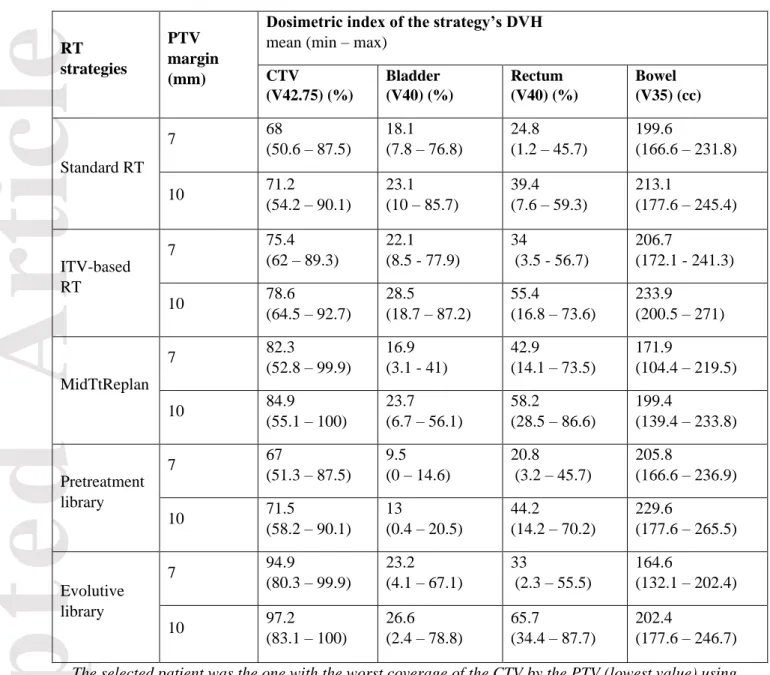
Table 2: Dosimetric indices of the CTV and the OAR stratified by strategy and the two PTV margins (7 and 10 mm) for one selected patient
RT strategies
PTV margin (mm)
Dosimetric index of the strategy’s DVH mean (min – max)
CTV (V42.75) (%) Bladder (V40) (%) Rectum (V40) (%) Bowel (V35) (cc) Standard RT 7 68 (50.6 – 87.5) 18.1 (7.8 – 76.8) 24.8 (1.2 – 45.7) 199.6 (166.6 – 231.8) 10 71.2 (54.2 – 90.1) 23.1 (10 – 85.7) 39.4 (7.6 – 59.3) 213.1 (177.6 – 245.4) ITV-based RT 7 75.4 (62 – 89.3) 22.1 (8.5 - 77.9) 34 (3.5 - 56.7) 206.7 (172.1 - 241.3) 10 78.6 (64.5 – 92.7) 28.5 (18.7 – 87.2) 55.4 (16.8 – 73.6) 233.9 (200.5 – 271) MidTtReplan 7 82.3 (52.8 – 99.9) 16.9 (3.1 - 41) 42.9 (14.1 – 73.5) 171.9 (104.4 – 219.5) 10 84.9 (55.1 – 100) 23.7 (6.7 – 56.1) 58.2 (28.5 – 86.6) 199.4 (139.4 – 233.8) Pretreatment library 7 67 (51.3 – 87.5) 9.5 (0 – 14.6) 20.8 (3.2 – 45.7) 205.8 (166.6 – 236.9) 10 71.5 (58.2 – 90.1) 13 (0.4 – 20.5) 44.2 (14.2 – 70.2) 229.6 (177.6 – 265.5) Evolutive library 7 94.9 (80.3 – 99.9) 23.2 (4.1 – 67.1) 33 (2.3 – 55.5) 164.6 (132.1 – 202.4) 10 97.2 (83.1 – 100) 26.6 (2.4 – 78.8) 65.7 (34.4 – 87.7) 202.4 (177.6 – 246.7) The selected patient was the one with the worst coverage of the CTV by the PTV (lowest value) using the “standard RT” strategy.
The mean and range values are displayed. For each volume of interest and strategy, dose indices were extracted from the estimated cumulated DVHs of the patient. The dosimetric objectives were ≥ 95% for the CTV, < 40% for the bladder and rectum and < 500cc for the bowel. Two approaches were considered to estimate the cumulated received doses: using deformable image registration for the rectum and the bladder and calculating the average value of the fraction doses for the CTV and the bowel.
PTV: planning target volume; DVH: dose-volume histogram; CTV: clinical target volume; RT: radiotherapy; ITV: internal target volume