HAL Id: inserm-00254870
https://www.hal.inserm.fr/inserm-00254870
Submitted on 14 Feb 2008HAL is a multi-disciplinary open access archive for the deposit and dissemination of sci-entific research documents, whether they are pub-lished or not. The documents may come from teaching and research institutions in France or abroad, or from public or private research centers.
L’archive ouverte pluridisciplinaire HAL, est destinée au dépôt et à la diffusion de documents scientifiques de niveau recherche, publiés ou non, émanant des établissements d’enseignement et de recherche français ou étrangers, des laboratoires publics ou privés.
Temporal envelope processing in the human auditory
cortex: Response and interconnections of auditory
cortical areas.
Boris Gourévitch, Régine Le Bouquin Jeannès, Gérard Faucon, Catherine
Liégeois-Chauvel
To cite this version:
Boris Gourévitch, Régine Le Bouquin Jeannès, Gérard Faucon, Catherine Liégeois-Chauvel. Temporal envelope processing in the human auditory cortex: Response and interconnections of auditory cortical areas.. Hearing Research, Elsevier, 2008, 237 (1-2), pp.1-18. �10.1016/j.heares.2007.12.003�. �inserm-00254870�
Temporal envelope processing in the human
auditory cortex: response and interconnections of
auditory cortical areas.
Boris Gourévitch1,2, Régine Le Bouquin Jeannès1,2, Gérard Faucon1,2, Catherine Liégeois-Chauvel3
1 INSERM, U642, Rennes, F-35000 France 2 Université de Rennes 1, LTSI, F-35000, France
LTSI, Campus de Beaulieu, Université de Rennes 1, 35042 Rennes Cedex, France phone: +33 2 23 23 62 20, fax: +33 2 23 23 69 17, email: boris @pi314.net,
3 INSERM U751, 13000 Marseille, France; Univ. Méditerranée, Marseille, F-13000
France; CHU Marseille, Hôpital la Timone, Service de Neurophysiologie Clinique, Marseille, 13000 France
HAL author manuscript inserm-00254870, version 1
HAL author manuscript
Hearing Research 2007;:epub ahead of print
HAL author manuscript inserm-00254870, version 1
HAL author manuscript
Abstract
Temporal envelope processing in the human auditory cortex has an important role in language analysis. In this paper, depth recordings of local field potentials in response to amplitude modulated white noises were used to design maps of activation in primary, secondary and associative auditory areas and to study the propagation of the cortical activity between them. The comparison of activations between auditory areas was based on a signal-to-noise ratio associated with the response to amplitude modulation (AM). The functional connectivity between cortical areas was quantified by the directed coherence (DCOH) applied to auditory evoked potentials. This study shows the following reproducible results on twenty subjects: 1) the primary auditory cortex (PAC), the secondary cortices (secondary auditory cortex (SAC) and planum temporale (PT)), the insular gyrus, the Brodmann area (BA) 22 and the posterior part of T1 gyrus (T1Post) respond to AM in both hemispheres. 2) A stronger response to AM was observed in SAC and T1Post of the left hemisphere independent of the modulation frequency (MF), and in the left BA22 for MFs 8 and 16 Hz, compared to those in the right. 3) The activation and propagation features emphasized at least four different types of temporal processing. 4) A sequential activation of PAC, SAC and BA22 areas was clearly visible at all MFs, while other auditory areas may be more involved in parallel processing upon a stream originating from primary auditory area, which thus acts as a distribution hub. These results suggest that different psychological information is carried by the temporal envelope of sounds relative to the rate of amplitude modulation.
Keywords - Amplitude modulation, Temporal envelope, Auditory cortex, Human, Hearing, Directed coherence.
Introduction
The perception of speech involves several areas of the human cortex, most of them concentrated in the temporal lobe. However, due to the complex nature of speech, the underlying mechanisms of its perception are not yet clear. A way to address some of these mechanisms is to isolate the temporal components of vocalizations associated with speech. The classification of these components has now been clearly established: the fastest ones, above 100 Hz, code for a fundamental frequency called pitch (Smith et al., 2002), and the harmonics thereof define fine features like timbre or loudness. Temporal variations from ~20 Hz up to 100 Hz determine sound periodicity (Rosen, 1992) also called periodicity pitch (Flanagan et al., 1960). They are associated with virtual pitch height (Burns et al., 1976; Miller et al., 1948; Ritsma, 1962) and roughness (Pressnitzer et al., 1999; Terhardt, 1974). The temporal envelope of speech usually features among the slowest amplitude modulations (AM) between 2 and about 50 Hz. They convey the sensations of tempos and rhythms (Drake et al., 1993; Fraisse, 1967; Friberg et al., 1995) and those which are most pronounced are associated with the syllabic cadency around 3-4 Hz (Houtgast et al., 1985; Steeneken et al., 1980). Thus, the temporal envelope is crucial for intelligibility of speech.
This paper deals with the temporal envelope processing in the human auditory areas of the temporal lobe. The representation of temporal sound envelopes in the human auditory cortex has been extensively studied by means of sinusoidal amplitude modulated (AM) white noise stimuli. Such stimuli have wideband long-term power spectra and so they excite all auditory nerve fibers. In response to these stimuli, electroencephalographic analysis revealed oscillating electrical activity in the auditory brain areas (Pantev et al., 1988; Picton et al., 1987). This activity is phase-locked with temporal amplitude variations and is observed when a sufficient number of neurons (around 10 to 5 10 ) are activated 7
synchronously (Eggermont et al., 2002; Hämäläinen et al., 1993; Nunez, 1981).
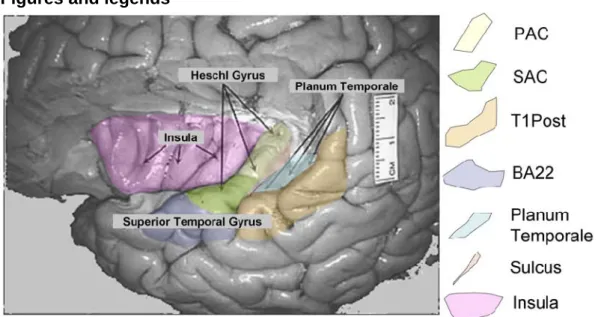
Consequently, this oscillation almost perfectly reproduces the AM frequency but its amplitude varies with the recording location. Intracerebral recordings (stereo-electroencephalography, SEEG (Bancaud et al., 1965; Talairach et al., 1974)) have revealed a visible response to temporal envelope in the following auditory areas (Liégeois-Chauvel et al., 2004):
- Primary Auditory Cortex (PAC) - Secondary Auditory Cortex (SAC)
- Posterior part of the Superior Temporal Gyrus (T1 Post)
- Anterior part of the Superior Temporal Gyrus, i.e. Brodmann area 22 (BA22) - Planum Temporale (PT)
- Insula
- Sulcus between PAC and PT (Sulcus).
The status of the Sulcus is controversial. Some studies found primary-like features (Liégeois-Chauvel et al., 1994; Wallace et al., 2002) while others considered it as part of the lateral belt (Rademacher et al., 1993; Sweet et al., 2005). In addition to vestibular functions, the insular gyrus is partially involved in auditory processing (Braak, 1978; Galaburda et al., 1980; Liégeois-Chauvel et al., 1991; Liégeois-Chauvel et al., 1994; Liégeois-Chauvel et al., 2004; Morosan et al., 2001). Consistent with results reported in the literature, these reports showed or confirmed:
- an encoding of amplitude modulation frequency in the human auditory cortex for modulation frequencies below 64 Hz, in agreement with a number of psychoacoustical studies,
- a predominant response of auditory cortical areas to the low modulation frequencies (4-16 Hz) known to be crucial for speech perception,
- differences in temporal resolution across human auditory cortical areas; the highest resolution is found in PAC and insula in both hemispheres,
- no (clear) reproducible spatial mapping of modulation frequency within the human auditory cortex, but existence of specific neuron groups and functional maps for AM for several patients,
- inter-hemispheric differences with the highest responses in left hemisphere for SAC and T1 Post areas; moreover, lower best modulation frequencies (BMFs) are reported more frequently in left T1 Post than in right T1 Post, and more frequently in right SAC than in left SAC.
A complementary approach to the study of the response strength to AM relates to the dynamics of the processing, i.e. the evoked connectivity. To our knowledge, anatomical and functional connectivity in the human auditory cortex have rarely been studied. These two types of connectivity are not necessarily correlated, at least in animals (Eggermont et al., 1996). Concerning anatomical connectivity, most results derive from animal experiments whose anatomical framework is then extrapolated to human beings. The auditory cortex of the primate is subdivided into 3 areas whose corresponding areas in the human cortex are indicated in parenthesis. The core has similar primary-like features (PAC, possibly Sulcus) and is surrounded by a belt of fields (SAC (Wallace et al., 2002), possibly Sulcus), as well as a more lateral parabelt of fields at a third level of processing (PT (Sweet et al., 2005), possibly BA22 and T1Post). One has to note that although BA22 and T1Post areas are generally considered as parabelt areas based on their localization on the lateral temporal sulcus similar to that of parabelt areas in macaque, this has still to be confirmed by comparative architectonic studies as in (Sweet et al., 2005; Wallace et al., 2002). In any case, most studies have shown that auditory information may be distributed from the core areas to surrounding belts that relay information to parabelt regions (for review, (Kaas et
al., 2000; Kaas et al., 1999)). Anatomical connectivity in human beings has been studied on post-mortem human brains by use of tracer injections (Galuske et al., 1999; Mesulam, 1979; Rivier et al., 1997; Tardif et al., 2001), which prevents observation of the propagation of evoked activity in vivo. Connectivity from the PAC to SAC and PT has generally been observed (Tardif et al., 2001).
In the human auditory cortex, functional connectivity can be deduced from latencies of EEG components (Godey et al., 2001; Pantev et al., 1995; Schwartz, 1998; Yoshiura et al., 1995; Yvert et al., 2005; Yvert et al., 2002) or from direct electrical stimulation (Brugge et al., 2003; Howard et al., 2000; Penfield et al., 1963). Using clicks or short tone bursts, the source of middle latencies (13-75ms) was found in medial Heschl’s Gyrus (HG) with a postero-anterior and medio-lateral propagation of activity until the Sulcus, PT and possibly anterior part of T1Post. The source for very long latency (>150ms) components was found in PT and BA22. In one case study, direct electrical stimulation of HG resulted in auditory evoked potentials (AEPs) in an area that overlapped with the T1Post area (Howard et al., 2000) and the BA22 area (Brugge et al., 2003). These latter areas also exhibited longer time constants than HG. These results suggest that the PT, BA22 and T1Post areas receive a corticocortical input either directly or indirectly from HG.
Functional connectivity can also be detected by signal analysis tools such the Directed Coherence (Saito et al., 1981). Directed Coherence (DCOH) has been widely used with EEG and AEP data especially by Takigawa and his team, for studies of light therapy (Takigawa, 1988), connections between cerebral hemispheres (Wang et al., 1992a; Wang et al., 1992b), links between the frontal and the occipital cortices for alpha rhythm (Wang et al., 2002), in epileptic patients (Takigawa et al., 1996), functional interactions between cortical areas for rats under methamphetamine (Takigawa et al., 2000), and influence of transcranial magnetic stimulation (Jing et al., 2000; Jing et al., 2001a; Jing et al., 2001b). In
a previous case study (Guéguin et al., 2006), Directed Coherence was applied to depth recorded AEPs in response to amplitude modulated white noise, mainly showing unidirectional functional connection from the primary to secondary auditory cortex, major auditory propagation from the posterior areas to the anterior ones, particularly at 8, 16, and 32 Hz, and a particular role of Heschl’s Sulcus in dispatching information to the different auditory areas.
In the present study, we extend the results of (Guéguin et al., 2006; Liégeois-Chauvel et al., 2004). We use the same type of SEEG recordings, also called local field potentials (LFPs). In addition to the mapping of responses in (Liégeois-Chauvel et al., 2004), we compare for each MF the response strength to AM by introducing a dimensionless quantity, i.e., the Signal-to-Noise Ratio (SNR) associated with the observed oscillations, allowing us to pool data over MFs and subjects.
Similarly to (Guéguin et al., 2006), we also use the Directed Coherence algorithm to provide causality estimates between auditory evoked potentials. However, because of the larger database (20 subjects versus 4), we are able to measure significant reproducible activation streams across subjects. We also combine both SNR and DCOH measures over the entire database of subjects that result in global schemes of temporal envelope processing in human auditory cortex. By combining SNR and DCOH, we also show that at least four different types of processing occur in different MF bands (<8 Hz, 8/16 Hz, 32/64 Hz, and > 64 Hz).
Materials and methods
Patients and stimuliDetails of the protocol may be found in (Liégeois-Chauvel et al., 2004). Twenty epileptic patients suffering from partial refractory epilepsy were implanted with chronic SEEG electrodes (Bancaud et al., 1965), (Talairach et al., 1988) in various cortical
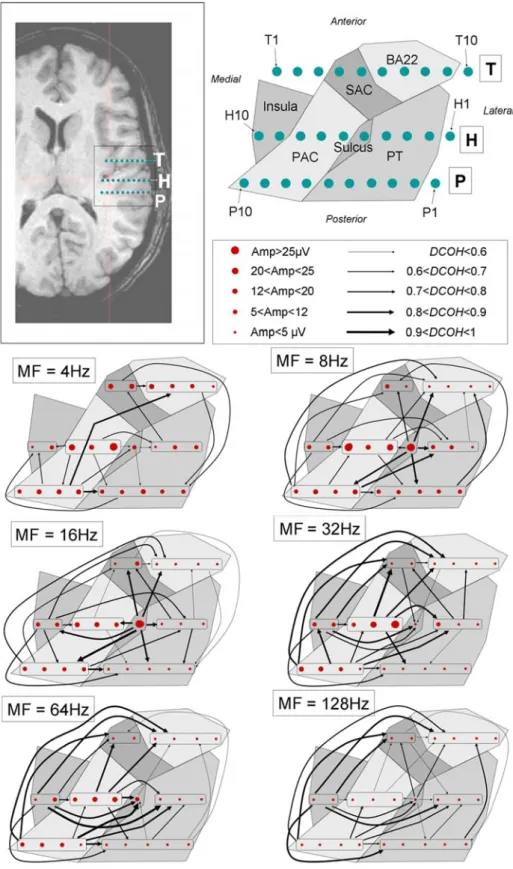
structures for surgery exploration. They were informed about the research protocol during SEEG and gave their fully informed consent for participating in this study. All clinical investigations have been conducted according to the principles expressed in the Declaration of Helsinki. Anatomical localization of each lead was based on a stereotaxic method described in previous studies (e.g. (Liégeois-Chauvel et al., 1991; Liégeois-Chauvel et al., 2004; Talairach et al., 1988)). We only considered leads in or near auditory areas for our study. They are represented in Fig. 1. The auditory areas considered in this study are those mentioned in the Introduction. A total of 209 leads in the right (9 patients) or left (11 patients) auditory cortex were available in the whole database.
(insert Fig. 1 here)
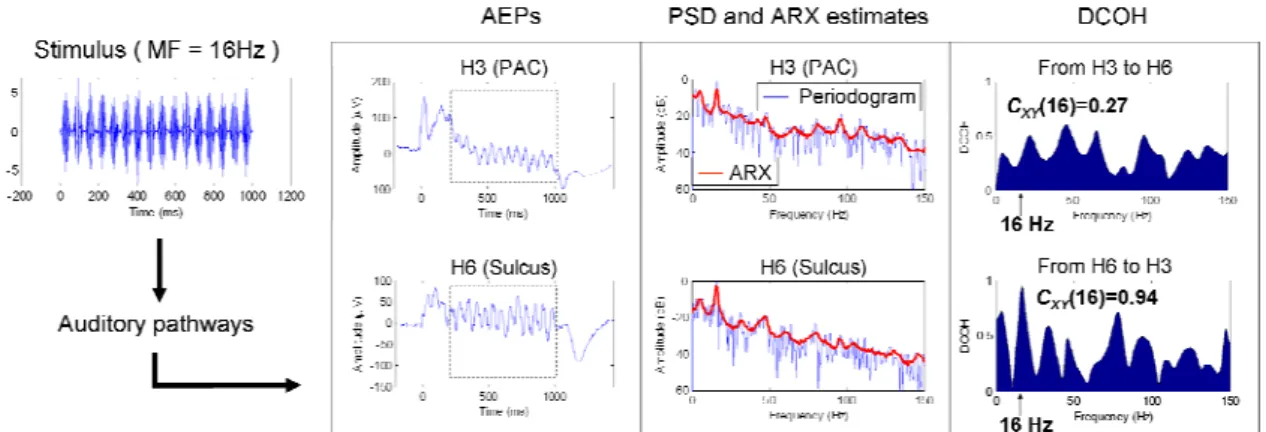
Stimuli were 1-second long sinusoidal-amplitude-modulated white noise at frequencies 4, 8, 16, 32, 64, and 128 Hz and a modulation depth of 100 %.
Cortical responses
Between 50 and 100 LFPs for each lead and each MF were recorded at 1 kHz sampling frequency. AEPs are the stimulus triggered averages of the LFPs (Picton et al., 1974) for each lead and each MF. In the LFPs and the AEPs, only time windows showing clear oscillations and absence of transient responses were considered. This resulted in time intervals of either [200;1000] ms or [250;1000] ms according to the lead chosen.
A typical AEP in response to AM noise (and a fortiori each LFP) consists of a transient response after the stimulus, followed by a sustained oscillating response (Fig. 3 in (Liégeois-Chauvel et al., 2004)). We did not observe any decrease in sustained response strength over time after AM noise onset or with stimulus repetition.
Signal to noise ratio estimation for AM response
For each lead and a given MF, we estimate the SNR for the oscillating activity associated with the MF. For this we need an estimate of the response strength to AM based on the oscillation amplitude, and an estimate of the background EEG activity at the MF.
Relative to the response strength to AM, we estimate the Power Spectral Density (PSD)
γ of a cortical response using cross-products of LFPs spectra, so that
∑ ∑
= = ≠ − = p k p k j j j k f X f X p p f 1 1, ) ( * ) ( ( ) ( ) ) 1 ( 1 ) ( ˆ γ . (1)where p is the number of LFPs for this lead, f is the frequency, ( )( )
f
X k is the Fourier
transform of the k-th LFP ( )( )
t
x k and * denotes conjugate operator. We have
) ( ˆ 1 1 ) ( ) ( 1 ) ( ˆ * f p f X f X p p f γC γ − − −
= where X( f) denotes the Fourier transform of the
AEP x(t), and ˆ ( ) 1 ( ) ( )( ) 1 * ) ( f X f X p f k p k k C
∑
= =γ is the classical PSD estimate associated to the lead. Consequently, $( )γ f is real. An important point is that in Eq.(1), the
cross-products of LFPs spectra dramatically decrease the asynchronous background activity in the LFPs. This, to a certain extent, $( )γ f allows us to abolish the background cortical
response that has no relation with temporal envelope processing. This approach has been shown to be very robust compared to numerous other denoising techniques (Gourévitch et al., 2004).
The second step of SNR computation is the estimation of the PSD ˆγN of the background EEG activity at the MF. Since the spontaneous EEG activity is not available in our study, we obtain ˆγN by subtracting the AEP x from each LFP ( )j
x , which gives after
Fourier transform:
(
) (
)
∑
= − − = p k k k N X f X f X f X f p f 1 ) ( * ) ( ( ) ( ) ( ) ( ) 1 ) ( ˆ γ . (2)Then, we slightly smooth out the noise PSD estimation by carrying out a spline interpolation around the MF to take into account the residual oscillation possibly present in
) ( ) ( ) ( f X f
X k − . In all auditory areas, this EEG activity without oscillation has a low-pass
spectrum.
Finally, let f be the frequency of the spectral peak closest to the MF in 0
γ
$( )
f
. Wethen estimate the SNR for the EEG oscillating activity for each lead and the given MF by $ $ 0 10 0 ( ) 10log ( ) N f SNR f γ γ ⎛ ⎞ = ⎜⎜ ⎟⎟ ⎝ ⎠. (3)
The PSDs γˆ , ˆγN and γˆ , the oscillation amplitude estimation and the SNR computation in C the case of an AM at 16 Hz are illustrated in Fig. 2.
(insert Fig. 2 here)
DCOH – information flow estimation between two leads
We also want to estimate the flow between the neuron groups associated to two leads for a given MF f . For this purpose, we use the DCOH estimate. A bivariate AR model m
(ARX) is considered between two signals X and Y and described by the vectorial model
1 ( ) ( ) ( ) 0 ( ) ( ) ( ) ( ) ( ) 0 ( ) ( ) ( ) x p xx xy xx xs s yx yy ys yy k y W t a k a k b b X t X t k W t a k a k b b Y t Y t k W t = ⎡ ⎤ − ⎡ ⎤ ⎡ ⎤ ⎡ ⎤= ⎡ ⎤+ ⎢ ⎥ ⎢ ⎥ ⎢ ⎥ ⎢ ⎥ ⎢ − ⎥ ⎢ ⎥ ⎣ ⎦ ⎣ ⎦⎣ ⎦ ⎣ ⎦⎢ ⎥ ⎣ ⎦
∑
(4)where variables b , ij i j, ∈
{
x s y, ,}
are weight factors, E WW⎣⎡ i j⎤ =⎦ 0, i j, ∈{
x s y, ,}
, i≠ jand variance V W
[ ]
i = , 1 i∈{
x s y, ,}
. Discrete Fourier transform of the eq (4) gives thespectral equivalent model
0 0 x s y x s y W xx xy xx xs X W yx yy ys yy Y W W xx xs xy W yx ys yy W S A A b b S S A A b b S S S H H H S H H H S ⎡ ⎤ ⎢ ⎥ ⎡ ⎤ ⎡ ⎤ ⎡ ⎤ =⎢ ⎥ ⎢ ⎥⎢ ⎥ ⎢ ⎥ ⎣ ⎦ ⎣ ⎦ ⎣ ⎦ ⎢ ⎥ ⎢ ⎥ ⎣ ⎦ ⎡ ⎤ ⎢ ⎥ ⎡ ⎤ =⎢ ⎥⎢ ⎥ ⎣ ⎦ ⎢ ⎥ ⎢ ⎥ ⎣ ⎦ (5) where 1 2 2 1 1 2 2 1 1 1 ( ) ( ) ( ) 1 ( ) e e e e f f p i k p i k f f xx xy xx xy k k f f p i k p i k yx yy f f yx yy k k a k e a k e A A A A a k e a k e π π π π − − − = = − − = = ⎡ ⎤ − ⎢ ⎥ ⎡ ⎤ ⎢ ⎥ = ⎢ ⎥ ⎢ ⎥ ⎣ ⎦ ⎢ − ⎥ ⎢ ⎥ ⎣ ⎦
∑
∑
∑
∑
. (6) ijH , i j, ∈
{
x s y, ,}
are the transfer functions of the system. The DCOH estimate of thelinear feedback from W to X is y
2 , , ( ) ( ) ( ) xy XY xj j x s y H f DCOH f H f = =
∑
(7) The property 2 2 2 1 XX XY XSDCOH + DCOH + DCOH = (8)
shows that the power spectral density of X is composed of contributions from W , y W and s
x W .
Recalling that E WW⎡⎣ i j⎤ =⎦ 1{ }i j= , the residual power matrix P may be written 0
2 2 0 2 2 . . xx xy xx xs xs ys yx yy xs ys yy ys b b b b P b b b b ε ε ε ε ⎡ + ⎤ ⎡ ⎤ =⎢ ⎥= ⎢ ⎥ + ⎣ ⎦ ⎣ ⎦ (9)
where εij is the covariance between the residual of components i and j. To solve this underdetermined system (εxy =εyx) and estimate the weight factors, Wang and Yunokuchi (Wang et al., 2002) have proposed to add the condition
yy xx xs ys b b b = b . (10) We then obtain 1 xy xx xx xx yy b ε ε ε ε ⎛ ⎞ ⎜ ⎟ = ⋅ − ⎜ ⋅ ⎟ ⎝ ⎠ (11) 1 xy yy yy xx yy b ε ε ε ε ⎛ ⎞ ⎜ ⎟ = ⋅ − ⎜ ⋅ ⎟ ⎝ ⎠ (12) xy xs xx xx yy b ε ε ε ε = ⋅ ⋅ (13) xy ys yy xx yy b ε ε ε ε = ⋅ ⋅ . (14) xs
b and b are chosen with the same arbitrary sign if ys εxy > , of from opposite arbitrary 0
signs otherwise. This condition may be a drawback for biomedical signals but it is generally well accepted. Computation details of the ARX model are given in (Wang et al., 2002). The order for the ARX model is often determined by a criterion like Akaike (Takigawa et al., 1996). In this study, the model order is chosen so that the ARX power spectra of X and Y reflect most accurately the peak at the modulation frequency in X and Y power spectral densities estimated by FFT (Fig. 2). An order of 70 was finally chosen.
The study is carried out on the AEPs associated with each lead. The information flow )
( m
XY f
C from one lead Y to another lead X at the MF f is estimated by the quantity m
) ( ) ( m XY m XY f DCOH f C = (15)
that ranges between 0 and 1 and is called the DCOH value in the following to simplify notations. The previous process is summarized Fig. 3.
(insert Fig. 3 here)
Connectivity between two auditory areas
In order to emphasize the reproducibility of results across subjects, the significant causality between two areas A and B is estimated as follows: for each subject, all the possible DCOH values between each lead of area A and each lead of area B are computed (in both directions). The set of DCOH values from A to B are then merged over all subjects implanted in A and B. We obtain a sample paired with the set of DCOH values from the reciprocal direction B to A. The sample of values from A to B is then compared to the sample of values from B to A by a unilateral Wilcoxon test at risk 10% in both directions (are causalities from A to B greater than those from B to A and reciprocally?). If the Wilcoxon test shows that a causality relation (say from A to B) is significantly higher than the reciprocal relation (from B to A), the sample mean of DCOH values from A to B is considered as a strength measure for the causality. This is called the causality coefficient. Our methodology results in keeping significantly preferred directions rather than a high value of DCOH for which we do not really know a significance threshold.
Results
Compared responses between areas
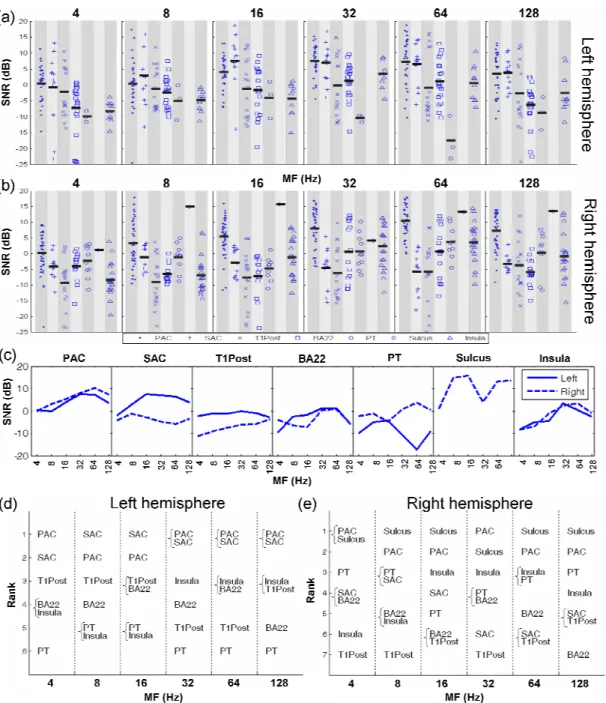
Background activity levels (γˆN(f0), see methods) in each area were fairly similar, except in left SAC, and T1Post in both hemispheres for MFs 4 and 8 Hz, where a slightly higher value was observed. Even if there is a high variability of SNR in each area, the comparison of values between areas reveals some interesting trends in the hierarchy of responses of the auditory areas for each MF (Fig. 4).
(insert Fig. 4 here)
In the right hemisphere, PAC (4, 32, 64 Hz, all p-values of the Mann-Whitney U test (Mann et al., 1947) between PAC and other areas are <0.05, except for PT 4 Hz, p=0.09)
and Sulcus (4, 8, 16, 64 and 128 Hz) show the highest SNR. In particular, the Sulcus showed very remarkable values, close to the maximum values over all areas at MFs equal to 8, 16 and 128 Hz. This would suggest an important role for this region, which is a transition area between the PAC and the PT, for these MFs. In contrast, SAC does not show significantly lower measures than PAC in the left hemisphere (p>0.33 for all MFs, Mann-Whitney test), i.e. SAC often responds as strong as or even stronger than PAC. Furthermore, SAC and T1Post areas clearly show stronger activities in the left hemisphere than in the right (Fig. 4abc) for MFs up to 32 Hz (SAC: p<0.05 for MFs 4 to 32 Hz except p=0.13 for MF=8Hz, T1Post: p<0.05 for MFs 4 to 32 Hz). A small part of the hemispheric difference for the SAC and T1Post is also explained by the lower background activity recorded in the left hemisphere compared to the right one for low MFs. On the other hand, the background activity spectrum is somewhat similar for all areas except left SAC and T1Post in both hemispheres, where activity for frequencies below 16 Hz is generally stronger and shows more variability than in other areas. This may also indicate that some kind of parallel processing occurs in these areas. To summarize, the predominance of the primary area in response to AM was confirmed in the right hemisphere whereas SAC and T1Post may play a role as important as PAC in the left hemisphere for low MFs from 4 to 16 Hz. We also notice high SNRs recorded in left BA22 at 8 and 16 Hz compared to the right BA22 (p-value < 0.03).
In general, the Insula shows higher SNRs for high MFs in both hemispheres (p<0.05 for MFs ≥32 Hz against MFs ≤16 Hz for both hemispheres, except MF 128 Hz against MF 16 Hz (both hemispheres) and MF 128 Hz against MF 8 Hz (left hemisphere)), likely playing a more important role in temporal envelope processing when the MF increases.
Connectivity between auditory areas
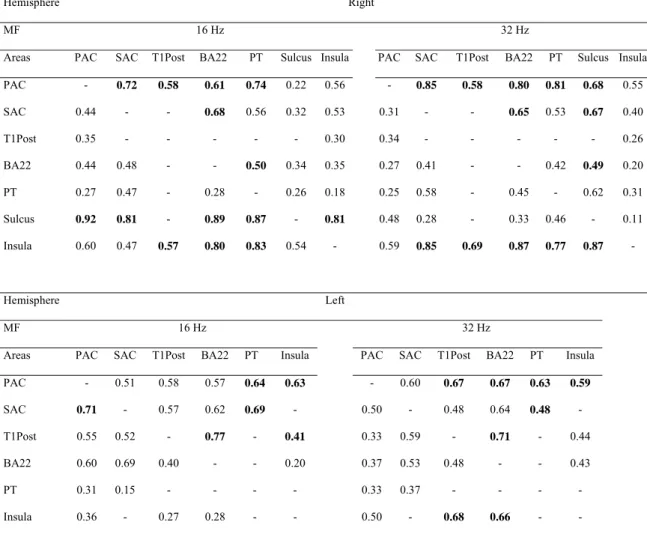
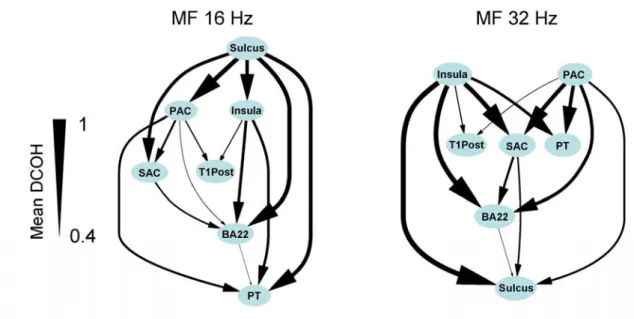
Detailed results are only illustrated for MFs 16 and 32 Hz. Results for other MFs are included in the global schemes of temporal envelope processing in the final paragraph of the results section. For all pairs of areas available, table 1 gives the average of DCOH values for MFs 16 Hz and 32 Hz in both hemispheres, i.e. the causality coefficients. Significant relations (see methods section) are emphasized in bold.
(insert Table 1 here)
For each MF and hemisphere, a graph of propagation for the response is extracted from the bold values (example for the left hemisphere in Fig. 5).
(insert Fig. 5 here)
The distribution of DCOH values and causality coefficients for all areas, hemispheres and MFs is shown Fig. 6. Above 0.55, causality coefficients are mainly significant and they are always significant above 0.7 (Fig. 6b).
(insert Fig. 6 here)
The mean of the causality coefficients involving leads in the left hemisphere (0.477) is not significantly different (bilateral Mann-Whitney test, p=0.63) from the mean in the right hemisphere (0.497). However, the proportion of significant causality coefficients among all causality coefficients is higher in the right hemisphere (38.2%) than in the left (31.8%) and the mean of the significant causality coefficients is also significantly higher (unilateral Mann-Whitney test, p<10-3) in the right hemisphere (0.694) than in the left (0.61). This
strongly suggests a higher variability of the direction of propagation flows and more bidirectional flows among subjects with recording electrodes implanted in the left hemisphere.
Similar processing between MFs
We are now looking for sets of MFs that generate similar responses or connectivity graphs in auditory areas. In regards to the responses to AM, we compute the average L2
distance between sets of SNR values obtained at each MF of each hemisphere (Fig. 4ab) (see materials and methods section). Regarding the connectivity during AM, we evaluate the “distance” between two graphs of propagation (like the one represented in Fig. 5) as follows: in the tables of causality relations such as those related in table 1, we sum the absolute values of cell differences between two tables normalized by the number of pairs of areas concerned with a causality relation. This results in a semi-metric distance between two graphs, bounded by [0,1] and that can be seen as a variation rate between two graphs.
For responses to AM and connectivity during AM stimulation, a hierarchical clustering (Aldenderfer et al., 1984; Everitt, 1978; Johnson et al., 1998) is subsequently applied on these distances showing the putative similarities in the envelope processing between each MF and hemisphere (Fig.7).
(insert Fig. 7 here)
In both hemispheres, stimuli with MFs 32 and 64 Hz generate similar SNRs in all areas, as well as similar connectivity graphs. The same phenomenon occurs for MFs of 8 and 16 Hz except for their connectivity graphs in the left hemisphere. These results, for both SNRs and connectivity graphs, strongly suggest that temporal envelope processing is somewhat similar for MFs 32 and 64 Hz, as well as for 8 and 16 Hz. Interestingly, there is a clear discrepancy of SNRs and connectivity graphs between left and right hemispheres. Indeed, only configurations involving the same hemisphere can initially be lumped together. Results related to MF 128 Hz are unclear but SNR levels or connectivity graphs at this MF are clearly different from those at MFs 32 or 64 Hz. The MF 4 Hz seems to induce a
distinct kind of temporal processing since SNRs or connectivity graphs at the MF 4 Hz in both hemispheres are very different from those at any other MF.
Schemes of temporal envelope processing in the human auditory cortex
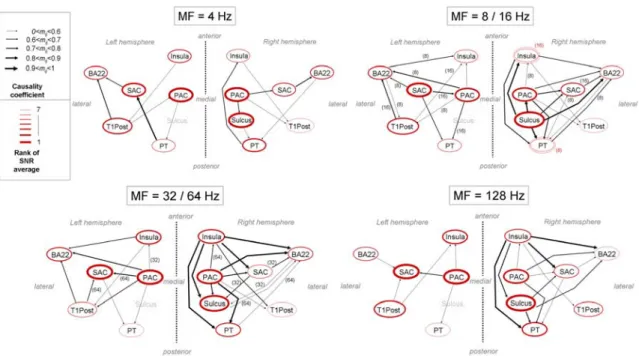
Given the results concerning connectivity and response levels, we are now able to propose schemes of temporal processing for MFs from 4 Hz to 128 Hz (Fig. 8). Considering the similarities between SNRs and connectivity graphs previously emphasized, the results for MFs 8 and 16 Hz have been gathered for both hemispheres, as well as those for 32 and 64 Hz.
(insert Fig. 8 here)
At MF 4 Hz, in the right hemisphere, the PAC and Sulcus show the best responses, and activity seems to propagate from these areas towards the secondary areas (PT and SAC) and then towards BA22, and generally from the antero-medial part of the auditory cortex to its posterior and lateral parts. The left hemisphere shows no such clear pattern. In both hemispheres, the Insula and BA22 show little response.
At MFs 8 and 16 Hz, schemes are very different from those at MF 4 Hz and there are some clear hemispheric differences for the response of the SAC. In the right hemisphere, Sulcus shows the strongest response, and activity appears to propagate from Sulcus to PAC, then to secondary areas and finally to BA22 and T1post areas. In contrast, in the left hemisphere, the SAC shows the best response. The origin of the response might be the SAC area in this hemisphere, which is quite unexpected. PAC and T1Post, then BA22 and PT, and finally Insula are subsequently activated.
At MFs 32 and 64 Hz, the role of the insula increases. PAC shows the best response in both hemispheres, along with SAC in the left hemisphere and Sulcus in the right. A strong hemispheric difference remains for SAC that has little response in the right hemisphere relative to other areas. T1Post may be less active than for lower MFs. In the right
hemisphere, the activity originates from PAC and Insula and then propagates to Sulcus, SAC, PT and T1Post, and finally to the BA22 area. In the left hemisphere, BA22 and PT seem to be the final destinations of the activity.
Finally, at a MF of 128 Hz, the schemes in both hemispheres are somewhat similar with those found at 8 and 16 Hz, except that activity does not seem to originate from the SAC but from the PAC in the left hemisphere.
Connectivity within the right PAC
For subject M, the exceptional mapping of the right PAC allows us to distinguish the anterior and posterior parts of PAC and PT. Following the same methodology as previously used, except that amplitude values are shown instead of ranks, the introduction of these sub-areas in the data exclusively from subject M gives some finer propagation maps (Fig. 9). These maps complete those found in (Guéguin et al., 2006), adding information about the amplitude of the response. The amplitude of the response is estimated with γˆ(f0) (see methods section). In this section, only data with significant causality coefficients higher than 0.6 were used.
(insert Fig. 9 here)
The overall results in this subject are consistent with the results obtained for the entire database and those described in (Guéguin et al., 2006). The propagation scheme is not clear at MF 4 Hz but the antero-lateral part of PAC is the most active part of PAC and activity propagates to the posterior part of PAC and Sulcus. There is also a clear propagation from SAC to BA22.
At MFs 8 Hz and 16 Hz, Sulcus shows the strongest response with antero-medial part of PAC. Activity seems to originate from Sulcus and propagates to PAC, then PT and finally to SAC and BA22. At MFs 32 Hz and 64 Hz, the antero-lateral part of PAC shows the strongest response but activity seems to originate from the posterior section of the PAC. It
then propagates to SAC, Sulcus and PT and then to BA22. At MF 128 Hz, the response is very poor but the propagation scheme seems similar to the one obtained for MF 64 Hz. The strength of causality links is generally lower though.
Interestingly, the receiving lead often shows weaker response to AM than the sending lead. Actually, a high response level for an area is somewhat correlated, though not perfectly, to the fact that the area is a source of activity (PAC, Sulcus 8 and 16 Hz). For instance, we found some fairly strong flows from the insular cortex (8 Hz) or the postero-medial part of the PAC (32 Hz) to the antero-lateral part of the PAC, whereas this latter shows stronger response to AM in both cases (Fig. 9). These examples remain rare though, since flows were more often found (84%) to be from leads of stronger response to AM to leads of weaker response than in the opposite direction, among all MFs and subjects.
Discussion
An exceptional sample of depth recordings in the human auditory cortex allowed us to observe the cortical processing of temporal envelope through sound stimulation with AM noise. Despite the inherent limitations of such protocols (limited number of MFs, short recording sessions), we used SNR and DCOH measures to propose a general scheme of responses and activation streams associated with amplitude modulation processing, unifying and adding new results to the study of strength of the response to AM in (Liégeois-Chauvel et al., 2004) and the causality between areas on four subjects in (Guéguin et al., 2006): at first, our methodology emphasizes that at least four different types of processing occur (<8 Hz, 8/16 Hz, 32/64 Hz, and > 64 Hz). Even simple stimuli such as AM noises involve core, belt and parabelt auditory areas. In agreement with (Guéguin et al., 2006), a hierarchical stream from PAC to SAC to BA22 is visible for all
MFs and hemispheres. In contrast, PT, T1Post and Insula appear to be involved in parallel processing. The right hemisphere is clearly involved in temporal processing as well as the left hemisphere, even if SNR is generally higher in SAC and T1Post areas (all MFs) and BA22 (MFs 8 and 16 Hz) in the left hemisphere than in the right. Activities in other areas seem comparable in both hemispheres. Among the new results, we noticed that in general, schemes of propagation are correlated with the strength of the response to AM, i.e. the stream moves from one area to a second area showing lower response. The schemes are often clearer in the right hemisphere than in the left.
Methodological issues
Most problems about the methodology and the interpretation of results in a study like ours essentially stem from three main reasons: 1) physiologically, the complexity of the human brain is only sparsely represented by the small number of recording sites in depth EEG; 2) the interpretation of DCOH remains controversial. Moreover, several other causality measures have been proposed recently; 3) we work with human subjects, whose implantations were only based on neurological evaluation preliminary to surgery and independent of the present study (Liégeois-Chauvel et al., 2004). Thus, the set of implantations is extremely different between subjects and raise some statistical issues.
Physiological biases
The temporal features of a recording site may be biased by other local properties since each field is not a functionally uniform area. The best known topographic organization is a clear progression of frequency sensitivity (from low to high) along the anterolateral to posteromedial axis of the HG, i.e. within the PAC (Galaburda et al., 1980; Rademacher et al., 1993). Insula and SAC also exhibit such topography, but not necessarily along the same axis (Talavage et al., 2004). Nevertheless, spectral and temporal tuning are generally considered largely independent. (Langner et al., 1997) in humans (MEG), (Hose et al.,
1987) in the mynah bird (multiunits), and (Schulze et al., 2002) in Mongolian gerbil (optical imaging) found a possible organization of BMFs orthogonal to the frequency tonotopic organization. Studies in rat cortex using multiunit recordings (Kilgard et al., 1999) or in humans using fMRI (Giraud et al., 2000) did not find such organization. In any case, no relation between frequency and temporal tuning was emphasized in these studies.
In this paper, we associate a recording site to an auditory area but we are aware that each site only represents one possible temporal feature found in the area. Each area may exhibit TMTFs that were not actually recorded. This is an inherent limitation of the EEG/SEEG recordings. However, unlike case studies, our study takes advantage of a large database (20 patients) featuring at least 10 recording sites in each auditory area (except left PT and sulcus). Given the spatially random sampling, we hope that the set of TMTFs observed in a given area is representative of most temporal features of this area. Unfortunately, no data was available in the left Sulcus, but results in the right one seemed intriguing enough to us to study it as a separate area on its own. Further investigation in the left Sulcus is clearly required.
Another physiological bias relates to the variability of the grey matter volume between subjects. Except PT, which is usually larger in the left hemisphere than in the right (Galaburda et al., 1978), no significant asymmetry of the other auditory areas has been reported to our knowledge. However, it is possible to find a particular asymmetry on one or several subjects since there is a natural variability of the size of the areas, especially the primary auditory cortex (Leonard et al., 1998; Penhune et al., 1996; Rademacher et al., 1993; Rademacher et al., 2001). Interhemispheric differences in volume may induce some differences in activation and therefore may provide misleading results for amplitude and connectivity. Again, if it is impossible to prevent the variability of auditory areas between
subjects; at least our methodology is designed to emphasize reproducible schemes of propagation among patients (see methods “Connectivity between two auditory areas”).
Choice and interpretation of the DCOH
The most widely used methods for modeling an information flow between two or more signals are based on multivariate autoregressive (ARX) models inspired by the Granger causality, i.e. using a model of prediction of X(t) from a linear combination of all available
past information for X(t) and Y(t) (Ashley et al., 1980; Granger, 1969; Sims, 1972). Several
spectral causality indicators were derived from this theoretical framework, producing an evaluation of a correlation between the observed SEEG of a lead and the past SEEG of another lead, for every periodic component of the SEEG. The main methods introduced are the Geweke measures, (Geweke, 1982; Geweke, 1984), the Directed Coherence (Saito et al., 1981), the Directed Transfer Function (Kaminski et al., 1991; Korzeniewska et al., 2003) and the Partial Direct Coherence (Sameshima, 1999)).
Among all these previous methods, the PDC seems to be the best theoretical framework for causality estimation between a multivariate set of signals, especially when looking for direct connectivity relations between auditory areas. However, firstly, too many parameters are simultaneously required in this multidimensional model (as in the DTF method) when we use 24 channels for patient M for example. Secondly, unlike PDC, the approach of the DCOH takes into account an additional common source of noise observed in both signals X and Y . The model cleverly considers the common part of X and Y as all other detected activities, which decorrelates the processes seen as the sources of X and Y. Indeed, due to the obvious subsampled nature of the mapping of these recordings, it is impossible to consider an exhaustive model of all neuron groups having possible interactions with X and
Y. When there is a common source between two signals, and this hypothesis seems
reasonable to us in our study due to volume conduction and proximity of recording sites,
simulations showed that PDC takes that source into account leading to biased estimates of i) the frequency and ii) the strength of the causality link (see Model 2 in (Gourévitch et al., 2006). This latter paper also contains a review of methods for detecting causality between signals).
The linearity of the model may also be questioned. The ARX models are primarily mathematical models more so than physiological models. Nevertheless, linearity may be envisaged when signals are recorded in nearby cortical sites between which transfer functions are assumed to be quite simple. The transfer functions between two areas may indeed depend on the anatomical distance between these areas, which may have a dramatic influence on the significance of DCOH values.
Statistical issues
The purpose of the implantations was definitely the detection of epilepsy sources in the patient, and the mapping of the auditory cortex for each patient is thus sparse and clinical case-dependent. Since only a few auditory areas were implanted in each subject, it seemed impossible to extrapolate global results involving all auditory areas from one or several individual studies. Concerning TMTFs, the use of SNR – a dimensionless quantity – allowed us to aggregate results over several patients whereas the oscillation amplitude used in the previous study (Liégeois-Chauvel et al., 2004) did not. Concerning connectivity between auditory areas, we paid particular attention to define a methodology that allowed us to gather results for all subjects: our choice was to emphasize the significant preferred schemes of propagation between two areas by comparing the measures in one direction (obtained over all available subjects) to the measures in the opposite direction. One has to notice that finding a high causality coefficient in the two directions remains quite rare, and appears even impossible for values >0.7. This methodology is also independent from the measure used insofar as DCOH could be replaced by any other causality measure. But,
above all, this methodology avoids the choice of a significance threshold for DCOH values, which remains an open debate. Schnider et al. suggested in 1989 to consider
0.1
XY
DCOH > as a significant link between two channels (Spectral Causality Criterion,
(Schnider et al., 1989)). Probably because the cortical responses of our study exhibit oscillations, most DCOH values were much higher than 0.1 (Fig. 6a).
Response to AM compared between auditory areas
The SNR is not sufficient to clearly emphasize tuning properties of neuronal groups, due to the low-pass shape of the spectrum of the background cortical activity. However, at a given MF, it is well suited to compare values between areas and patients, and thus sketch out the hierarchy between all auditory areas of both hemispheres, even if few areas were implanted in each patient. This analysis was not performed in our previous study (Liégeois-Chauvel et al., 2004).
The new main results concern the higher SNRs found for SAC and T1Post in the left hemisphere for MFs between 4 and 16 Hz (Fig. 4abc). Only the hemispheric difference of BMFs was found in (Liégeois-Chauvel et al., 2004). The SAC is known to be activated by amplitude modulation (Giraud et al., 2000) and speech syllables (Zatorre et al., 1992). Its anterior section responds to pitch (MEG studies in (Gutschalk et al., 2004; Krumbholz et al., 2003)). The left SAC is sensitive to delay-and-add noise (Griffiths et al., 1998a). Consistent with this last study, Liégeois-Chauvel (Liégeois-Chauvel et al., 2004) found the SAC to be more selective in the left hemisphere, as BMFs are higher than in the right hemisphere. This last result also has to be put side by side with the study of (Giraud et al., 2000) showing that SAC produced a larger response to high MFs (64, 128, 256 Hz) than to low MFs (4, 8, 16 Hz) in the left hemisphere. Thus, the hemispheric differences found in our study (Fig. 4c) and those previously cited suggest an important role for the left SAC in temporal envelope processing.
High variance of SNR in the T1Post in both hemispheres suggests that only part of the area responds to temporal envelope modulation. In fact, the T1Post has numerous specializations such as perceptual speech analysis (Binder et al., 1997; Steinschneider et al., 1999; Zatorre et al., 1996a), melody (Griffiths et al., 1998a) or musical imagery (Zatorre et al., 1996b). The highest SNRs found in the left hemisphere may corroborate the results of Fiez et al. who found that left T1Post was more highly activated by speech processing (words presentation or verb generation, (Fiez et al., 1996)). The results concerning SNR in the left hemisphere might also be in agreement with the study of Howard et al. showing that T1Post is activated by slower temporal stimuli than the PAC (Howard et al., 2000). To a certain extent, the BA22 also shows higher SNRs for MFs 8 and 16 Hz in the left hemisphere (Fig. 4ab). These frequencies are slightly above the syllabic rate (~3-4 Hz, (Houtgast et al., 1985; Steeneken et al., 1980)) and thus suggest some additional properties of the BA22 area that may not be restricted to the role of Wernicke’s area (posterior left BA22) in language processing and word detection (Karbe et al., 1995). In general, the previous results about SAC, T1Post and BA22 support the hypothesis that the left hemisphere is more specialized in temporal variation analysis, even those which are not related to speech (Jamison et al., 2006). In contrast, we did not observe any significant asymmetry for temporal processing in PAC as was observed for tones in (Devlin et al., 2003). We also have to point out that secondary and associative auditory areas generate sustained activities (oscillations), contrary to recent results showing that transient responses to continuous environmental sounds or noise bursts might be more predominant in “belt” areas (Harms et al., 2002; Harms et al., 2005; Seifritz et al., 2002).
Another new result is the higher SNR observed in Insula in both hemispheres when MF increases (Fig. 4ab). Several BMFs at 16 or 32 Hz found in the insular cortex (unpublished observations) might suggest a better temporal resolution than previously thought. This
result is in agreement with the responses to high MFs found in the insula of the squirrel monkey (Bieser et al., 1996). Even if this area seems of particular interest, the functional knowledge about the insula is very limited. Some vestibular functions have been identified (Bottini et al., 1994) but the insula is also involved in speech, since electrical stimulation can provoke hypoacousis or cessation of speech (Ostrowsky et al., 2000). An effect of volume conduction of electrical signals from PAC is not likely to explain findings in the insula. Indeed, we found only a small causality values between PAC and insula as well as less significant links for all MFs between these two areas than between PAC and SAC for instance (table 1 and Fig. 8). The highest temporal resolution found in PAC and insula is also clearly not related to the spectral profile of the background activity since we found it to be somewhat similar between auditory areas above 16 Hz.
Schemes of temporal envelope processing as a function of the MF
Preliminary to the discussion, one must notice here that flows found in the study cannot be clearly considered as direct or indirect links. However, it is likely that auditory processing is organized relative to the localization of the areas in the auditory cortex. For instance, a flow between SAC and BA22 is likely not the result of a link SAC – PAC – BA22.
We take advantage of our larger database compared to (Guéguin et al., 2006) to study the correlation between the direction of a flow between two areas and the amplitude gradient between them. Interestingly, the schemes in Fig. 8, but above all those of subject M (Fig. 9) showed that flows were more often found to be flowing from leads with a stronger response to AM to leads with a weaker response than in the opposite direction. An influence of volume conduction may partly explain this result but it may also reflect the existence of streams from large unspecialized groups of neurons towards smaller specialized groups generating lower AEP amplitudes.
Based on a larger database, the current study clearly confirms the flows found in a previous case study (Guéguin et al., 2006). In both hemispheres, adding the strength of the temporal response to AM: in general the PAC shows the best response to AM noises, and provides inputs for SAC, T1Post, PT, Insula and then BA22. The direct or indirect connections found using electrical stimulation between PAC and T1Post, and between PAC and BA22 (Brugge et al., 2003; Howard et al., 2000) are thus corroborated. There is evidence for an important role of the Heschl sulcus (area Sulcus) at MFs of 8 and 16 Hz, where a strong response to AM was recorded and input at these MFs was found to stem from this area before propagating to surrounding areas. This transition area may still be primary-like and receive subcortical inputs but some additional data on other subjects is required. The role of left SAC at MFs of 8 and 16 Hz is important, despite the fact that activity propagating from SAC to PAC for these MFs in the left hemisphere remains counterintuitive. One possible explanation stems from the anatomical localization of the leads and the controversy about the delimitation between PAC and SAC: in our study, the lateral part of Heschl’s Gyrus was considered as SAC, including the area Te1.2 described in (Morosan et al., 2001) as a transition area between PAC and SAC. Te1.2 likely overlaps with the anterior lateral area (ALA) considered by Wallace et al. (Wallace et al., 2002) as non-primary. In any case, some activity might be originating in a very lateral portion of Heschl’s Gyrus for MFs 8 and 16 Hz and might then propagate through a lateral-medial axis.
Over all MFs, few inputs were found between SAC and T1Post, whereas a flow from SAC to BA22 and from the PAC to PT were often found in both hemispheres. Albeit not the strongest, we observed clear responses of secondary and associative areas to AM, consistent with (Giraud et al., 2000; Liégeois-Chauvel et al., 2004).
Hierarchical and parallel organizations
Anatomical studies of the auditory cortex in humans and other primates provided evidence of a hierarchical organization of auditory processing, in which core areas (primary auditory cortex in humans) receive direct input from the thalamus and then provide input to one or several surrounding belts (secondary and associated auditory areas) (Hackett et al., 1998; Kaas et al., 2000; Lee et al., 2005; Pandya, 1995; Tardif et al., 2001). Several studies showed evidence that primary auditory areas are mainly responding to simple tones as well as a large range of AM, providing an “image” representation of sounds, while secondary and associative auditory areas and even prefrontal areas provide integration of the spectro-temporal representation stemming from the primary cortex to analyze more complex sounds (see a general review in (Ehret, 1997)). Moreover, these latter areas are implicitly considered to be involved in sound analysis following the processing in the primary auditory cortex, leading to a hierarchical processing in the auditory cortex (Hall et al., 2002; Hutsler et al., 1996; Mesulam et al., 1994; Wessinger et al., 2001).
However, this hierarchical processing cannot be proven by functional imagery from a causal point of view while the temporal resolution of such techniques remains low (about 1 s).
The hierarchy found here with EEG signals is clearly not a straightforward chain of analysis. The scheme “PAC-SAC-BA22” seems to replicate over all MFs and hemispheres. However, the PT, T1Post and Insula are involved in somewhat independent stages of sound processing, not being part of a clear chain of successive activations with other areas. A kind of parallel processing appears here, reinforcing the conclusions of (Guéguin et al., 2006; Inui et al., 2006). In this latter MEG study using click stimulation, the authors found flows running postero-superiorly (from PAC to SAC then PT and T1Post) and anteriorly (PAC-SAC-BA22).
These results have important implications in language processing, showing for instance that there may be a strong implication that secondary and associative areas are involved in speech analysis even in the right hemisphere. Our results also show that the good temporal resolution of PAC and Insula above 16 Hz is not maintained in secondary and associative areas, and likely prevents these latter areas from having an important role in the decomposition of all sound features, e.g., fast changes. Consistently, Fishman et al. found that recordings in PT did not show significant phase-locked activity in response to dissonant chords contrary to those in Heschl’s gyrus (Fishman et al., 2001). Thus, if belt and parabelt areas receive most of their inputs from primary cortex, their abilities regarding the integration, analysis and categorization (Lewis et al., 2005) of a wide range of complex sounds, including fast temporal changes, may depend on a coding of primary cortex for fast temporal changes. Consequently, secondary and associative areas may play an important role in the integration of language over the syllabic rate, which is about 3-4 Hz.
Possible codes for temporal processing
A new result stemming from the larger database compared to (Guéguin et al., 2006) relates to the similarities between propagation graphs and response levels between MFs (Fig. 7): we are able to clearly distinguish at least four types of envelope processing, as a function of the MFs: below 8 Hz, between 8 and 16 Hz, between 32 and 64 Hz, above 64 Hz.
The response of the auditory cortex to the MF of 4 Hz is very different from that to any other MF in both hemispheres. One explanation is that the background activity around 4 Hz is very strong and provokes high variability in the measures. However, we might also argue that temporal variations are so slow that they do require a very different code, or no code at all, associated to perception of tempos, rhythms or syllabic rate. For instance, long memory integration and long time constants are required if all oscillations at MF 4 Hz are to be
processed globally through a rate analysis and not as distinct and separated sounds. Yet, we strongly think that sounds that are amplitude modulated at 4 Hz are not seen as temporally distinct sounds since the onset component superimposed in the first oscillation is never strong in the second oscillation and is undetectable in the third and fourth oscillations.
In contrast, global SNRs at MFs of 8 and 16 Hz are quite similar in each hemisphere (Fig. 4ab). This is also the case for MFs of 32 and 64 Hz. These two groups of MFs may generate some different psychological perceptions that could explain the difference in brain processing between them. MFs of 32 and 64 Hz may also correspond to a limit emphasized in several animal studies between a phase-locking code for low MFs and a firing-rate code for MFs above 30-50 Hz (Bieser et al., 1996; Eggermont, 1991; Eggermont, 1994; Gaese et al., 1995; Gleich et al., 1995; Heil et al., 1995; Liang et al., 2002; Lu et al., 2004; Lu et al., 2001a; Lu et al., 2001b; Moller et al., 1986; Rees et al., 1987; Rhode, 1994; Rhode et al., 1994; Schreiner et al., 1986; Schreiner et al., 1988; Wang et al., 2003). The processing at MF 128Hz seemed unclear but was definitely different from the processing at MFs 32 and 64 Hz. Even if our sampling of MFs is very limited and so does not allow the drawing of solid conclusions, it suggests the existence of more different temporal codes than previously thought. TMTFs obtained from EEG were mostly similar to those obtained from neural spikes in anesthetized cats (Eggermont et al., 1995). Thus there is clearly a need for further studies in awake animals investigating the relationship between the spatial processing extracted from EEG and the different neural codes (synchronization rate, firing rate) putatively used by neurons to process the temporal envelope.
One must also notice that generally, the propagation scheme is very clear in the right hemisphere for most MFs: a high activity from the PAC, propagated to second auditory areas then to associate areas. In contrast, the propagation scheme is less organized in the left hemisphere (Fig. 8), showing less reproducible patterns between MFs and less
conformation with the schemes expected from anatomical knowledge in primates (core areas towards belt then parabelt areas (Hackett et al., 1998; Kaas et al., 2000)). This new result is apparently not in agreement with the generally well-accepted scheme in favor of a more complex temporal processing in the left hemisphere. However, we see a possible explanation to this controversial finding: feedback and bidirectional propagation would be more developed in the left hemisphere, leading to less clear propagation patterns. The higher proportion of significant causality coefficients and their higher average in the right hemisphere bolsters this hypothesis (see Connectivity between auditory areas section). This hypothesis would also be consistent with the larger volume of white-matter found in the left hemisphere in the Heschl Gyrus and the Posterior temporal lobe, associated with a more complex network of connections (Zatorre et al., 2002).
Acknowledgements
The authors wish to thank Pr Jean Régis for the anatomical localization of each lead, and M. Guéguin for previous work on directed coherence.
References
Aldenderfer, M.S., Blashfield, R.K. 1984. Cluster Analysis Sage Publications, Newbury Park, Cal.
Ashley, R., Granger, C.W.J., Schmalensee, R. 1980. Advertising and Aggregate Consumption: An Analysis of Causality. Econometrica 48, 1149-1168.
Bancaud, J., Talairach, J., Bonis, A., Schaub, C., Szikla, G., More, P., Bordas-Ferrer, M. 1965. La stéréoélectroencéphalographie dans l'épilepsie: informations
neurophysiopathologiques apportées par l'investigation fonctionnelle stéréotaxique Masson, Paris.
Bieser, A., Muller-Preuss, P. 1996. Auditory responsive cortex in the squirrel monkey: neural responses to amplitude-modulated sounds. Exp Brain Res 108, 273-84. Binder, J.R., Frost, J.A., Hammeke, T.A., Cox, R.W., Rao, S.M., Prieto, T. 1997. Human
brain language areas identified by functional magnetic resonance imaging. J Neurosci 17, 353-62.
Bottini, G., Sterzi, R., Paulesu, E., Vallar, G., Cappa, S.F., Erminio, F., Passingham, R.E., Frith, C.D., Frackowiak, R.S. 1994. Identification of the central vestibular
projections in man: a positron emission tomography activation study. Exp Brain Res 99, 164-9.
Braak, H. 1978. Architectonics of the human telencephalic cortex Springer Verlag, New-York.
Brugge, J.F., Volkov, I.O., Garell, P.C., Reale, R.A., Howard, M.A., 3rd. 2003. Functional connections between auditory cortex on Heschl's gyrus and on the lateral superior temporal gyrus in humans. J Neurophysiol 90, 3750-63.
Burns, E.M., Viemeister, N.F. 1976. Nonspectral pitch. J Acoust Soc Am 60, 863-869. Devlin, J.T., Raley, J., Tunbridge, E., Lanary, K., Floyer-Lea, A., Narain, C., Cohen, I.,
Behrens, T., Jezzard, P., Matthews, P.M., Moore, D.R. 2003. Functional asymmetry for auditory processing in human primary auditory cortex. J Neurosci 23, 11516-22. Drake, C., Botte, M.C. 1993. Tempo sensitivity in auditory sequences: evidence for a
multiple-look model. Percept Psychophys 54, 277-86.
Eggermont, J.J. 1991. Rate and synchronization measures of periodicity coding in cat primary auditory cortex. Hear Res 56, 153-67.
Eggermont, J.J. 1994. Temporal modulation transfer functions for AM and FM stimuli in cat auditory cortex. Effects of carrier type, modulating waveform and intensity. Hear Res 74, 51-66.
Eggermont, J.J., Smith, G.M. 1995. Synchrony between single-unit activity and local field potentials in relation to periodicity coding in primary auditory cortex. J
Neurophysiol 73, 227-45.
Eggermont, J.J., Smith, G.M. 1996. Neural connectivity only accounts for a small part of neural correlation in auditory cortex. Exp Brain Res 110, 379-91.
Eggermont, J.J., Ponton, C.W. 2002. The neurophysiology of auditory perception: from single units to evoked potentials. Audiol Neurootol 7, 71-99.
Ehret, G. 1997. The auditory cortex. J Comp Physiol [A] 181, 547-57.
Everitt, B.S. 1978. Graphic Techniques for Multivariate Data Heinemann, London. Fiez, J.A., Raichle, M.E., Balota, D.A., Tallal, P., Petersen, S.E. 1996. PET activation of
posterior temporal regions during auditory word presentation and verb generation. Cereb Cortex 6, 1-10.
Fishman, Y.I., Volkov, I.O., Noh, M.D., Garell, P.C., Bakken, H., Arezzo, J.C., Howard, M.A., Steinschneider, M. 2001. Consonance and dissonance of musical chords: neural correlates in auditory cortex of monkeys and humans. J Neurophysiol 86, 2761-88.
Flanagan, J.L., Guttman, N. 1960. Pitch of Periodic Pulses without Fundamental Component. J Acoust Soc Am 32, 1319-1328.
Fraisse, P. 1967. Time duration differential threshold in a series of regular intervals. Annee Psychol 67, 43-9.
Friberg, A., Sundberg, J. 1995. Time discrimination in a monotonic, isochronous sequence. Journal of the Acoustical Society of America 98, 2524-2531.
Gaese, B.H., Ostwald, J. 1995. Temporal coding of amplitude and frequency modulation in the rat auditory cortex. Eur J Neurosci 7, 438-50.
Galaburda, A., Sanides, F.J. 1980. Cytoarchitectonic organization of the human auditory cortex. J. Comp. Neurol. 190, 597-610.
Galaburda, A.M., Sanides, F., Geschwind, N. 1978. Human brain. Cytoarchitectonic left-right asymmetries in the temporal speech region. Arch Neurol 35, 812-7.
Galuske, R.A., Schuhmann, A., Schlote, W., Bratzke, H., Singer, W. 1999. Interareal connections in the human auditory cortex. Neuroimage 9, S994.
Geweke, J. 1982. Measurement of linear dependence and feedback between multiple time series. J Am Stat Assoc 77, 304-313.
Geweke, J. 1984. Measures of conditional linear dependence and feedback between time series. J Am Stat Assoc 79, 907-915.
Giraud, A.L., Lorenzi, C., Ashburner, J., Wable, J., Johnsrude, I., Frackowiak, R., Kleinschmidt, A. 2000. Representation of the temporal envelope of sounds in the human brain. J Neurophysiol 84, 1588-98.
Gleich, O., Klump, G.M. 1995. Temporal modulation transfer functions in the European Starling (Sturnus vulgaris): II. Responses of auditory-nerve fibres. Hear Res 82, 81-92.
Godey, B., Schwartz, D., de Graaf, J.B., Chauvel, P., Liegeois-Chauvel, C. 2001. Neuromagnetic source localization of auditory evoked fields and intracerebral evoked potentials: a comparison of data in the same patients. Clin Neurophysiol 112, 1850-9.
Gourévitch, B., Le Bouquin Jeannès, R., Faucon, G. 2004. Statistical variability of auditory responses to amplitude modulation, European Signal Processing Conference
(EUSIPCO), Vienna. pp. 2191-2194.
Gourévitch, B., Bouquin-Jeannès, R.L., Faucon, G. 2006. Linear and nonlinear causality between signals: methods, examples and neurophysiological applications. Biol Cybern 95, 349-369.
Granger, C.W.J. 1969. Investigating causal relations by econometric models and cross-spectral methods. Econometrica 37, 424-438.
Griffiths, T.D., Buchel, C., Frackowiak, R.S., Patterson, R.D. 1998a. Analysis of temporal structure in sound by the human brain. Nat Neurosci 1, 422-7.
Guéguin, M., Le Bouquin-Jeannès, R., Faucon, G., Chauvel, P., Liégeois-Chauvel, C. 2006. Evidence of Functional Connectivity between Auditory Cortical Areas Revealed by Amplitude Modulation Sound Processing. Cereb Cortex.
Gutschalk, A., Patterson, R.D., Scherg, M., Uppenkamp, S., Rupp, A. 2004. Temporal dynamics of pitch in human auditory cortex. Neuroimage 22, 755-66.
Hackett, T.A., Stepniewska, I., Kaas, J.H. 1998. Subdivisions of auditory cortex and ipsilateral cortical connections of the parabelt auditory cortex in macaque monkeys. J Comp Neurol 394, 475-95.
Hall, D.A., Johnsrude, I.S., Haggard, M.P., Palmer, A.R., Akeroyd, M.A., Summerfield, A.Q. 2002. Spectral and temporal processing in human auditory cortex. Cereb Cortex 12, 140-9.
Hämäläinen, M., Hari, R., Ilmomieni, R.J., Kunuutila, J., Lounasmaa, O.V. 1993. Magnetoencephalography - Theory, instrumentation, and applications to
noninvasive studies of the working human brain. Rev. of Mod. Phys 65, 413-497. Harms, M.P., Melcher, J.R. 2002. Sound repetition rate in the human auditory pathway:
representations in the waveshape and amplitude of fMRI activation. J Neurophysiol 88, 1433-50.
Harms, M.P., Guinan, J.J., Jr., Sigalovsky, I.S., Melcher, J.R. 2005. Short-term sound temporal envelope characteristics determine multisecond time patterns of activity in human auditory cortex as shown by fMRI. J Neurophysiol 93, 210-22.
Heil, P., Schulze, H., Langner, G. 1995. Ontogenetic development of periodicity coding in the inferior colliculus of the Mongolian gerbil. Audit Neurosci 1, 363-383. Hose, B., Langner, G., Scheich, H. 1987. Topographic representation of periodicities in the
forebrain of the mynah bird: one map for pitch and rhythm? Brain Res 422, 367-73. Houtgast, T., Steeneken, H.J.M. 1985. A review of the MTF concept in room acoustics and its use for estimating speech intelligibility in auditoria. J Acoust Soc Am 77, 1069-1077.
Howard, M.A., Volkov, I.O., Mirsky, R., Garell, P.C., Noh, M.D., Granner, M., Damasio, H., Steinschneider, M., Reale, R.A., Hind, J.E., Brugge, J.F. 2000. Auditory cortex on the human posterior superior temporal gyrus. J Comp Neurol 416, 79-92.