HAL Id: hal-03053683
https://hal.uca.fr/hal-03053683
Preprint submitted on 11 Dec 2020
HAL is a multi-disciplinary open access
archive for the deposit and dissemination of sci-entific research documents, whether they are pub-lished or not. The documents may come from teaching and research institutions in France or abroad, or from public or private research centers.
L’archive ouverte pluridisciplinaire HAL, est destinée au dépôt et à la diffusion de documents scientifiques de niveau recherche, publiés ou non, émanant des établissements d’enseignement et de recherche français ou étrangers, des laboratoires publics ou privés.
for tax transition?
Kodjo Adandohoin, Jean-Francois Brun
To cite this version:
Kodjo Adandohoin, Jean-Francois Brun. Are incomes and property taxes effective instruments for tax transition?. 2020. �hal-03053683�
S U R L E D E V E L O P P E M E N T I N T E R N A T I O N A L
SÉRIE ÉTUDES ET DOCUMENTS
Are incomes and property taxes effective instruments for tax
transition?
Kodjo Adandohoin
Jean‐François Brun
Études et Documents n° 11
December 2020
To cite this document:
Adandohoin K., Brun J‐F. (2020) “Are incomes and property taxes effective instruments for tax
transition? ”, Études et Documents, n°11, CERDI.
CERDI POLE TERTIAIRE 26 AVENUE LÉON BLUM F‐ 63000 CLERMONT FERRAND TEL. + 33 4 73 17 74 00 FAX + 33 4 73 17 74 28 http://cerdi.uca.fr/
2
The authors
Kodjo Adandohoin
PhD student, Université Clermont Auvergne, CNRS, CERDI, F‐63000 Clermont‐Ferrand, France
Email address:
kodjo.adandohoin@etu.uca.fr
Jean‐François Brun
Associate Researcher, Université Clermont Auvergne, CNRS, CERDI, F‐63000 Clermont‐
Ferrand, France
Email address:
j‐françois.brun@uca.fr
Corresponding author: Kodjo Adandohoin
This work was supported by the LABEX IDGM+ (ANR‐10‐LABX‐14‐01) within the program “Investissements d’Avenir” operated by the French National Research Agency (ANR).
Études et Documents are available online at: https://cerdi.uca.fr/etudes‐et‐documents/
Director of Publication: Grégoire Rota‐Graziosi
Editor: Catherine Araujo‐Bonjean
Publisher: Aurélie Goumy
ISSN: 2114 ‐ 7957
Disclaimer:
Études et Documents is a working papers series. Working Papers are not refereed, they constitute
research in progress. Responsibility for the contents and opinions expressed in the working papers rests solely with the authors. Comments and suggestions are welcome and should be addressed to the authors.
3
Abstract
This paper investigates second wave tax transition (transfer of tax pressure from border
taxation towards domestic taxation) concerns in developing countries. It essentially focuses
on the compensation effects of incomes and property taxes over international trade tax
revenue losses in developing countries. Using a generalized method of moment estimator, we
come to the evidence that, incomes and property taxes are poor instruments to balance trade
tax revenue losses of trade liberalization in these countries. However, a mediating effect of
financial development in the compensation nexus driven by corporate income taxes was
found. We explain this result by the fact that the use of financial sector generates paper trails
to government in order to enforce and raise corporate income taxes. Financial development
may progressively crowd‐out informal sector and leads to business formalization. Surprising,
we do not find any mediating effect of financial development in the compensation patterns
with personal income taxes. Nevertheless, some heterogeneities were discovered. Financial
development mediates the compensation patterns of personal income taxes in Latin American
countries, while the effect holds on corporate income taxes in African countries. We conclude
the paper by highlighting the important role of financial development in second generation
tax transition concerns over developing countries.
Keywords
Income taxes, Property tax, Tax transition, Developing countries
JEL Codes
H 20
4
1. Introduction
Improving domestic resource mobilization is an essential concern of the policy framework that actually need developing countries in order to face important challenges of economic globalization. Several studies that assess the effect of trade liberalization on public finance come to the striking evidence of a revenue loss effects of trade liberalization especially trade tax revenue losses (Bevan, 1995; Khattry & Rao, 2002; Keen & Ligthart, 2002; Keen & Simone,
2004). The corollary of the trade liberalization policy framework implemented in developing countries in adherence to the World Bank and World Trade Organization policies guidelines is that, countries must promote trade, but alternatively find other tools of revenue mobilization to offset government revenue losses long dominated by international trade taxes.
In the first wave tax transition agenda, they must manage an efficient Value Added Tax (VAT) to offset trade tax revenue losses, while at the same time prepare the ground for a second generation tax transition concerns based on direct taxes (Chambas, 2005b).
Direct taxes revenue mobilization features come to prominence in the public debate especially with the increased awareness of their relatively low amounts in total revenue collection. Tax revenues from incomes have yielded very little revenue in developing countries. Personal income tax which averages 25% of total tax revenue (over 7% of GDP) for developed countries, represents only 9% of tax revenue(less than 2% of GDP) for the developing ones (R. M. Bird & Zolt, 2005). Not only is income from persons not sufficiently collected but much income from corporates also escapes taxation through greater tax avoidance practices (Crivelli et al.,
2016;Johannesen et al., 2016;Silberztein, 2009;Fuest et al., 2011; Jansky` & Prats, 2015;Fuest & Riedel, 2010). And, despite property taxation is less subject to tax base competition, their lack of interest lies in the greater government administrative costs that make property tax a losing proposition in terms of revenue yields per expenditure of administrative costs (Bahl & Martinez-Vazquez, 2007).
Still, many developing countries continue to rely on free trade areas to boost trade and grant important tariff reductions, while the lack of public revenue would certainly impede the provision of public goods. Thus, it seems important to investigate whether trade tax revenue losses are offset with domestic revenue mobilization with a focus on incomes and property taxes (direct taxes) in this paper. As important as the question seems, there is actually no empirical assessment of the extent to which countries have succeeded in offsetting reductions in trade tax revenues by increased revenues from direct taxes (second generation tax transition goals). Baunsgaard and Keen (2010) try to assess the effect, but on their part focus on total domestic revenue mobilization. The role that particular tools of domestic revenue played in the
5
transition process of developing countries, is an under-investigated area of the literature. What role have direct taxes played, or could they play in the transition process of developing countries is an unanswered empirical question.
The aim of this paper is to make such assessment and to provide additional reflexions on how to make direct taxes operational in second generation tax transition concerns in developing countries.
The paper will follow the ongoing structure: section 2 provides a deep understanding of the tax transition concept and the paper focuses later, on the compensation features of tax transition in our empirical framework. In section 3, the paper provides some stylized facts about tax transition concerns by incomes and property taxes in developing countries. Section 4 identifies important challenges faced by incomes and property taxes as revenue raising instruments in developing countries. Section 5 tends to shed light on the role of financial development and digital improvements as mediating tools in order to raise more direct tax revenues. An empirical framework (section 6) lays basis for identification of the compensation effects of incomes and property taxes, followed in section 7 by results and sensitivity analyses in section 8.
2. Refining the concept of tax transition.
Tax transition is a concept that covers a multidimensional area of meaning. Yet, in the weak hypothesis, it refers to the balancing role of international trade taxes through increases in domestic revenue (Baunsgaard and Keen 2010). This definition implies a change in the composition of government revenue with now an increased reliance on domestic tax revenues in order to offset international trade liberalization revenue losses (substitution effect over their seigniorage tax).
On the stronger hypothesis, tax transition adds additional conditions that consist in reducing the social cost of public revenue, transforming progressively the tax system (equity, transparency, liability and tax morale) for maintaining an appropriate level of tax revenue (Chambas 2005b). While the interest with VAT is to raise more revenue, for income taxes the need is to enhance equity, liability and tax morale as a primary goal, and raise revenue next.
To sum, our definition of tax transition under the weak hypothesis implies a balancing aspect of international trade tax revenue made possible through increases in domestic revenue. But under the stronger one, while balancing trade tax revenue losses by increased revenue mobilization with domestic tax revenue, countries must also maintain an adequate level of overall tax revenue by enhancing tax compliance, equity and transparency.
6
Table 1: Major tax transition tools: key attributes
Type of tax Equity Liability Transparency Tax compliance Revenue power
VAT Χ Χ Χ Χ √ Excises Χ Χ Χ Χ √ Personal income tax √ √ Χ Χ Χ Corporate income tax √ √ Χ Χ Χ Property tax √ √ Χ Χ Χ
3. Tax transition with incomes and property taxes: Stylized facts
In this section, we aim at providing some basic graphs, in order to draw potential conclusions on tax transition features by incomes and property taxes in developing countries.
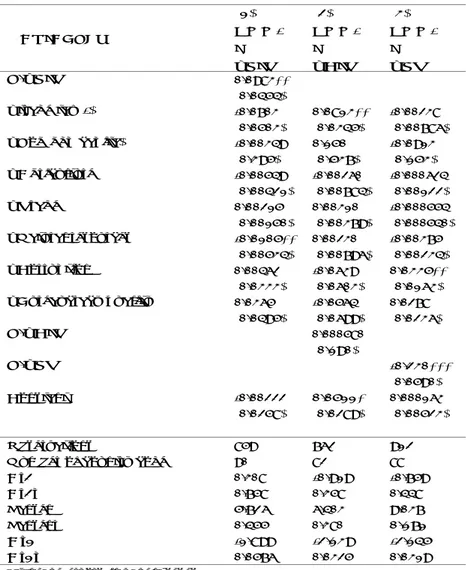
Graph1: Total tax, trade tax, individual, corporate and property tax (% of gdp). Sub-Saharan African countries.
7
Graph2: Total tax, trade tax, individual, corporate and property tax (% of gdp). Asian countries.
Graph3: Total tax, trade tax, individual, corporate and property tax (% of gdp). Latin American countries.
Source : Author with ICTD data.
8
Some conclusions can be made from these graphs. First, whatever the region considered in graph 1, graph 2, or graph 3, we observe a certain downward contribution of international trade tax revenue in developing countries (formerly seigniorage tax in these countries). On the whole, this tax has decreased in either African, Asian, or Latin American countries. Sub-Saharan African countries are however, the most dependent on international trade tax revenue as compared to other countries.
Second, in African countries, we observe a slight increase in personal and corporate income taxes over the years 2000 to 2013. In Asian and Latin American countries, we rather observe a constant tendency of these taxes over the same period. But overall, there is no remarkable clear growing trend in income taxes in all regions, that could envisage any compensation effect of these taxes over international trade taxes. But this conclusion can be nuanced considering the above disparities observed across regions.
Finally, a third major recognition is the poor contribution of property tax to total tax revenue mobilization in these countries. Despite property taxation being less subject to tax base competition, it lacks interest in developing countries mainly due to high administrative costs in enforcing property taxation. This makes property tax a losing proposition in terms of revenue mobilization per expenditure of administrative costs (Bahl & Martinez-Vazquez, 2007). Overall, it can be suspected that, incomes and property taxes couldn’t act as valuable tax transition tools in developing countries.
4. Identify challenges to incomes and property taxes as tax
transition tools in developing countries.
4.1 Incomes taxes.
Any tax discussion in developing countries, must take into account the economic structure of these countries that includes two kinds of taxpayers: the large agriculture sector encountered, and the prominence of the underground economy (V. Tanzi & Zee, 2000). Taxing these sectors raises substantial practical difficulties in terms of enforcement and revenue mobilization (Alm, Martinez-Vazquez, & Wallace, 2005; Spiro, 2018; Feige, 2007). The tax base potentially reachable in such circumstances constitutes a smaller portion of total economic activities than in developed countries (R. M. Bird et al., 2004). Economic development, particularly the increase in the number of medium and large enterprises, and the shift from subsistence agriculture to manufacturing sectors and formal services, will make it easier to tax incomes in these countries (R. M. Bird & Zolt, 2005).
9
4.1.1 Personal income taxes
Mobilizing personal income tax revenue in developing countries is something more puzzling. Still, in many developing countries, the proportion of workforce addicted to the modern economy especially from the public and private sector is relatively small. Such limited part of the working population is the main contributor of the personal income tax, by the withholding regime on wages, while many times, tax authorities are unable to observe, enforce and tax their business incomes or self-employment incomes (Alm, Bahl, & Murray, 1991). In the unrecorded economy, many employees have no formal contract and their employers are unknown to tax authorities (Chambas, 2005a). Substantial part of individuals are not taxed on their business(es) or self-employment incomes because of the lack of enforcement methods (Gordon & Li, 2009). These business incomes come from commercial, independent and liberal activities (lawyers, accountants, doctors, etc.). The revenue potential that could be derived from these types of activities is insufficiently collected because of lack of information to tax authorities. Unfortunately, even though an increasing part of the upper-middle and wealthy class receive reasonable rental incomes from property, these forms of revenue largely escape taxation, except if it is paid by a corporation where we can imagine a withholding regime as with income from interests and dividends. Nevertheless, an increased part of these incomes are cash paid by individuals to owners unknown to tax authorities (Chambas, 2005a).
4.1.2 Corporate income taxes
Corporate taxation also raises substantial challenges in developing countries, and more closely while considering globalization aspects. Primarily, in the modern economy, corporates that establish effective accounting for taxation are limited (Chambas, 2005a). Not only effective accounting, but also the incoherent design of the accounting rules (V. Tanzi & Zee, 2000). According to V. Tanzi and Zee (2000) allowable depreciations of physical assets is one of the most structural element in determining CIT1 and corporate profitability. Frequently, countries
have depreciation systems that are complex, incoherent and not tax-friendly (V. Tanzi & Zee,
2000). These include (i) excessive number of depreciation rates, (ii) excessive number of asset categories, (iii) a structure of depreciation rates that is not in accordance with the relative obsolescence of assets categories. Rectifying these shortcomings would certainly simplify bookkeeping requirements (V. Tanzi & Zee, 2000). Yet, due to the weak administrative capacity of their tax authorities to audit and control taxpayers, tax base is poorly contained (Chambas,
2005a). Frequently, due to the low threshold of adopted turnover, tax administration files are crowded with many small corporate activities. Unfortunately, only few large companies concentrate the essential of corporate tax revenue and are also sensitive to the evolution of commodities price shocks (Chambas, 2005a).
10
On another hand, globalization also affects corporate tax revenue through greater tax avoidance practices (transfer pricing methods, profit shifting) by powerful multinationals, and this concern raises important challenges for these countries with weak administrative capacity to control these escape patterns. This view is confirmed by several studies. For example, Crivelli et al. (2016) found that, tax base spillovers are a significant concern for developing countries than for advanced economies. Their paper evidenced cross border tax plannings in developing countries in response to cuts in abroad tax rates (operating mainly through profit shifting), while for developed countries the response is most time through tax competition. Johannesen et al. (2016) find solid empirical evidence that multinational firms reduce considerably their tax bill by shifting profits from high corporate tax affiliates to low ones, in their intra-group activities. This occurs through mispriced goods and services (transfer prices) or through financial assets. Income generating financial assets are allocated through low tax affiliates, whereas cost generating liabilities (internal and external debts) are allocated through high tax affiliates. Later result is also confirmed by Fuest et al. (2011) who find positive relationship between host country corporate tax rate and debt ratio of multinational affiliates in developing countries. The global loss of government revenue caused by profit shifting is counted in hundreds of billions and has been increasing over time (Johannesen et al., 2016).
4.2 Property tax
4.2.1 Foundations of property taxation.
Property taxation presents some benefits. It has the neutral property that affects a bit of taxpayers’ economic behaviors. It constitutes an equitable tax whose perception is closely related to wealth. The immovable nature of the tax base makes property taxation less open to tax base competition. Rapid urbanization of cities is an argument in favour of property taxation that makes it possible to establish a link between the demand for public goods and local taxes (Chambas, 2005a).
4.2.2 Property taxation: related challenges.
Despite its obvious nature, property tax in developing countries is difficult to implement due to the administrative costs of collecting tax with respect to the revenue yielded. Thus, tax administration with weak administrative capacity is reticent to engage in property taxation.
1
11
According to Kelly (2000) a major obstacle of property taxation in less developed countries is tax administration, in implementing basic administrative procedures to improve the coverage and valuation techniques. The absence of property registry and property rights also represent a huge challenge (Chambas, 2005a). Finally, in developing countries, the mid-class considers property taxation unfair with respect to savings needed to obtain property, while the wealthy- class conflicts with property taxation because it reduces the return of their wealth (Chambas,
2005a).
5. Could financial development and digital improvements help
bridge the gap in mobilizing direct tax revenues?
5.1 Conceptual framework of the impact of financial development on tax revenue.
A major constraint for taxation in developing countries relies on the fact that, tax administrations in these countries are unable to observe transactions in order to impose tax on them. Or they may observe them, but they lack enforcement methods in order to deal with these challenges. A growing literature therefore argues that understanding information flows is central for effective taxation (Pomeranz, 2015; Kosonen & Ropponen, 2015; Hondroyiannis & Papaoikonomou, 2017; Besley & Persson, 2014; R. M. Bird & Zolt, 2008a; Kleven et al., 2016). The challenge of enforcing income taxes is particularly severe in developing countries, where many transactions in the economy are not readily observable by tax authorities (Besley & Persson, 2013; Gordon & Li, 2009). An emerging literature highlights the role of financial development on tax revenue nexus, as financial development acts as a source of information flows for tax authorities. Several arguments are put forward. One aspect of the argument outlined by Hondroyiannis and Papaoikonomou (2017) is the dematerializing effects of financial development. As tax avoidance is often facilitated by cash transactions, efficient financial tools such as checks and cards are likely to increase the probability of detection, leading to greater tax compliance. The new agenda for tax reform in developing countries prescribes a broad tax base, with increased reliance on income taxes. Thus, governments must be able to sufficiently monitor receipts of income, a complex puzzle in countries with opaque financial systems. Efficient income tax collection is obviously impossible if income is received and spent as cash. If, instead, a country has a robust, transparent, and widely used banking system, the government has a great facility to tax either incomes or purchases (Gilbert & Ilievski, 2016). The ability of the financial sector to reveal and signal revenues reduces information frictions on taxpayers’ incomes and purchases, through financial institutions and financial markets (Ellul et al., 2015). Improvements by way of better information by the financial sector also reduce
12
firms’ incentives to operate underground (Gilbert & Ilievski, 2016). As highlighted by Beck et al. (2014), financial development contributes to reduce firms’ tax evasion, as access to finance is expensive for firms with greater tax avoidance practices (Hasan et al., 2014). More trans- parent firms are the ones that enjoy better access to finance (Ellul et al., 2015). This means, firms are more likely to under-report sales, in economies with underdeveloped financial markets because they gain little from being formal (Johnson et al., 2000). In addition, information related to corporate misconducts are easily observed in a well-developed financial system, and shared among all potential lenders, which will make it more difficult to evade taxes (Jappelli & Pagano, 2002). Capasso and Jappelli (2013) provide a theoretical framework that explains the relationship between financial development and corporate tax revenue. In their theoretical framework, agents allocate investments between a low-return technology which can be operated with internal funds, and a high-return technology which requires external finance. Firms can reduce the cost of funding by disclosing more assets and pledging them as collateral. They show that, financial development increases the likelihood of firms to signal their assets and comply with tax obligations when they become more high-tech projects depending.
The development of the financial sector plays an important role in acquiring information, enforcing contracts and making transactions (Levine, 2005). In conjunction with legal, regulatory tax systems (Levine, 2005), it facilitates tax enforcement but also direct collection of taxes (Bose et al., 2012; Capasso & Jappelli, 2013). Through use of the financial sector, firms generate paper trails, facilitating tax enforcement (Gordon & Li, 2009).
13
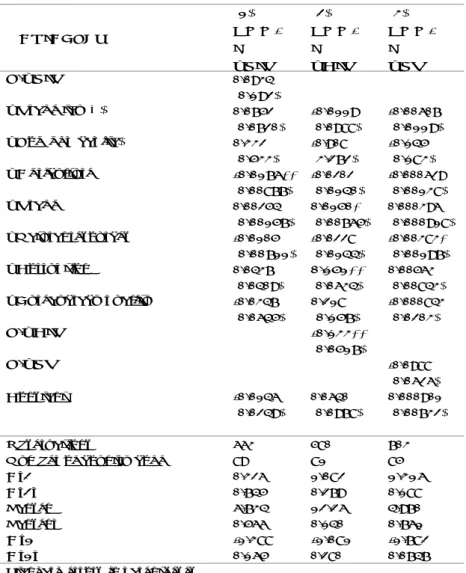
Graph 4: Scatter plot between financial development and tax revenue.
5.2 Closing the technology gap and direct tax revenue mobilization.
A promising path in developing countries is also to adopt various practices in tax administration in order to broaden tax bases. As highlighted by R. Bird (2010), no modern tax administration can perform its tasks efficiently without using modern information technology. Personal income tax, which is withheld at source could benefit from digitalization to manage declarations and payments online (Gnangnon & Brun, 2018). Digital improvements facilitate controls by the tax administration in order to broaden tax bases. Connecting tax administration softwares with large enterprises websites, would lead to better control of tax evasion (Gnangnon & Brun, 2018). Electronic filing methods of taxes e-tax (internet based or barcode2
based tax filing methods) are important issues that automate tax processes in an attempt to improve efficiency in collecting tax information. They have the potential to improve tax-filing services and at the same time reducing compliance costs to taxpayers and tax agencies (Fu et al.,
2006). Tax administrations increasingly need information technology expertise because some of their most important taxpayers (multinational firms) and large domestic firms, employ sophisticated computer systems that are beyond the investigative capacity of technologically backward tax administrations (R. Bird, 2010). Advances in information technology (IT) also offer a cheaper possibility for gathering and analyzing a large amount of firms’ data (data processing). It serves to monitor earning information and improve tax capacities (Ali et al.,
2015). A deep analysis of technology and taxation is provided by R. M. Bird and Zolt (2008b) emphasizing the fact that, tax administration in developing countries must move from hand to
2
14
mouse to improve enforcement, auditing process and collection ratios.
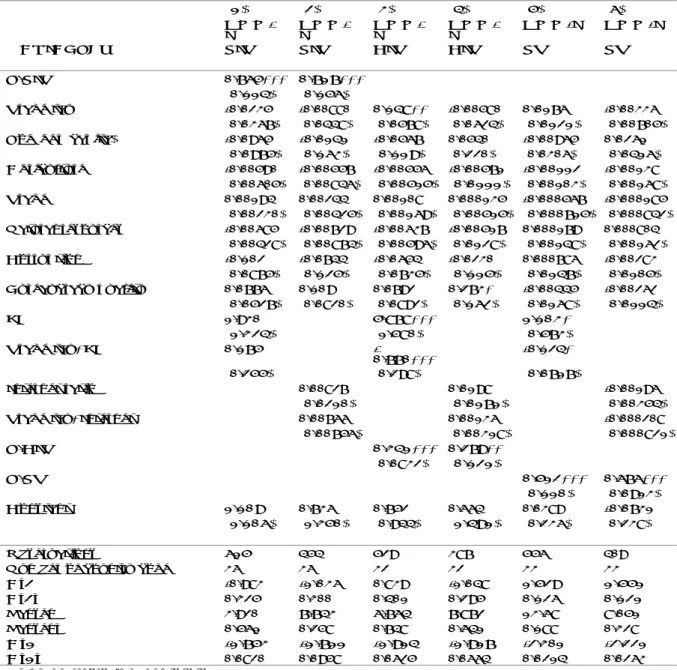
Graph 5: Scatter plot between internet consumption and tax revenue.
6 Empirical framework.
6.1 Model specification and econometric strategy.
We essentially investigate in this paper the compensation aspects of incomes and property taxes over international trade tax revenue losses in developing countries. Is there any change in the composition of government revenue that helps compensate for international trade taxes with incomes and property taxes? We start by presenting the following dynamic empirical specification as our first identification strategy (Baunsgaard & Keen, 2010).
Equation 1: Compensatory effect model:
𝑌 𝛽 𝛽 𝑌 𝛽 𝑇𝑟𝑎𝑑𝑒_𝑡𝑎𝑥 𝛽 𝑋 𝜇 𝜀 (1)
Where Y is a matrix of dependent variables (PIT3, CIT4 PT5), and trade tax (TT6) is the variable
of international trade tax revenues. We add this variable in the model to investigate for movements in PIT, CIT, and PT depending on movements in trade tax that help study compensation effects. We are interested in the coefficient β2. If this coefficient points negative,
it indicates a compensatory effect of incomes and property taxes over international trade tax
expedition of tax‐filing process, barcode works like a paper disk which contains machine readable information to help tax administration quickly feed tax information forms into the agency’s information system through a scanner. eTax eliminates manual entry errors by taxpayers and provides tax agency with a cleaner information of income tax returns. 3Personal income tax 4Corporate Income Tax 5 Property tax 6 Trade tax
15
revenue losses. Our sample covers 96 developing countries spanning the period 1985-2013. We have an unbalanced panel data over this period due to the poor coverage of some revenue data. We control for the lagged value of the dependent variable to take into account inertia in tax revenue mobilization in developing countries. X is the matrix of control variables and µi the unobserved heterogeneity time invariant related to countries that explains their revenue patterns. ξit, the idiosyncratic error term.
Because of the lagged dependent variable, estimating our equation using a fixed effects model would lead our results to suffer from Nickell bias (Nickell, 1981). We rather perform system Generalized Method of Moment GMM estimation (Blundell & Bond, 1998) with Windmeijer
(2005) finite sample correction of standard errors. System GMM combines in one system the regression in differences (Arellano & Bond, 1991) and the regression in levels (Arellano & Bover,
1995). Differences equations are instrumented with instruments in levels and level equations are instrumented with instruments in differences. Based on generalized method of moments, our preferred identification strategy is to add external instruments to our moment conditions. We add two external instruments: the adherence of countries to World Trade Organization (WTO) policies guidelines, and their trade tax effective rate in a GMM-IV rationale estimate. The idea behind trade tax effective rate is to capture the extent of trade liberalization on trade tax revenue. For the adherence to WTO guidelines, this instrument is added to the model to capture the choice to comply with an external policy guideline on trade tax revenues. We hypothesize that the adherence to WTO has any chance to affect local taxes (property tax, individual income tax or corporate income tax) and the level of trade tax effective rate is closely related to trade tax revenue but not property tax or individual income tax.
The overidentification test proposed by (Hansen, 1982) and the autocorrelation test of (Arellano & Bond, 1991) are used to confirm the validity of the external and internal instruments.
6.2 Data and variables.
6.2.1. Dependent variables.
Dependent variables of PIT, CIT and PT come from International Centre for Tax and Development (ICTD, 2018). All variables are expressed non-resource and in percentage of GDP.
6.2.2 Independent variables.
Explanatory variables include trade tax revenue. This variable comes from International Centre for Tax and Development (ICTD, 2018) database. As said earlier, we add this variable in the model to investigate for movements in PIT, CIT, and PT depending on movements in trade tax
16
that help study compensation effects. In equation 1, we use covariates data (i) gdp per capita, (ii) trade openness in percentage of GDP, (iii) natural resources rents in percentage of GDP, (iv) agriculture value added to GDP, (v) the level of corruption and (vi) the level of bureaucracy quality. These variables come from the World Development Indicators (WDI, 2018), except corruption and bureaucracy quality that come from International Country Risk Guide (ICRG). Per capita income is expected to be positively correlated with tax revenue. It expresses the overall level of economic development and the advanced design of tax structure. According to Wagner’s law, the demand for governments services is often income–elastic, so that, the share of taxes collected by governments to provide goods and services is expected to rise with income (Gupta, 2007).
Trade openness may affect tax revenue through several composition effects. If trade openness occurs primarily through reduction in tariffs, one would expect losses in tariff revenues. But,
Keen and Simone (2004) argue that, revenue might increase provided trade liberalization occurs through reduction of quotas, elimination of exemptions, and improvements in custom procedures. Aizenman and Jinjarak (2009) also emphasize trade openness should shift tax revenue from “easy to collect taxes” (tariffs and seigniorage taxes) towards “hard to collect taxes” (PIT, CIT and PT) suggesting its effect on tax transition concerns in developing countries.
Recent challenges in natural resources wealth countries, focused on the ‘Dutch disease’ effects. Natural resources might affect taxation by its effect on tax efforts. One aspect of the resource curse may be its impact on a country’s incentive to mobilize non-resource domestic tax revenues. For example Moore (2007), argued that, governments relying on resources rents are likely to mobilize less revenue from the non-resource sector and this result suggests that, resources rents lead to low domestic tax efforts and reduce tax revenue mobilization.
Agriculture sector is expected to be negatively correlated with tax revenue, as it remains almost hard to tax agriculture in developing countries. As highlighted by Stotsky and WoldeMariam
(1997), this variable almost negatively matter for tax revenue in these countries.
The literature suggests that corruption affect tax revenue by its effect on tax evasion (Attila, Chambas, & Combes, 2009). Indeed, Hindriks, Keen, and Muthoo (1999) stress that corruption and income tax evasion are closely linked. Corruption undermines tax morale and tends to increase the underground economy. This could have a negative effect on income taxes. But the effect could be mixed. In a high corrupt environment, the possibility of negotiating bribes between auditors and taxpayers may encourage controllers to increase fraud detection efforts. With time, fraud would become less attractive, and corruption would lead to increased tax revenue.
17
Finally, incentive reforms in tax administration notably the internal organization of bureaucracies and organizational structure, positively affect revenue mobilization. Or on the other hand, the extent of discretion available to bureaucrats, and the underlying dimension of bureaucratic quality undermines revenue mobilization (Mookherjee, 1998).
7. Results.
7.1 Baseline results
Table 2 reports results for the compensatory effects between PIT, CIT, PT and trade taxes (TT). We do not find any compensation role of these taxes on trade tax revenues. This is not surprising since incomes and property taxes represent a small proportion of revenue concerns in developing countries. Tax authorities in developing countries face substantial challenges in raising incomes and property taxes due on one hand, to administrative challenges they face (lack of enforcement methods), and on the other hand, to the economic structure of these countries with sizeable part of informality (activities conducted underground) and a large part of the agriculture sector. In such circumstance, tax base that can be optimally reached in total economic activities remains limited. Diversifying the economic activities will make it possible to tax incomes in these countries (R. M. Bird & Zolt, 2005).
18
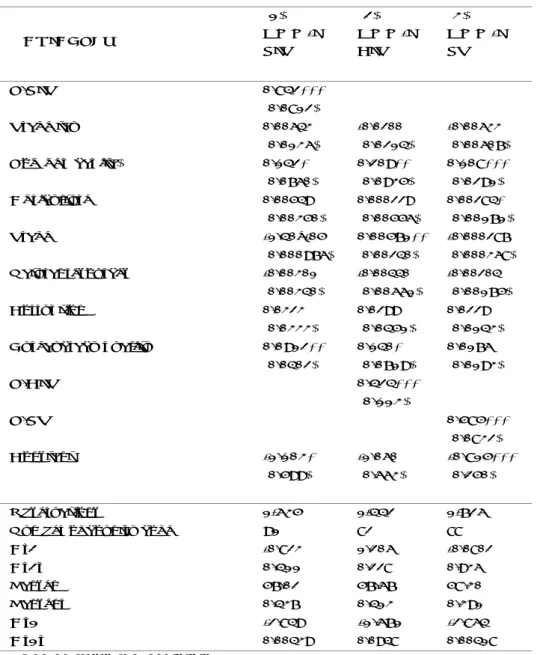
Table 2: Compensation effect: PIT, CIT, PT, Baseline result
VARIABLES (1) GMM-IV PIT (2) GMM-IV CIT (3) GMM-IV PT L.PIT 0.842*** (0.0812) Trade tax 0.00643 -0.0200 -0.00633 (0.0136) (0.0214) (0.00607) Log(gdp capita) 0.142* 0.209** 0.108*** (0.0760) (0.0935) (0.0291) Agriculture 0.00549 0.000229 0.00284* (0.00350) (0.00556) (0.00171) Trade -1.40e-05 0.00571** -0.000287 (0.000976) (0.00240) (0.000368) Natural resources -0.00301 -0.00440 -0.00204 (0.00340) (0.00661) (0.00175) Corruption 0.0323 0.0299 0.0229 (0.0333) (0.0451) (0.0143) Bureaucracy quality 0.0912** 0.140* 0.0176 (0.0402) (0.0719) (0.0193) L.CIT 0.424*** (0.113) L.PT 0.585*** (0.0832) Constant -1.103* -1.060 -0.815*** (0.599) (0.663) (0.250) Observations 1,635 1,442 1,726
Number of country code 91 82 88
Ar2 -0.823 1.206 -0.0802 Ar2p 0.411 0.228 0.936 Hansen 57.02 57.67 58.30 Hansenp 0.437 0.413 0.391 Ar1 -2.849 -1.671 -2.864 Ar1p 0.00439 0.0948 0.00418
Standard errors in parentheses *** p<0.01, ** p<0.05, * p<0.1
7.2 Taking into account financial development and digital improvements.
Now, we aim to test for two main mediators that can help raise tax enforcement and tax revenue collection in developing countries, namely financial development and internet consumption. Financial development plays an important role in acquiring information on taxpayers’ incomes through financial institutions and financial markets. It facilitates tax enforcement, the collection of tax, and helps crowd-out shadow economy. It also generates paper trails for firms with greater tax avoidance practices, thus limiting tax evasion.
Improving digital tools such as the internet consumption ratio will allow for smart policies in tax administration. It will help manage declarations and payments online, automates tax processes to eliminate manual entry errors and provides tax agency with cleaner information on income tax returns.
19
We re-estimate the following empirical model that helps study the mediating effect of these instruments on the compensation patterns in developing countries.
𝑌 𝛽 𝛽 𝑌 𝛽 𝑇𝑟𝑎𝑑𝑒_𝑡𝑎𝑥 𝛽 𝑍 𝛽 𝑇𝑟𝑎𝑑𝑒_𝑡𝑎𝑥 ∗ 𝑍 𝛽 𝑋 𝜇 𝜀 (2)
where Z is a matrix of variables (financial development, internet consumption ratio). Our variable of financial development is a composite index that covers multidimensional areas of financial development and expresses a country’s overall level of financial development ranged between [0 1], with greater value implying more developed financial systems. It was introduced by the International Monetary Fund Strategy Policy and Review Department constructed from various indicators of financial systems7. The internet consumption variable comes from World
Development Indicators (2018). We are interested in the coefficient β4. Results are given in
table 3.
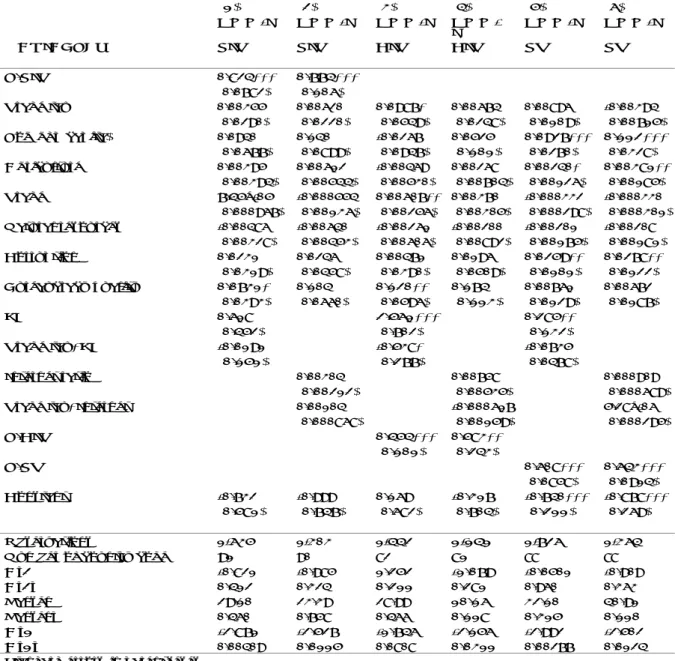
We do not find any mediating effect of financial development on personal income tax revenue compensation patterns in developing countries, but financial development made it possible to compensate for revenue losses with corporate income taxes. This result is given in column 3 of table 3. It seems like financial development is helping to crowd-out shadow economy and leads to business formalization in these countries. But our result rather points out a threshold effect. The estimated threshold is 18%. Countries with financial development at least above 18% are those in which the beneficial effect of financial development on corporate tax revenue may materialize.
Finally, we do not find any mediating effect by the internet consumption ratio with all taxes (PIT, CIT, PT). Digitalization is a recent phenomenon that takes place in tax administration in developing countries. This can help understand the non-effect of the internet variable on the compensation patterns of developing countries.
20
Table 3: The mediating effect of financial development and digital improvements
(1) (2) (3) (4) (5) (6)
GMM-IV GMM-IV IV
GMM-IV
GMM-IV GMM-IV
VARIABLES PIT PIT CIT CIT PT PT
L.PIT 0.824*** 0.774*** (0.0782) (0.106) Trade tax 0.00355 0.00620 0.0987* 0.00674 0.00896 -0.00394 (0.0290) (0.0220) (0.0549) (0.0248) (0.0109) (0.00715) Log(gdp capita) 0.0940 0.140 -0.0267 0.0525 0.0927*** 0.112*** (0.0677) (0.0899) (0.0947) (0.101) (0.0270) (0.0328) Agriculture 0.00395 0.00612 -0.00469 0.00268 0.00240* 0.00381** (0.00394) (0.00544) (0.00530) (0.00704) (0.00126) (0.00185) Trade 7.45e-05 -0.000554 0.00607** 0.00370 -0.000332 -0.000330 (0.000967) (0.00136) (0.00256) (0.00305) (0.000298) (0.000301) Natural resources -0.00486 -0.00640 -0.00261 -0.00200 -0.00201 -0.00208 (0.00328) (0.00453) (0.00606) (0.00892) (0.00175) (0.00181) Corruption 0.0231 0.0246 0.00471 0.0196 0.0259** 0.0278** (0.0319) (0.0458) (0.0390) (0.0509) (0.0101) (0.0122) Bureaucracy quality 0.0731* 0.104 0.120** 0.174 0.00761 0.00672 (0.0393) (0.0660) (0.0596) (0.113) (0.0129) (0.0187) FD 0.618 2.561*** 0.285** (0.452) (0.702) (0.132) Trade tax*FD -0.0191 -0.538* -0.0735 (0.151) (0.277) (0.0478) Internet ratio 0.00304 0.00758 0.000909 (0.00212) (0.00535) (0.000689)
Trade tax*Internet 0.00104 -0.000617 5.28e-06
(0.000868) (0.00159) (0.000295) L.CIT 0.454*** 0.583** (0.101) (0.243) L.PT 0.608*** 0.643*** (0.0858) (0.0914) Constant -0.732 -0.999 0.169 -0.317 -0.740*** -0.878*** (0.581) (0.747) (0.682) (0.704) (0.211) (0.269) Observations 1,635 1,303 1,442 1,141 1,726 1,364
Number of country code 91 90 82 81 88 88
Ar2 -0.821 -0.985 1.252 -1.079 -0.0501 -0.909 Ar2p 0.412 0.324 0.211 0.281 0.960 0.363 Hansen 29.10 23.39 28.99 10.16 32.10 40.91 Hansenp 0.460 0.758 0.466 0.118 0.315 0.110 Ar1 -2.871 -2.527 -1.746 -2.156 -2.992 -2.502 Ar1p 0.00409 0.0115 0.0808 0.0311 0.00277 0.0124
Standard errors in parentheses *** p<0.01, ** p<0.05, * p<0.1
8. Sensitivity analyses.
8.1 Non linearities.
Our first baseline estimate was conducted without taking into account possible nonlinear specification in the compensation patterns between PIT, CIT, PT and TT. Our main assumption here, is to investigate whether there is a compensation effect that takes place when the decrease in TT becomes more important. As said, we want to investigate whether tax administrations are forced to implement sound fiscal policies8 to raise the level of direct taxes when there is a
21 Basically, we re-estimate the following model:
𝑌 𝛽 𝛽 𝑌 𝛽 𝑇𝑟𝑎𝑑𝑒_𝑡𝑎𝑥 𝛽 𝑇𝑟𝑎𝑑𝑒_𝑡𝑎𝑥 𝛽 𝑋 𝜇 𝜀 (3)
Results are given in table 4. We do not find any compensation effect that takes place because
of a more pronounced decline in TTR. This result confirms the fact that direct taxes revenue mobilization in developing countries are still limited to accommodate for any shock in TT revenue and are not yet serving as valuable tax transition instruments in developing countries.
Table 4: Non linearities
VARIABLES (1) GMM-IV PIT (2) GMM-IV CIT (3) GMM-IV PT L.PIT 0.864*** (0.0780) Trade tax -0.0329 0.0317 -0.00726 (0.0387) (0.0693) (0.0172) T rade_tax2 0.00327 -0.00330 0.000316 (0.00387) (0.00572) (0.00139) Log(gdp capita) 0.119 0.182* 0.133*** (0.0795) (0.0946) (0.0318) Agriculture 0.00455 0.00406 0.00347* (0.00379) (0.00734) (0.00190) Trade 0.000509 0.00430* -0.000621 (0.000966) (0.00256) (0.000481) Natural resources -0.00494 -0.00584 -0.00129 (0.00354) (0.00792) (0.00197) Corruption 0.0116 -0.0123 0.0339** (0.0307) (0.0437) (0.0136) Bureaucracy quality 0.0749 0.183** 0.0170 (0.0464) (0.0798) (0.0173) L.CIT 0.487*** (0.116) L.PT 0.558*** (0.0905) Constant -0.841 -1.069 -1.010*** (0.611) (0.789) (0.280) Observations 1,635 1,442 1,726
Number of country code 91 82 88
Ar2 -0.830 1.375 -0.120 Ar2p 0.406 0.169 0.904 Hansen 22.22 25.31 22.89 Hansenp 0.387 0.234 0.350 Ar1 -2.981 -1.879 -2.901 Ar1p 0.00288 0.0602 0.00372
Standard errors in parentheses *** p<0.01, ** p<0.05, * p<0.1
8
These policies may for example concern policies to fight against tax evasion and collect back taxes.
22
8.2 Improving the identification strategy: investigating for asymmetries.
In this section, we aim to improve the standard framework for identifying the compensation effect between PIT, CIT, PT and TT. Instead of regressing the level of direct taxes (PIT, CIT, PT) on TT, we regress the variation of these taxes on the variations of TT. This is done by taking the first difference of variables in the model and identify the episodes of effective decrease in trade tax revenues as compared to episodes of increase in this tax that we call "asymmetries". We then regress the variations of PIT, CIT and PT on negative variations of TT and on positive variations of this tax. Results are given in table 5 and table 6.
No evidence was found suggesting that it is better to specify our model in variations to improve the identification strategy. We still find robust result suggesting that, incomes and property taxes do not compensate for TTR losses in developing countries, except the beneficial effect of financial development found in equation 2.
Table 5: Investigating for asymmetries: negative shocks
VARIABLES (1) GMM-IV ∆PIT (2) GMM-IV ∆CIT (3) GMM-IV ∆PT L.∆PIT 0.0983** (0.0454) ∆trade tax(-) -0.0703 0.0813** -0.00238 (0.0503) (0.0345) (0.00786) ∆Log(gdp capita) -0.00349 0.150 -0.0913 (0.395) (0.537) (0.153) ∆Agriculture -0.00549 -0.00260 -0.000624 (0.00421) (0.00784) (0.00122) ∆Trade 0.00215 0.00310 -0.000554 (0.00150) (0.00379) (0.000540) ∆Natural resources -0.0105** 0.00230 -0.00375 (0.00534) (0.00796) (0.00234) ∆Corruption 0.00462 -0.0639 0.0335** (0.0333) (0.0603) (0.0163) ∆Bureaucracy quality 0.0365 -0.0564 0.0278 (0.0495) (0.0699) (0.0236) L.∆CIT 0.000580 (0.190) L.∆PT -0.230*** (0.0590) Constant -0.00222 0.0511* 0.000163 (0.0258) (0.0289) (0.00523) Observations 859 762 912
Number of country code 90 82 88
Ar2 0.308 -0.919 -0.759 Ar2p 0.758 0.358 0.448 Hansen 5.726 6.403 9.037 Hansenp 0.455 0.380 0.171 Ar1 -1.899 -2.139 -2.145 Ar1p 0.0576 0.0325 0.0319
Standard errors in parentheses *** p<0.01, ** p<0.05, * p<0.1
23
Table 6: Asymmetries: Positive shocks
VARIABLES (1) GMM-IV ∆PIT (2) GMM-IV ∆CIT (3) GMM-IV ∆PT L.∆PIT 0.0934 (0.192) ∆Trade tax(+) 0.0752 -0.0119 -0.00607 (0.0720) (0.0988) (0.0119) ∆Log(gdp capita) 0.332 -0.908 -0.145 (0.533) (3.272) (0.183) ∆Agriculture -0.0176** -0.0202 -0.000629 (0.00877) (0.0140) (0.00138) ∆Trade 0.00254 0.0150* 0.000396 (0.00157) (0.00765) (0.000918) ∆Natural resources -0.0105 -0.0228 -0.00383* (0.00711) (0.0144) (0.00197) ∆Corruption 0.0437 0.151** 0.00563 (0.0409) (0.0634) (0.00843) ∆Bureaucracy quality -0.0347 0.218 -0.000843 (0.0645) (0.157) (0.0203) L.∆CIT -0.133** (0.0517) L.∆PT -0.0988 (0.0626) Constant -0.0146 0.0640 0.000901 (0.0249) (0.0978) (0.00732) Observations 663 580 703
Number of country code 89 81 85
Ar2 0.326 1.082 1.316 Ar2p 0.745 0.279 0.188 Hansen 6.734 12.26 4.970 Hansenp 0.566 0.140 0.761 Ar1 -1.388 -1.081 -1.782 Ar1p 0.165 0.280 0.0747
Standard errors in parentheses *** p<0.01, ** p<0.05, * p<0.1
8.3 Sub-sample heterogeneities.
In our baseline estimate, we found that incomes and property taxes do not compensate for TTR losses, except the beneficial effect of financial development in equation 2. We aim to deepen the mediating effect of financial development focusing on several regions in developing world. The main idea is that financial development varies widely across regions in developing world. Financial development is relatively low in Sub-Saharan African countries in all indicators (institutions, markets) and all dimensions (access, depth, efficiency) as compared to other developing countries. The financial inclusion gap is also wide in this area of countries (Otchere et al., 2017). However, its marginal effect could be reinforced by its relatively stability to crisis (Otchere et al., 2017). Conversely, the high financial sector development in Asian and Latin American countries, in terms of depth, inclusion and access as compared to Sub-Saharan African countries, mostly goes together with disturbances (Heng et al., 2016). We make sensitivity analysis to ensure that, financial development is effectively mediating tax revenue
24
in the tax transition concerns over these areas of countries.
Results are given in table 7 for SSA countries, table 8 for Asian countries, and table 9 for LAC countries.
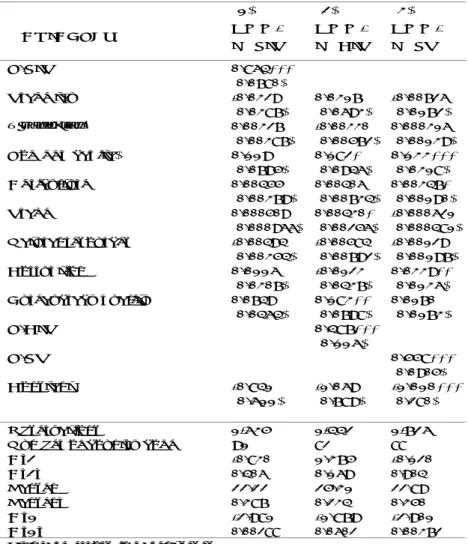
Contrary to what one might think, the level of financial development in SSA countries is mediating the compensation patterns in this area of countries. The effect is driven by corporate income taxes (CIT). One can think that, the stability of the financial sector in SSA countries is at work in this area of countries even with a low level of financial parameters. The result is given in column 3 of table 7. Financial development is progressively crowding-out informal sector in SSA countries leading to corporate formalization and corporate tax revenue. But we found a threshold effect in the mediating effect of financial development of 20%. This suggests that, countries in SSA area with a financial sector development at least above 20% are the ones in which the mediating effect of financial development could materialize.
Our result also holds for property tax in column 5. Without financial development, countries cannot offset for revenue losses with this tax. As financial development increases, it leads to an increase in property tax that helps compensate for trade tax revenue losses. The reasonable idea behind this effect can be that, the use of the financial sector by property owners generates paper trails10 to tax authorities that help enforce property taxation in SSA countries.
Replicating our estimate on Asian countries, we do not find any mediating effect of financial development on the compensation patterns with all taxes.
Finally, on the group of Latin American (LAC) countries, the mediating effect of financial development holds for personal income taxes. Our results are showing heterogeneous effects of financial development according to regions and according to type of tax. The result we obtain here could be explained by the advanced dematerializing effect of financial transactions in this area as compared to SSA countries. As personal income tax evasion is facilitated by cash trans- actions, efficient financial tools such as checks and cards are likely to increase the probability of detection, leading to greater personal income tax compliance. This can be a plausible explanation to the effect obtained with PIT in this area of countries. The advanced dematerializing effect of financial transactions made it possible to better monitor receipts of income in this area of countries. The result is provided in column 1 of table 9, where we find a threshold effect of 28%.
25
Table 7: Sub sample heterogeneities: SSA countries
(1) (2) (3) (4) (5) (6) GMM-IV GMM-IV GMM-IV GMM-IV GMM-IV GMM-IV
VARIABLES PIT PIT CIT CIT PT PT
L.PIT 0.765*** 0.717*** (0.114) (0.156) Trade tax -0.0235 -0.00880 0.148** -0.00580 0.0176 -0.00336 (0.0367) (0.0448) (0.0578) (0.0624) (0.0121) (0.00705) Log(gdp capita) -0.0965 -0.0141 -0.0567 0.0540 -0.00965 0.0261 (0.0975) (0.163) (0.119) (0.220) (0.0306) (0.0416) Agriculture -0.00590 -0.00557 -0.00556 -0.00571 -0.00112 -0.00138 (0.00605) (0.00846) (0.00515) (0.0111) (0.00103) (0.00168) Trade 0.00194 0.00244 0.00108 0.000135 -0.000567 -0.000185 (0.00230) (0.00425) (0.00169) (0.00515) (0.000715) (0.000842) Natural resources -0.00685 -0.00729 -0.00637 -0.00517 0.000179 0.000804 (0.00428) (0.00874) (0.00596) (0.0128) (0.00148) (0.00162) Corruption -0.102 -0.0744 -0.0654 -0.0230 0.000786 -0.00283 (0.0875) (0.125) (0.0735) (0.115) (0.0147) (0.0105) Bureaucracy quality 0.0776 0.109 0.0792 0.273* -0.00445 -0.00262 (0.0527) (0.0820) (0.0892) (0.162) (0.0168) (0.0114) FD 1.930 5.878*** 1.103* (1.324) (1.580) (0.573) Trade tax*FD 0.175 -0.770*** -0.124* (0.255) (0.298) (0.0717) Internet ratio 0.00827 0.0198 -0.00196 (0.0210) (0.0171) (0.00354) Trade tax*Internet 0.00766 0.00136 -0.000208 (0.00756) (0.00318) (0.000821) L.CIT 0.341*** 0.279** (0.0832) (0.121) L.PT 0.512*** 0.676*** (0.110) (0.0913) Constant 1.109 0.736 0.752 0.664 0.0389 -0.0731 (1.106) (1.350) (0.944) (1.491) (0.236) (0.238) Observations 615 454 529 387 556 409
Number of country code 36 36 32 32 33 33
Ar2 -0.983 -1.036 0.839 -1.048 1.529 1.551 Ar2p 0.325 0.300 0.401 0.295 0.126 0.121 Hansen 3.920 7.743 6.764 7.872 13.68 8.051 Hansenp 0.561 0.258 0.748 0.641 0.188 0.328 Ar1 -1.753 -1.711 -1.914 -1.917 -2.301 -2.221 Ar1p 0.0820 0.0958 0.0625 0.0664 0.0214 0.0263
Standard errors in parentheses *** p<0.01, ** p<0.05, * p<0.1
26
Table 8: Sub sample heterogeneities: South East Pacific Asia
(1) (2) (3) (4) (5) (6)
GMM-IV GMM-IV GMM-IV GMM-IV GMM-IV GMM-IV
VARIABLES PIT PIT CIT CIT PT PT
L.PIT 0.950*** 1.015*** (0.0500) (0.0943) Trade tax -0.0272 -0.0410 -0.00150 0.0215 0.0183 -0.000973 (0.0259) (0.0420) (0.0861) (0.0355) (0.0221) (0.0126) Log(gdp capita) 0.0613 -0.0880 -0.0440 0.000293 0.0529 0.0531 (0.113) (0.242) (0.0735) (0.0825) (0.0792) (0.0461) Agriculture 0.00226 -0.00353 -0.00544 -0.00439 -0.000190 0.00183 (0.00277) (0.0130) (0.00551) (0.00344) (0.00121) (0.00181) Trade -0.000148 0.00143 0.00132 0.00131 -0.000231 -0.000177 (0.000542) (0.00219) (0.00201) (0.000968) (0.000285) (0.000235) Natural resources -0.00515* -0.00836 0.0107* 0.0161*** -0.00297 -0.00233 (0.00312) (0.00703) (0.00637) (0.00538) (0.00261) (0.00192) Corruption 0.0228 0.0289 0.0276 0.0152 0.00609 0.00730 (0.0286) (0.0824) (0.0397) (0.0265) (0.0139) (0.0153) Bureaucracy quality -0.0170 -0.0512 0.0148 -0.00194 -0.00284 -0.00492 (0.0193) (0.0683) (0.0550) (0.0488) (0.00964) (0.0175) FD -0.0615 0.217 0.0157 (0.331) (0.574) (0.134) Trade tax*FD 0.0672 -0.0362 -0.120 (0.0772) (0.310) (0.128)
Internet ratio 5.61e-05 0.00134 0.000531
(0.00207) (0.00212) (0.000561)
Trade tax*Internet -6.47e-05 -0.00152 -0.000189
(0.00189) (0.00150) (0.000402) L.CIT 0.949*** 0.948*** (0.154) (0.0887) L.PT 0.871*** 0.871*** (0.185) (0.0764) Constant -0.353 0.766 0.349 0.0436 -0.316 -0.390 (0.760) (2.115) (0.545) (0.595) (0.503) (0.349) Observations 474 392 445 369 496 403
Number of country code 24 24 23 23 25 25
Ar2 -0.310 -0.225 0.188 -0.263 -1.116 -1.394 Ar2p 0.756 0.822 0.851 0.792 0.265 0.163 Hansen 2.636 3.566 8.364 7.890 7.466 10.25 Hansenp 0.756 0.613 0.213 0.246 0.280 0.115 Ar1 -2.149 -1.993 -2.046 -1.890 -2.060 -1.989 Ar1p 0.0316 0.0462 0.0408 0.0588 0.0394 0.0467
Standard errors in parentheses *** p<0.01, ** p<0.05, * p<0.1
27
Table 9: Sub sample heterogeneities: LAC countries
(1) (2) (3) (4) (5) (6) GMM-IV GMM-IV GMM-IV GMM-IV GMM-IV GMM-IV
VARIABLES PIT PIT CIT CIT PT PT
L.PIT 0.695*** 0.565*** (0.114) (0.218) Trade tax 0.132* 0.0567 -0.0329 -0.0221 -0.0543 0.000387 (0.0713) (0.0709) (0.0895) (0.0985) (0.0420) (0.0150) Log(gdp capita) 0.0566 -0.0403 -0.124 -0.0320 0.135 0.188 (0.180) (0.330) (0.205) (0.126) (0.149) (0.170) Agriculture -0.00751 -0.00755 -0.000263 0.00420 0.00743 0.0115 (0.00982) (0.0355) (0.00955) (0.0102) (0.00820) (0.0136) Trade 0.00556*** 0.00712 0.00591** 0.00417 -0.000264 -0.000667 (0.00209) (0.00724) (0.00290) (0.00388) (0.00129) (0.00235) Natural resources -0.0169* -0.0340 -0.00608 -0.00705 -0.00388 -0.00317 (0.00951) (0.0256) (0.0124) (0.0146) (0.00551) (0.00873) Corruption 0.00851 -0.0167 0.0251 0.0372 -0.00747 0.0205 (0.0581) (0.170) (0.0579) (0.0611) (0.0254) (0.0356) Bureaucracy quality 0.105 0.333 0.0994** 0.113 0.0136 -0.0279 (0.0748) (0.232) (0.0476) (0.0812) (0.0348) (0.0539) FD 1.261 0.536 -0.344 (0.931) (2.020) (0.654) Trade tax*FD -0.470* 0.0741 0.254* (0.255) (0.369) (0.143) Internet ratio 0.00731 -0.000506 0.000517 (0.00674) (0.00438) (0.00187)
Trade tax*Internet -5.72e-05 0.000499 0.000709
(0.00207) (0.000766) (0.000483) L.CIT 0.694*** 0.727*** (0.152) (0.189) L.PT 0.425*** 0.376*** (0.0556) (0.101) Constant -0.851 -0.0842 0.860 0.195 -0.941 -1.546 (1.449) (2.910) (1.498) (1.139) (1.184) (1.431) Observations 354 286 310 247 483 393
Number of country code 22 21 20 19 22 22
Ar2 1.618 0.977 0.399 0.327 -0.887 -1.028 Ar2p 0.106 0.329 0.690 0.744 0.375 0.304 Hansen 8.122 9.055 5.807 6.357 3.558 6.949 Hansenp 0.522 0.170 0.445 0.384 0.615 0.542 Ar1 -1.709 -1.732 -2.362 -1.798 -1.789 -1.841 Ar1p 0.0875 0.0752 0.0182 0.0722 0.0612 0.0518
Standard errors in parentheses *** p<0.01, ** p<0.05, * p<0.1
8.5 Adding more control variables.
In our baseline estimate, we mostly focus on variables that explain tax potential in developing countries as control variables namely gdp per capita, agriculture ratio, trade openness, and natural resources. We also focus on institutional quality by adding the level of corruption and bureaucracy quality. In order to treat for possible "omitted" variable bias that can obscure the compensation effect of direct taxes, we add more control variables in the model. We control for the level of education, inflation, and foreign aid. Kasipillai et al. (2003) document the effect of education on tax compliance behaviors and found that there is an improvement in personal income tax compliance among educated citizens.
28
erode the real value of tax bases leading to low tax revenue. For property and income taxes, the question is much more complex, as long as these taxes are paid on an annual rather than on a monthly basis (Tanzi, 1977). In a situation where prices have increased significantly between one year and the next, an advanced estimate based on the previous year’s nominal income becomes much too low in relation to present income (Tanzi, 1977). Thus, we include this variable in the model.
Some studies point out the role of foreign aid in tax revenue mobilization. The idea is that, aid could exert a complementary or an eviction effect with domestic resource mobilization (Brun, Chambas, & Guerineau, 2011; Kaldor, 1962). Aid as an additional source of government revenue, provides incentive for government to make less tax effort (substitution effect). Conversely, technical assistance that goes with aid helps countries improve their tax administration and mobilize revenue (complementary effect). Sometimes, costs associated with aid instability can also oblige them to rather preserve their tax effort in response to aid volatility (complementary effect).
We control for these variables since these additional variables (level of education, inflation and aid) could also explain the level of trade tax revenue. Results are given in table 10.
We do not find results suggesting improvements in our estimated coefficients, or any compensation effect that appears due to omission of such variables. Rather, the insignificance of our variables, still confirm robust results suggesting that incomes and property taxes are poor revenue compensation tools to balance for international trade tax revenue losses in developing countries.
29
Table 10: Adding more control variables
VARIABLES (1) GMM-IV PIT (2) GMM-IV CIT (3) GMM-IV PT L.PIT 0.821*** (0.0838) Trade tax 0.0139 -0.00194 -0.00206 (0.0172) (0.0267) (0.00561) Log(gdp capita) 0.0604 -0.135 0.0820*** (0.0755) (0.140) (0.0285) Agriculture 0.000733 -0.00612 0.000833 (0.00504) (0.00792) (0.00153) Trade 0.00142 0.00950*** -0.00127** (0.00118) (0.00288) (0.000550) Natural resources -0.00589** 0.000670 -0.00151 (0.00291) (0.00790) (0.00163) Inflation -0.0308 -0.227* 0.0385 (0.0476) (0.120) (0.0333)
School completion rate 0.000787 0.00204 0.00134*
(0.00170) (0.00389) (0.000712) Aid 0.00612 -0.0112 0.00403** (0.00399) (0.00738) (0.00173) Corruption -0.0438 0.00494 0.0131 (0.0332) (0.0550) (0.0133) Bureaucracy quality 0.0585 0.142* -0.0145 (0.0430) (0.0847) (0.0167) L.CIT 0.412*** (0.155) L.PT 0.477*** (0.0893) Constant -0.170 2.307* -0.713** (0.696) (1.192) (0.294) Observations 1,097 940 1,145
Number of country code 84 75 80
Ar2 -0.0116 0.777 -0.541 Ar2p 0.991 0.437 0.588 Hansen 7.618 10.33 7.295 Hansenp 0.367 0.171 0.399 Ar1 -3.436 -1.731 -2.819 Ar1p 0.000591 0.0818 0.00482
Standard errors in parentheses *** p<0.01, ** p<0.05, * p<0.1
8.6 Economic diversification.
The literature identifies the negative effect of commodities price shocks on tax revenue in less diversified economies (Diarra, 2012; Barrot et al., 2018; Gunning & Collier, 1996). A higher degree of diversification would contribute to reduce corporate exposure to external shocks and mitigate the effects of these shocks on government revenue. Economic diversification would con- tribute to reduce for example terms of trade instability, and this beneficial effect could lead to higher tax revenues. This can occur through expansion in major tax bases for example, wages or corporate profits (Gnangnon & Brun, 2017). Furthermore, economic diversification could reduce the dependence on international trade tax revenues, by expanding domestic production possibilities, thereby expanding opportunities for income generation and employment creation
30
(McCalla & Valdes, 1997). We add this variable in the model and present results in table 11.
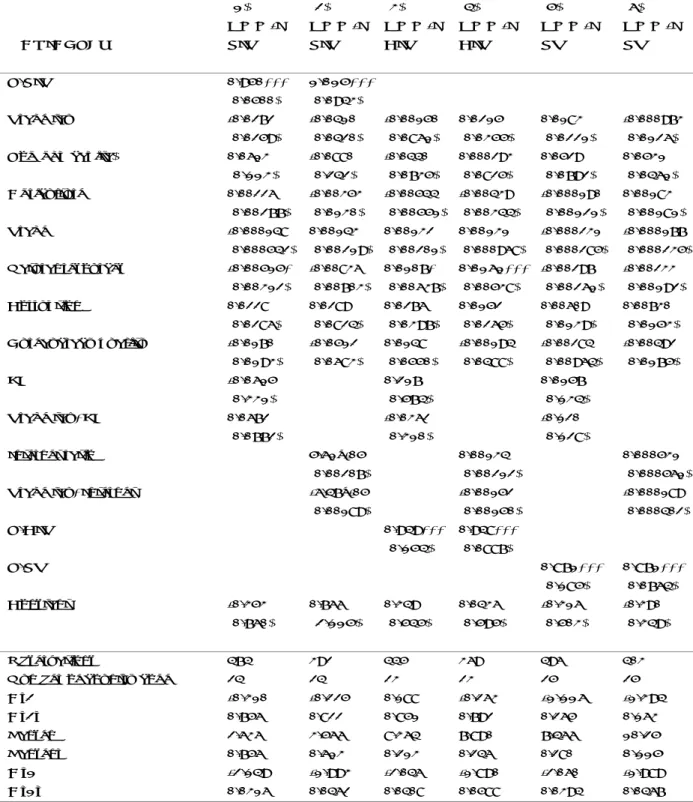
Our results suggest that corporate income tax can play a compensation role if and only if, economic activities are more diversified quick to extend corporate tax bases and reduce volatility of exporters firms to fluctuations in terms of trade. This result is provided in column 2 of table 11, where we also notice the direct beneficial effect of diversification on corporate tax revenue.
Graph 6: Diversification and revenue, year 2013.
31
Table 11: Economic diversification
VARIABLES (1) GMM-IV PIT (2) GMM-IV CIT (3) GMM-IV PT L.PIT 0.850*** (0.0858) Trade tax -0.0599 0.243 0.0244 (0.120) (0.161) (0.0353) Log(gdp capita) 0.107 0.116* 0.0844*** (0.0655) (0.0691) (0.0270) Agriculture 0.00539 -0.000611 0.00195 (0.00401) (0.00528) (0.00130) Trade -0.000190 0.00483** -0.000192 (0.00119) (0.00189) (0.000320)
Natural resources 0.00166 0.00331 -7.62e-05
(0.00436) (0.00672) (0.00130) Corruption 0.0264 -0.00425 0.0227* (0.0348) (0.0383) (0.0128) Bureaucracy 0.0956* 0.106** 0.0160 (0.0543) (0.0536) (0.0186) Diversification 0.640 3.586** 0.373 (1.276) (1.721) (0.367) Trade tax*Diversification 0.278 -0.864* -0.104 (0.465) (0.457) (0.126) L.CIT 0.519*** (0.154) L.PT 0.648*** (0.0689) Constant -1.057 -1.463** -0.752*** (0.799) (0.692) (0.195) Observations 1,467 1,257 1,560
Number of country code 84 75 83
Ar2 -0.835 1.087 1.156 Ar2p 0.404 0.277 0.248 Hansen 60.08 57.82 63.31 Hansenp 0.330 0.408 0.234 Ar1 -2.704 -1.793 -4.018 Ar1p 0.00684 0.0864 5.87e-05
Standard errors in parentheses *** p<0.01, ** p<0.05, * p<0.1
32
Conclusion
This paper investigates the balancing role of direct taxes (PIT , CIT and PT) over international trade tax revenue losses in developing countries consistent with "second generation tax transition concerns" in these countries. We do not find any direct compensation effect of direct taxes in the transition concerns over developing countries. However, we find that financial development plays an important role that helps raise revenue and balance international trade tax revenue losses with direct taxes. The effect is essentially driven by corporate income taxes. Moving towards a second-generation tax transition features in developing countries need the prominent role of financial development to modulate direct taxes revenue collection. Financial tools that aim to broaden financial sector depth, access and inclusion (checks, cards, automated teller machine, mobile bank on phones) would certainly help provide information to government in order to mitigate information challenges they encounter with direct taxes. This is ultimately a step to reach before thinking to any reform that can concern these taxes.
However, government must also be wise to enhance the stability of the financial sector that could help avoid its disturbances.
Even though we do not find any mediating effect with the internet variable, we suspect that the effect could exist, and the non-effect found in this paper is mainly due to the fact that, technology is not limited to internet. Government must take a step forward to broaden revenue collection patterns with digital tools in tax administration in line with the modern agenda for development.
Finally, the need is also to diversify economic activities in order to mitigate shocks on corporate profits and raise more revenue.
33
References
Aizenman, J., & Jinjarak, Y. (2009), “Globalisation and developing countries – a shrinking tax base?” The Journal of Development Studies, 45 (5), 653–671.
Ali, M., Shifa, A., Shimeles, A., & Woldeyes, F. B. (2015), “Information technology and fiscal capacity in a developing country: Evidence from Ethiopia” ICTD Working Paper 31.
Alm, J., Bahl, R., & Murray, M. N. (1991), “Tax base erosion in developing countries” Economic
Development and Cultural Change, 39 (4), 849–872.
Alm, J., Martinez-Vazquez, J., & Wallace, S. (2005), Taxing the hard-to-tax: Lessons from
theory and practice. Emerald Group Publishing Limited.
Arellano, M., & Bond, S. (1991), “Some tests of specification for panel data: Monte-Carlo evidence and an application to employment equations” The review of economic studies, 58 (2), 277–297.
Arellano, M., & Bover, O. (1995), “Another look at the instrumental variable estimation of error-components models” Journal of econometrics, 68 (1), 29–51.
Attila, G., Chambas, G., & Combes, J.-L. (2009), Corruption et mobilisation des recettes publiques: une analyse économétrique. Recherches Economiques De Louvain, 75 (2), 229–268. Bahl, R., & Martinez-Vazquez, J. (2007), “The property tax in developing countries: Current practice and prospects” Documento de trabajo (07RB1).
Barrot, L.-D., Calderón, C., & Servén, L. (2018), “Openness, specialization, and the external vulnerability of developing countries” Journal of Development Economics, 134, 310–328. Baunsgaard, T., & Keen, M. (2010), “Tax revenue and (or?) trade liberalization” Journal of
Public Economics, 94 (9), 563 - 577.
Beck, T., Lin, C., & Ma, Y. (2014), “Why do firms evade taxes? The role of information sharing and financial sector outreach” The Journal of Finance, 69 (2), 763-817.
Besley, T., & Persson, T. (2013), Taxation and development, Handbook of public economics, vol. 5 (Vol. 5, p. 51 - 110), Elsevier
Besley, T., & Persson, T. (2014), “Why do developing countries tax so little?”, Journal of
Economic Perspectives, 28 (4), 99-120.
Bevan, D. (1995), “Fiscal implications of trade liberalization”, IMF Working Paper (95/50). Bird, Richard. (2010), Smart Tax Administration, Economic Premise, No. 36. World Bank, Washington, DC.
Bird, R. M., et al. (2004), “Administrative dimensions of tax reform”, Asia-Pacific tax bulletin, 10 (3), 134–50.
Bird, R. M., & Zolt, E. M. (2005), “The limited role of the personal income tax in developing countries”, Journal of Asian Economics, 16 (6), 928 - 946.
Bird, R. M., & Zolt, E. M. (2008a), “Technology and taxation in developing countries: From hand to mouse”, National Tax Journal, 61 (4), 791–821.
34
Bird, R. M., & Zolt, E. M. (2008b), “Technology and taxation in developing countries: from hand to mouse”, National Tax Journal, 791–821.
Blundell, R., & Bond, S. (1998), “Initial conditions and moment restrictions in dynamic panel data models”, Journal of econometrics, 87 (1), 115–143.
Bose, N., Salvatore, C., & Martin, A. (2012), “The impact of banking development on the size of shadow economies”, Journal of Economic Studies, 39 (6), 620-638.
Brun, J.-F., Chambas, G., & Guerineau, S. (2011), “Aide et mobilisation fiscale dans les pays en développement”, halshs-00556804
Capasso, S., & Jappelli, T. (2013), “Financial development and the underground economy”,
Journal of Development Economics, 101, 167 - 178.
Chambas, G. (2005a), “Afrique au sud du Sahara: Mobiliser des ressources fiscales pour le développement”, Economica.
Chambas, G. (2005b), “Afrique au sud du sahara:quelle stratégie de transition fiscale? ”,
Afrique contemporaine(1), 133–163.
Crivelli, E., de Mooij, R., & Keen, M. (2016), “Base erosion, profit shifting and developing countries”, FinanzArchiv: Public Finance Analysis, 72 (3), 268-301.
Diarra, S. (2012), “Chocs et mobilisation des recettes publiques dans les pays en développement”, Doctoral dissertation, Université d’Auvergne-Clermont-Ferrand I, tel-00777227
Ellul, A., Jappelli, T., Pagano, M., & Panunz, F. (2015), “Transparency, tax pressure, and access to finance” Review of Finance, 20, 37 -76.
Feige, E. L. (2007), The underground economies: Tax evasion and information distortion, University of Wisconsin, Madison: Cambridge University Press.
Fu, J.-R., Farn, C.-K., & Chao, W.-P. (2006), “Acceptance of electronic tax filing: A study of taxpayer intentions”, Information & Management, 43 (1), 109–126.
Fuest, C., Hebous, S., & Riedel, N. (2011), “International debt shifting and multinational firms in developing economies”, Economics letters, 113 (2), 135–138.
Fuest, C., & Riedel, N. (2010), “Tax evasion and tax avoidance in developing countries: The role of international profit shifting”, Working Papers 1012, Oxford University Centre for Business
Taxation.
Gilbert, S., & Ilievski, B. (2016), “Banks, development, and tax”, The Quarterly Review of
Economics and Finance, 61, 1 - 13.
Gnangnon, S. K., & Brun, J.-F. (2017), “Impact of export upgrading on tax revenue in developing and high-income countries”, Oxford Development Studies, 45 (4), 542-561.
Gnangnon, S. K., & Brun, J.-F. (2018), “Impact of bridging the internet gap on public revenue mobilization”, Information Economics and Policy, 43, 23–33.
Gordon, R., & Li, W. (2009), “Tax structures in developing countries: Many puzzles and a possible explanation”, Journal of Public Economics, 93 (7), 855 - 866.