Coincidence Detection in the Cochlear Nucleus:
Implications for the Coding of Pitch
by Grace I. Wang
B.S. Electrical Engineering, University of Illinois, Urbana-Champaign, 2005 S.M. Electrical Engineering, Massachusetts Institute of Technology, 2007 Submitted to the Department of Electrical Engineering and Computer Science
in partial fulfillment of the requirements for the degree of
MASSACHUSETTS INSTITUTM7
DOCTOR OF PHILOSOPHY OF TECHNOLO v
at the
JUN 17 2011
MASSACHUSETTS INSTITUTE OF TECHNOLOGY
LIBRARIES
June 2011
ARCHVS
C 2011 Grace I. Wang. All rights reserved.
The author hereby grants to MIT permission to reproduce and to distribute publicly paper and electronic copies of this thesis document in whole or in part in any medium now
known or hereafter created.
Signature of author:
...D...of ... El c ri a ; neering and Computer Science
May 19, 2011
Certified by:
Bertrand Delgutte, Ph.D. PIfessor of Otology and Laryngology, Harvard Medical School Thesis Supervisor Accepted by:
....
..
...
..
.
...
~...
...
...
Chi le A. Kolodziejski, Ph.D. Chair of the Committee on Graduate Students
Coincidence Detection in the Cochlear Nucleus: Implications for the Coding of Pitch
By
Grace I. Wang
B.S. Electrical Engineering, University of Illinois, Urbana-Champaign, 2005 S.M. Electrical Engineering, Massachusetts Institute of Technology, 2007 Submitted to the Department of Electrical Engineering and Computer Science
in partial fulfillment of the requirements for the degree of Doctor of Philosophy in Electrical Engineering and Computer Science
at the MASSACHUSETTS INSTITUTE OF TECHNOLOGY
Abstract
The spatio-temporal pattern in the auditory nerve (AN), i.e. the temporal pattern of AN fiber activity across the tonotopic axis, provides cues to important features in sounds such as pitch, loudness, and spatial location. These spatio-temporal cues may be extracted by central neurons in the cochlear nucleus (CN) that receive inputs from AN fibers innervating different cochlear regions and are sensitive to their relative timing. One possible mechanism for this extraction is cross-frequency coincidence detection (CD), in which a central neuron converts the degree of cross-frequency coincidence in the AN into a rate response by preferentially firing when its AN inputs across the tonotopic axis discharge in synchrony.
We implemented a CD model receiving AN inputs from varying extents of the tonotopic axis, and compared responses of model CD cells with those of single units recorded in the CN of the anesthetized cat. We used Huffman stimuli, which have flat magnitude spectra and a single phase transition, to systematically manipulate the relative timing across AN fibers and to evaluate the sensitivity of model CD cells and CN units to the spatio-temporal pattern of AN discharges. Using a maximum likelihood approach, we found that certain unit types (primary-like-with-notch and some phase lockers) had responses consistent with cross-frequency CD cell. Some of these CN units provide input to neurons in a binaural circuit that process cues for sound localization and are sensitive to interaural level differences. A possible functional role of a cross-frequency CD mechanism in the CN is to increase the dynamic range of these binaural neurons.
However, many other CN units had responses more consistent with AN fibers than with CD cells.
We hypothesized that CN units resembling cross-frequency CD cells (as determined by their responses to Huffman stimuli) would convert spatio-temporal cues to pitch in the AN into rate cues that are robust with level. We found that, in response to harmonic complex tones, cross-frequency CD cells and some CN units (primary-like-with-notch
and choppers) maintained robust rate cues at high levels compared to AN fibers, suggesting that at least some CN neurons extend the dynamic range of rate representations of pitch beyond that found in AN fibers. However, there was no obvious correlation between robust rate cues in individual CN units and similarity to cross-frequency CD cells as determined by responses to Huffman stimuli. It is likely that a model including more realistic inputs, membrane channels, and spiking mechanism, or other mechanisms such as lateral inhibition or spatial and temporal summation over spatially distributed inputs would provide insight into the neural mechanisms that give rise to the robust rate cues observed in some CN units.
Thesis Supervisor:
Acknowledgments
First and foremost, I owe my deepest gratitude to my advisor Bertrand for his invaluable assistance, support, and guidance. His attention to detail and eagerness to learn have set an example I hope to match someday.
I would like to also thank my thesis committee members Denny Freeman, John Guinan, and Al Oppenheim for sharing their expertise and steering me in the right direction. This thesis would not have been possible without software help from Ken Hancock, expert surgical preparations from Connie Miller, and the friendship and support of the members of the Eaton Peabody Laboratory (EPL), especially fellow iglooers Yoojin Chung, Mitch Day, Sasha Devore, Nik Francis, Wendy Gu, Harrison Lin, SR Prakash, Michael Slama, and Bo Wen.
Finally, I am extremely grateful to my parents, my brother Nick, and my sister Rita for their love, and to John for helping me to look forward to tomorrow.
Table of Contents
Abstract ... 3
Acknowledgements...5
CHAPTER 1. General Introduction.. ... 9
CHAPTER 2. Responses of Auditory Nerve Fibers to All-Pass Stimuli with Phase M anipulations ... 23
Introduction... 24
M ethods... 27
R esults ... 3 5 D iscussion ... 58
CHAPTER 3. Spatio-Temporal Sensitivity of Cochlear Nucleus Neurons to Auditory N erve A ctivity ... 65 Introduction... 66 M ethods... 69 R esults... . 78 D iscussion ... 99 A pp end ix ... 110
CHAPTER 4. Rate Representations of Pitch in Model Coincidence Detector and C ochlear N ucleus Cells...113
Introduction ... 114
M ethods...117
R esults ... 12 5 D iscussion ... 146
CHAPTER 5. General Conclusions and Discussion...157
CHAPTER 1
General Introduction
As sound enters the inner ear, the cochlea performs mechanical frequency analysis that maps frequency to place along the cochlear axis. In response to a low frequency pure tone (<5 kHz), peripheral auditory fibers in the auditory nerve tend to fire at a specific phase of the stimulus, a phenomenon called phase locking. The temporal pattern of activity across the population of these fibers, or the spatio-temporal pattern of discharges, ("spatio" from the tonotopic map, and "temporal" from phase locking) contains cues to important features in sounds, such as loudness, pitch, and spatial location. It is currently unclear how central neurons make use of these spatio-temporal cues at the periphery. One possible mechanism to extract these cues is cross-frequency coincidence detection (CD), in which a central neuron preferentially fires when its fiber inputs across the tonotopic axis discharge in synchrony, essentially converting the peripheral spatio-temporal cues into a rate response. This thesis seeks to understand whether central neurons perform a cross-frequency CD operation, and if so, what implications this would have for the neural mechanisms responsible for pitch extraction.
Peripheral Auditory Processing
The inner ear breaks up the wideband acoustic signals into a series of narrowband signals that are converted into electrical signals by hair cells. The auditory filters of the cochlea
consist of overlapping band-pass filters that are tonotopically mapped (Greenwood 1961, 1990). This frequency-to-place mapping of the basilar membrane is due to variation in its stiffness along the length of the cochlea. Its narrow and stiff base vibrates maximally for high frequencies, whereas its wider and more compliant apex is most responsive for low frequencies (von Bekesy 1960).
A healthy cat cochlea contains approximately 2600 inner hair cells (Retzius 1884), each of which is innervated by about 20 auditory nerve (AN) fibers. The tonotopically arranged inner hair cells transduce their mechanical inputs (from the vibration of the basilar membrane) into electrical outputs (to generate action potentials in AN fibers) and do so maximally near places of mechanical resonance along the basilar membrane (Pickles 1988). Each fiber has a frequency selectivity that is similar to the mechanical selectivity of the point that it innervates along the basilar membrane, and consequently each fiber is tuned to a particular characteristic frequency (CF). The frequency-to-place map in the cochlea is the foundation for a place code for frequency maintained up to the primary auditory cortex (Al).
AN fibers tend to phase lock to a specific phase of a low frequency pure tone stimulus. Due to limitations presented by the mechanics of the inner hair cells and their synapses, phase locking breaks down for frequencies above 4 to 5 kHz in cat (Johnson 1980, Palmer and Russell 1986). For low frequency tones, phase locking is the foundation for a temporal code for sound frequency.
While the frequency information of the stimulus is coded in AN fibers with either a place code, a temporal code, or a combination of both, information regarding the level of the stimulus may be found in the fiber firing rates. Fibers with high spontaneous
activity have low thresholds and narrow dynamic ranges, but low spontaneous rate (SR) fibers have higher thresholds and are able to provide useful level information over a wider range (Liberman 1978, Evans and Palmer 1980). However every fiber (even with low SR) still has a limited dynamic range compared to that associated with normal perceptual hearing. Information containing the intensity of the stimulus may be coded in fibers with different thresholds at different levels or in spatio-temporal patterns.
Pitch
A harmonic complex tone consists of sinusoidal sounds at frequencies which are all
integer multiples of a common fundamental frequency (FO), corresponding to the pitch of the complex tone. Pitch is a subjective percept of a sound that allows ordering from low to high on a frequency scale. Many natural sounds such as human speech, animal vocalizations, and the sounds of most musical instruments contain harmonic complex tones, which evoke a strong pitch sensation at their fundamental frequency. Pitch plays a functional role in speech, such as for speaker identification (Nolan 2002), portrayal of emotions, and lexical distinctions in tonal languages (Cutler and Chen 1997). Differences in pitch can serve as cues for sound source segregation (Scheffers 1979, Assmann and Summerfield 1990). The pitch evoked by a harmonic complex tone is usually the same as the pitch of a pure tone at FO, even when the complex tone component at FO is not physically present in the stimulus (Schouten 1940). This phenomenon, known as the "pitch of the missing fundamental," occurs for FOs up to 1400 Hz (Moore 1973b), though more recent data show that the phenomenon may also occur at higher frequencies (Oxenham et al. 2011). In addition to humans, the phenomenon of the
pitch of the missing fundamental has also been shown to occur in cats (Heffner and Whitfield 1976).
Consecutive components of a harmonic complex tone are said to be "resolved" when their frequencies are spaced far enough apart so they fall in the pass bands of different auditory filters. When two or more harmonics fall within the pass band of a single filter, they are said to be "unresolved." Because the bandwidths of the cochlear filters increase with increasing center frequency (Kiang et al. 1965a, Shera et al. 2002), low order harmonics are better resolved than high order harmonics. Psychophysical studies have shown that humans are able to resolve the first 6-10 harmonics (Bernstein and Oxenham 2003, Plomp 1964). A stimulus containing resolved harmonics elicits a stronger pitch percept than one consisting entirely of unresolved harmonics (Carlyon
1998, Bernstein and Oxenham 2005). Pitch perception degrades in both hearing impaired listeners (Bernstein 2006) and cochlear implant users (Moore and Carlyon 2005), prompting the question of what physiological mechanisms account for these degradations. Though pitch phenomena have been studied fairly extensively psychophysically and many theories for its coding have been proposed, the neural mechanisms for its extraction are still poorly understood.
The peripheral auditory system generates essentially two types of cues to the pitch of harmonic complex tones. The first is a spatial cue that depends on the frequency-to-place mapping and frequency selectivity in the cochlea. The second cue generated by the peripheral auditory system is a temporal cue that depends on neural phase locking to the waveform periodicity. Traditional neural models to estimate the pitch of a stimulus have typically relied on either purely spatial or purely temporal representations. However,
neither type of model is adequate to account for all of the observed psychophysical phenomena.
One way to derive pitch is to determine the frequencies of individual components and then select a "best-fitting" FO from internally stored harmonic templates. The rate-place profile of AN fibers (the discharge rate plotted as a function of CF) has local maxima at frequencies corresponding to resolved harmonics. Thus, an advantage of rate-place models is that they depend on harmonic resolvability for pitch estimates. However, at high stimulus levels, these models predict a degraded pitch due to firing rate saturation (Cedolin and Delgutte 2010), while pitch discrimination performance remains relatively robust (Bernstein and Oxenham 2005). Furthermore, high CF fibers have relatively high Q-factors (CF/bandwidth) compared to low CF fibers, such that rate-place models predict better pitch strength at higher CFs, which is inconsistent with the traditional upper limit of the "pitch of the missing fundamental."
Models based on temporal representations predict robust pitch with level and are also able to predict the upper frequency limit of the "pitch of the missing fundamental" due to the degradation of phase locking at higher CFs. Despite these consistencies with psychophysical studies, weaknesses of the temporal models include failing to predict stronger pitch for resolved harmonics and underestimating the pitch strength of pure tones. Moreover, the temporal models require long neural delay lines or intrinsic oscillators, for which there is little physiological evidence. Finally, users of cochlear implants, who have poor frequency selectivity and likely receive mostly temporal cues to pitch, tend to perform poorly with pitch tasks.
The marmoset auditory cortex contains neurons near the anterolateral border of Al that respond selectively to pitch stimuli and show responses consistent with the psychophysical properties of pitch (Bendor and Wang 2005, 2010). This location is consistent with a pitch selective area found in humans (Penagos et al. 2004). Specifically, these so-called "pitch neurons" respond to stimuli that have the same FO but different spectra, such as pure tones and harmonic complex tones with missing fundamental. In addition, these neurons also show increased discharge rates in response to stimuli with increasing pitch salience. These findings suggest that separate spatial and temporal pitch processing mechanisms may converge in or prior to the auditory cortex.
Convincing biological data are needed to either confirm or refute the spatial or temporal models. Recently Cedolin and Delgutte (2010) gave physiological evidence for a spatio-temporal representation of the pitch of harmonic complex tones with missing FOs in the cat AN. The cochlear traveling wave for a pure tone stimulus slows down considerably at the place of resonance along the basilar membrane and thus has rapid phase accumulation around this location (Pfeiffer and Molnar 1970, Pfeiffer and Kim 1975, Lyon and Shamma 1996, Shamma 1985a). For low-CF, phase locking AN fibers, this phase change is reflected in the relative timing of AN spikes at different cochlear locations and generates a spatio-temporal cue to the frequency of the pure tone. In principle, this cue could be extracted by central neurons that receive inputs from neighboring cochlear locations and are sensitive to the relative timing of these inputs (Shamma 1985b). These central neurons could then provide inputs to a harmonic template mechanism.
Unlike the rate representations for pitch, which degrade with level, the spatio-temporal representation for pitch remained relatively robust with level, which is more consistent with the psychophysical observation that pitch strength does not degrade with increases in level. Moreover, the spatio-temporal representation depends on neural phase locking and is weak for higher CF fibers where phase locking is poor. This is consistent with the existence of an upper limit for the pitch of a complex tone with missing FO. The spatio-temporal representation is thus consistent with key trends in human psychophysics of pitch. By requiring the presence of both phase locking and resolved harmonics, the
spatio-temporal representation of pitch in the AN combines the advantages of the two traditional temporal and spectral theories while overcoming some of their limitations (Cedolin and Delgutte 2010). However, it is not known whether higher level processes in the brain are making use of these spatio-temporal cues. It is possible that they are extracted by central neurons sensitive to the relative timing of spikes from AN fibers innervating neighboring regions of the cochlea. A promising site for exploring this idea is in the cochlear nucleus (CN), where some neurons display the desired spectral and temporal characteristics.
Cochlear Nucleus Cell Types
All AN fibers convey information about the acoustic stimulus encoded in their firing patterns directly to neurons in the CN, which is the first site of neural computation along the ascending central auditory pathway. Each of the three subdivisions of the CN (antero-ventral CN (AVCN), postero-ventral CN (PVCN), and dorsal CN (DCN)) contains distinct cell types, differing in morphologies, synaptic inputs, membrane channels, cytochemistry, and output projections. In addition, AN fiber endings in the CN
have a wide variety of sizes and shapes ranging from small bouton endings to large endbulbs (Kane 1973, Ryugo and Sento 1991).
Extensive work has been done to understand the physiological mechanisms and anatomical structures of cells in the CN, and studies have correlated single unit response types with morphological characteristics (Rhode et al. 1983ab, Bourk 1976, Blackburn and Sachs 1989, Young et al. 1988, Osen 1969). A widely used approach to the classification of CN units is based on the shape of the post-stimulus-time histogram (PSTH) in response to short tone bursts at CF (STBCF) (Kiang et al. 1965b, Pfeiffer
1966).
Spherical bushy cells are located in the anterior part of the AVCN (Osen 1969, Cant and Morest 1979). Their AN inputs end in large endbulb synapses (only a few inputs per cell), which result in nearly one-to-one synaptic transmission with short response latencies. Responses to STBCFs of spherical bushy cells typically resemble those of AN fibers and are thus called primary-like, characterized by a high discharge rate at the stimulus onset, followed by a gradual decrease to a steady rate during the remainder of the tone burst.
Globular bushy cells predominantly appear in the posterior part of the AVCN and anterior part of the PVCN (Osen 1969, Tolbert and Morest 1982a). On average, 15-23 (Spirou et al. 2005) AN inputs converge onto the soma of each globular bushy cell in the form of small endbulbs (Liberman 1991, Brawer and Morest 1975, Osen 1969, 1970, Smith and Rhode 1987, Tolbert and Morest 1982ab). These cells fire in response to STBCFs with a primary-like-with-notch pattern, which is characterized by a high onset peak, followed by a short notch of little to no activity for 0.5 to 2 ms, and finally a
sustained response throughout the remainder of the tone. If globular bushy cells behave as coincidence detectors (CD), the high onset response could indicate a high probability that many of the cells' inputs are firing at the stimulus onset. A refractory period property prohibits action potentials from firing within around 0.7 ms of one another and could cause the notch of no activity following the onset.
Octopus cells are found in the caudal region of the PVCN and receive many small bouton endings from many AN fibers (Kane 1973). These cells are usually associated with an onset pattern in response to STBCFs, characterized by a short latency, sharply timed response at the beginning of the stimulus followed by little to no activity throughout the remainder of the tone burst. Subcategories of onset cells exist, and there is likely a continuum between these and primary-like-with-notch units. CD has been proposed to explain the onset responses of octopus cells (Oertel et al. 2000).
Stellate cells are located throughout the CN but tend to be more concentrated in the posterior part of the AVCN and the PVCN (Osen 1969, Rhode et al. 1983b, Smith and Rhode 1989). Stellates receive many AN inputs in the form of small bouton endings terminated at some distance from the soma and are likely to receive spatially distributed inputs from many AN fibers. In contrast with the irregular AN firing pattern, stellate cells respond to STBCFs with chopping patterns featuring high discharge regularity (Cant 1981, Tolbert and Morest 1982ab, Rhode et al. 1983b). Choppers can be further categorized as transient choppers, which fire regularly only at the beginning of the tone, and sustained choppers, which fire regularly throughout the duration of the tone burst. These cells might perform temporal integration, in which AN input activity is accumulated across the many inputs and over time (Wu and Oertel 1984). When
threshold is reached, the neuron fires and the membrane potential resets to its resting value (van Gisbergen et al. 1975). This summation has been shown to produce regular output patterns for irregular input patterns (Molnar and Pfeiffer 1968).
Pyramidal or fusiform cells are predominantly found in the DCN (Rhode et al. 1983a). In anesthetized preparations, these cells are associated with pauser (onset response followed by long pause (5-10 ms) and gradual buildup of firing) or build-up (like pauser but without onset response) patterns in response to STBCFs. Pyramidal cells have inhibitory as well as excitatory inputs (Zhang and Oertel 1993, Young 1984, Oertel and Young 2004). Anesthesia strongly influences the response patterns of DCN cells (Anderson and Young 2004), while there is little such evidence in the VCN (May et al. 1998). The effects of anesthetic state complicate the interpretation of DCN cell responses and make them more difficult to model. Furthermore, these cells tend to poorly phase lock to the fine structure, indicating that they may not be sensitive to spatio-temporal cues in the AN. For these reasons, the target of this thesis is to study responses of VCN cells, so pauser and build-up units were not examined in detail.
While most CN units can be classified into one of these ideal groups, there also exist other response types that do not belong to any of the categories described above. These "unusual" units can display characteristics not found in typical units, such as long latencies or complicated onset responses.
Spatio-Temporal Processing
In order to extract the spatio-temporal pitch cues present in the AN, central neurons would first need to receive inputs from AN fibers tuned to different frequencies. In
though the details of this relationship are currently unclear. One possibility is cross-frequency coincidence detection (CD), in which a neuron would fire more when its AN inputs (across different CFs) discharge in synchrony and less when there are spatio-temporal discontinuities.
It is generally accepted that the binaural auditory system uses CD to compare the timing between the two ears to encode interaural time differences, a major cue to sound localization (Jeffress 1948). Models for binaural processing have relied heavily on a CD mechanism (Colburn 1996), and physiological studies provide strong evidence for binaural CD in a variety of mammalian species, including dog (Goldberg and Brown 1969), cat (Yin and Chan 1990, Rose et al. 1966), rabbit (Batra et al. 1997), gerbil (Spitzer and Semple 1995), and kangaroo rat (Moushegian et al. 1975).
While much work has been done to investigate the role of CD in binaural processing, less is known about the possible role of monaural CD. Previous work in monaural cross-frequency CD has focused on the coding of sound level. Normal hearing human listeners can discriminate small changes in sound level (~1 dB) over a huge range of 0-120 dB SPL (Florentine et al. 1987). However, the firing rates of AN fibers typically only change over a relatively narrow range (-35 dB). This discrepancy between behavioral performance and neurophysiology is known as the dynamic range problem (Evans 1981, Viemeister 1988ab). A mechanism that might at least partially explain this discrepancy is monaural cross-frequency CD, which would extend the neural dynamic range by using the temporal information across AN fibers with different CFs (Carney 1994). This mechanism has been shown to give robust performance across a wide range of sound level that is consistent with psychophysical observations (Heinz et al. 2001).
Some CN neurons have responses consistent with monaural cross-frequency CD, as indicated by sensitivity to changes in stimulus phase (Carney 1990) and enhanced synchronization to low-CF tones (Joris et al. 1994ab).
The aim of this thesis is to assess the sensitivity of CN neurons to the spatio-temporal pattern of their AN inputs and to evaluate the implications of this processing on the coding of pitch. Using standard single-unit electrophysiological recording techniques, we first determine whether individual CN units resemble cross-frequency CDs. We then examine responses of these units to harmonic complex tones to evaluate whether cross-frequency coincidence in the CN leads to extraction of spatio-temporal pitch cues. We find that there is a small subset of CN neurons that have responses consistent with model CD cells. Another subset of CN neurons has robust rate representations of pitch at high levels, though the two subsets are mostly non-overlapping. Thus, our method for determining whether individual units perform a cross-frequency CD mechanism ultimately could not predict robust rate cues in response to harmonic complex tones.
To measure spatio-temporal sensitivity, we use complex all-pass transient stimuli called Huffman sequences, designed to systematically manipulate the timing of AN fibers at neighboring cochlear locations without drastically changing their overall discharge rates (Carney 1990). If a CN unit receives inputs from AN fibers across different CFs and is sensitive to the relative timing of these inputs, it should respond differently to Huffman stimuli differing in their phase pattern. In Chapter 2, we compare responses of model AN fibers (Zilany and Bruce 2006) and real fibers recorded from the anesthetized cat to Huffman sequences. As expected, manipulating the phase pattern in the Huffman
sequences results in systematic changes to the AN's spatio-temporal pattern in both model and real fibers while changes in firing rate are minimal. In Chapters 3 and 4, we characterize responses to Huffman sequences and pitch stimuli, respectively, of cross-frequency CD model cells operating on AN activity from varying extents of the tonotopic axis for comparison with responses of single CN units. Using a maximum likelihood approach, we find that primary-like-with-notch (Pri-N) units in the CN have responses to Huffman sequences that are consistent with a cross-frequency CD mechanism operating on AN activity. In response to pitch stimuli, the firing rates of AN fibers tend to saturate at high levels, thus degrading the rate representation of pitch. In contrast, we find robust rate cues to pitch in model CD cells as well as in CN Pri-N and chopper units at high levels. However, it is unclear whether the robust rate cues found in some CN units arise from a CD mechanism because there was no clear correlation between a CN unit's rate robustness and resemblance to model CD cells as determined by responses to Huffman stimuli. It is possible that the CD model used in this work is too simple to capture the complex circuitry in the CN. It is also possible that other mechanisms that extract spatio-temporal cues are present in CN neurons, such as lateral inhibition or spatial and temporal summation over spatially distributed inputs. Regardless of whether a CD mechanism gives rise to the these CN responses, our finding that some CN units maintain robust rate representations of pitch at high levels is relevant for understanding how pitch is encoded in the neural pathways.
CHAPTER 2
Responses of Auditory Nerve Fibers to
All-Pass Stimuli with Phase Manipulations
Abstract
The spatio-temporal pattern in the auditory nerve (AN), or the temporal pattern of activity across AN fibers tuned to different frequencies, contains cues to important features in sounds, such as pitch, loudness, and spatial location. In order to evaluate whether central neurons extract these spatio-temporal cues, we must first find a stimulus that systematically manipulates the temporal pattern across AN fibers without changing their discharge rates.
Huffman sequences have flat magnitude spectra and a 2a phase transition, and have been previously used to manipulate the relative timing of spikes across neighboring AN fibers (Carney 1990). By comparing responses of model AN fibers (Zilany and Bruce 2006) with those of real fibers to Huffman sequences, we used scaling invariance to infer the true spatio-temporal pattern across an array of fibers with different CFs from the responses of a single fiber to stimuli with varying phase transition frequencies.
We found that a Huffman sequence with sharp phase transition resulted in small early responses when the transition frequency was near the fiber's CF. The early responses increased when the transition frequency was further from CF. For the later response peaks, a sharp transition Huffman stimulus excites more coincidentally across CF than a stimulus with a broad phase transition. This result was consistent across stimulus levels and transition frequencies, and held for both real fibers as well as model predictions. As expected, AN fibers showed little sensitivity to the phase transition bandwidth in that overall rate responses to broad and sharp transition stimuli were similar across the population. Overall, we verified that these stimuli can be used to systematically manipulate the spatio-temporal pattern in the AN without greatly changing their discharge rates.
Introduction
The spatio-temporal pattern in the auditory nerve (AN), i.e. the pattern of AN fiber activity across the tonotopic axis, provides cues to important features in natural sounds. For sounds that contain spectral peaks such as speech formants and harmonics, the cochlear traveling wave slows down at the corresponding points on the basilar membrane, producing rapid phase accumulation at these locations. These rapid phase shifts are represented as steep discontinuities in the spatio-temporal pattern of AN discharges (Shamma 1985b, Cedolin and Delgutte 2010) and may serve as cues to the frequencies of spectral peaks in sounds.
In principle, these phase cues can be extracted by a network of central neurons that receive AN inputs tuned to different characteristic frequencies (CFs) and are sensitive to their relative timing. One possible mechanism to extract these phase cues is a cross-frequency coincidence detector (CD) circuit, where a central neuron would prefer to fire when its AN inputs across CF discharge in synchrony. Our goal is to evaluate whether a cross-frequency CD mechanism exists in cochlear nucleus (CN) neurons by examining their responses to different manipulations of the AN spatio-temporal pattern.
In order to evaluate the spatio-temporal sensitivity of central neurons, we must first find a stimulus that manipulates the spatio-temporal pattern in the AN without drastically varying the pattern of discharge rate across CF. Complex stimuli have previously been used to manipulate the relative timing across low-CF AN fibers (Carney 1990). "Huffman sequences" have a flat magnitude spectrum and a single phase transition at a transition frequency (FT), thus exciting all cochlear regions with nearly the same energy while controlling the frequency location of rapid phase shift (Huffman 1962,
Patterson and Green 1970, Patterson et al. 1969). In theory, varying the slope and frequency of the phase transition should systematically change the spatio-temporal pattern of AN fibers with CFs near FT with minimum changes in firing rates.
Carney (1990) compared responses of CN neurons and AN fibers to Huffman sequences to evaluate spatio-temporal sensitivity in the CN. She argued that a Huffman stimulus with a broader phase transition would excite AN fibers more coincidentally across CF than a stimulus with a sharper phase transition. For a linear time invariant system, the more gradual phase changes in a stimulus with a broad phase transition should introduce less group delay across adjacent frequencies and would produce more cross-CF synchrony at the output. However, we find that while the relative group delay introduced by the Huffman sequences affects the response envelope, the fine structure in the response pattern is affected by phase delays. Because a CD mechanism operates on a short time scale, the degree of find structure synchrony across CF matters much more than envelope synchrony. For these reasons, the fine structure of the AN spatio-temporal response patterns must be considered when interpreting the responses to Huffman stimuli. In this chapter, we compare responses of model AN fibers (Zilany and Bruce 2006) with real AN fibers to Huffman sequences. Both model fibers and real AN fibers showed similar systematic changes in their spatio-temporal response patterns to changes in the phase transition width of the Huffman sequence. We find that the fine structure in the responses of AN fibers to Huffman sequences are more complicated than previously thought, and depend on relative phase delays. In contrast to Carney's hypothesis, we find that it is the stimulus with the sharper phase transition that excites AN fibers more coincidentally across CF, especially for the late portion of the response. In the early
response, we find that the response to the sharp transition stimulus is small when FT is near CF, and increases as FT is moved further from CF, while the early response to the broad transition stimulus changes less. These results serve as a reference for interpreting responses of CD model neurons and CN neurons (Chapter 3).
Methods
Neurophysiology
The methods for recording from single fibers in the AN of anesthetized cats have been well established (Kiang et al. 1965a). We chose the anesthetized cat as our animal model to facilitate comparison to previous studies. Surgery and preparation are similar to those described by Cedolin and Delgutte (2010). Cats are anesthetized with Dial (75 mg/kg) or Nembutal (40 mg/kg) in urethane, with supplementary doses given to maintain an areflexic state. After removal of the posterior portion of the skull, the cerebellum is retracted to expose the AN. The tympanic bullae and middle-ear cavities are opened to expose the round window. Throughout the experiment the cat is given injections of dexamethasone (0.26 mg/kg) to prevent brain swelling and Ringer's solution (50 mL/day) to prevent dehydration.
The cat is placed on a vibration-isolated table in an electrically-shielded, sound-proof chamber. A silver electrode is positioned near the round window to record the AN compound action potential (CAP) in response to click stimuli in order to assess the condition and stability of cochlear function. At the beginning of each recording session, the CAP threshold to a click was typically near -60 dB re 1V. If the threshold increased by more than 10 dB from this value, the experiment was terminated.
Sound is delivered to the cat's ear through a closed acoustic assembly driven by an electrodynamic speaker (Realistic 40-1377). The acoustic system is calibrated to allow accurate control over the sound pressure level at the tympanic membrane. Stimuli are generated by a 24-bit digital-to-analog converter using a sampling rate of 20 kHz.
Stimuli are digitally filtered to compensate for the transfer characteristics of the acoustic system.
Action potentials are recorded with glass micropipettes filled with 2 M KCl. The electrode is inserted into the dorsal surface of the AN and mechanically advanced with a micropositioner (Kopf 650). The recorded signal is bandpass filtered (1-3 kHz) and input into a software spike detector. The signal is initially sampled at 100 kHz resolution. Then the times when the waveform crosses a user-set threshold are linearly interpolated, and spike times are saved for offline processing.
A click at -40 dBrelV is used to search for single units. Once a fiber is isolated, its frequency tuning curve is measured by a tracking algorithm (Kiang et al. 1970) to determine its CF and threshold at CF. The neuron's spontaneous activity is then measured over 20 seconds. The responses to Huffman sequences are then studied.
Auditory Nerve Model
Many attempts have been made to create computational models to mimic the behavior of AN fibers in the mammalian cochlea. We use one of the latest models in a chain of auditory peripheral models (Carney and Yin 1988, Carney 1993, Zhang et al. 2001, Bruce et al. 2003, Zilany and Bruce 2006, 2007, 2009) that have been built to be consistent with a wide range of physiological data in the cat. The model (Zilany and Bruce 2006) receives as input an arbitrary stimulus waveform, and outputs spike times across AN fibers with different CFs.
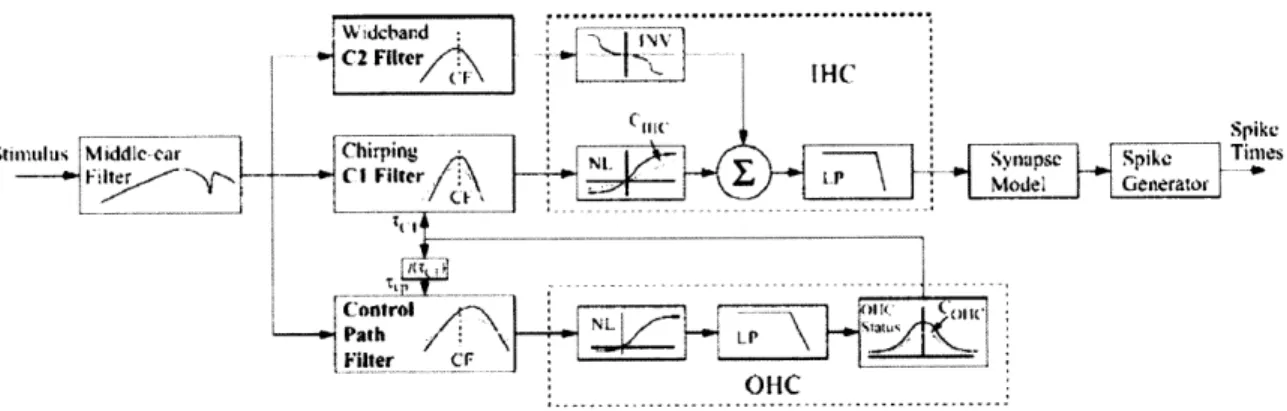
A block diagram of the model is shown in Figure 2.1. The model consists of a middle ear filter followed by three parallel pathways representing cochlear processing: component 1 and 2 (Cl and C2) signal paths and a wideband feed-forward control path
with level-dependent gain and bandwidth. The model distinguishes between two forms of excitation (Cl and C2) between basilar membrane motion and inner hair cell potential. Cl, which dominates at low levels, contains a narrowband chirp filter that accounts for the instantaneous frequency glides and best frequency shifts observed in physiological data (Tan and Carney 2003). C2 is more broadly tuned, dominates Cl at high levels, and is out of phase with Cl.
C2 Filter4,\ IHC
Snimul us M iddle car 1 hrpin - -napse Spike TimesSpikepk
Filter - Cl Filter LL I Miodea Generator
OHC
Control
Path : L
21I
Filter CF
OHiC
Figure 2.1: Block diagram of auditory nerve model (Zilany and Bruce 2006). See Methods for description.
The interactions between Cl and C2 (within the inner hair cell (IHC) block) simulate a nonlinear phenomenon called peak splitting (Kiang 1990), where AN responses show one peak per cycle for low frequency tones at low levels (phase locking), two or three smaller peaks per cycle at high levels, and at even higher levels, one peak per cycle 180' out of phase with the response at low levels. The control path represents the active cochlear processes and produces two-tone suppression (Ruggero et al. 1992), where the response to a near-CF tone is decreased in the presence of another tone.
The non-linear synapse model is a time-varying three store diffusion model (Westerman and Smith 1988), which sets the synapse gain between the IHC and the AN
fiber. Finally, the output of the synapse drives the spike generator, which produces spike times using a renewal process that includes refractoriness.
Discharge patterns across the population of model AN fibers will be used to test for spatio-temporal manipulation using Huffman sequences, and to interpret physiological AN responses.
Stimuli: Huffman Sequences
"Huffman sequences" (Huffman 1962, Patterson and Green 1970, Carlyon and Shamma 2003) have a flat magnitude spectrum and a single 271 phase transition centered at a transition frequency FT. To generate these stimuli, a unit sample was input into a digital filter with transfer function of the form
-1 -2 H(z)1 -aiz- +a2z 1-biz- +b2z 2 where 2cos0 1 27cFT
a1= , a2=- , b1=2rcos0 , b2=r2 , and 0= .
r r FS
FT is the transition frequency, and FS is the sampling rate (20 kHz).
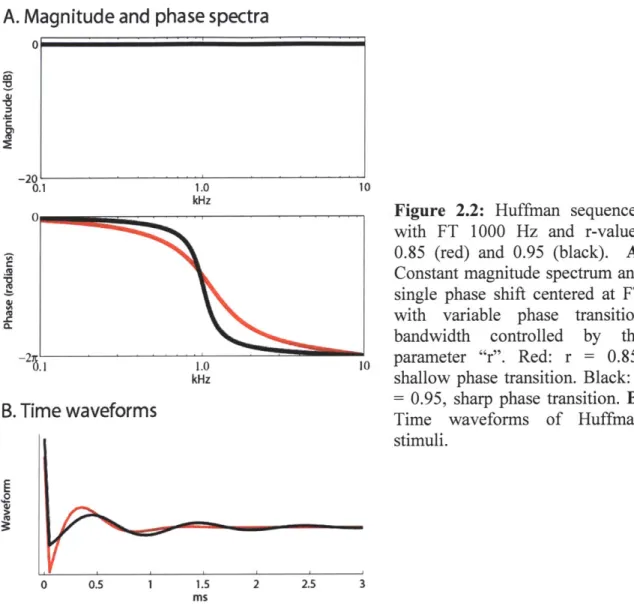
Huffman sequences have a set of conjugate pair poles within the unit circle and a set of corresponding conjugate pair zeros outside the unit circle. The parameter "r" is the distance from the origin to either pole and is inversely related to the phase transition bandwidth. Moving the poles and zeros closer to the unit circle results in a sharper phase transition and a longer group delay. This is illustrated in Figure 2.2A, which shows the magnitude and phase spectra of Huffman stimuli with sampling frequency 20 kHz and FT 1 kHz, and shows that a stimulus with a greater r-value (r=0.95, in black) has a sharper
A. Magnitude and phase spectra
0.1 1.0B. Time waveforms
E
0 10Figure 2.2: Huffman sequences with FT 1000 Hz and r-values 0.85 (red) and 0.95 (black). A. Constant magnitude spectrum and single phase shift centered at FT with variable phase transition bandwidth controlled by the
10 parameter "r". Red: r = 0.85, shallow phase transition. Black: r = 0.95, sharp phase transition. B.
Time waveforms of Huffman stimuli.
0 0.5 1 1.5 2 2.5 3
ms
phase transition than the stimulus with a smaller r-value (r=0.85, in red). The temporal waveforms of these two Huffman sequences are shown in Figure 2.2B.
Over the range of FT investigated, the -7r /2 to -37r/2 phase transition bandwidths are 1017 Hz (when r = 0.85, red) or 326 Hz (when r = 0.95, black). We also used an
r-value of 0.90, which had a phase transition bandwidth of 666 Hz (not shown). Carney (1990) used smaller FS (6-10 kHz) and also co-varied FS and FT to keep the number of samples per waveform fixed at 100. As a result, her stimuli had smaller bandwidths than ours for a given r (503 Hz vs.1017 Hz when r=0.85, 330 Hz vs.666 Hz when r=0.90, and
161 Hz vs.326 Hz when r=0.95). To facilitate comparison, we found the r-values that match her phase transition bandwidths for a 20 kHz stimulus (r=0.92, 0.95, and 0.98) and used these r-values in a subset of our fibers (28/143).
Our Huffman stimuli decayed to nearly zero within a few milliseconds, but at least a 30 ms inter-stimulus interval was used to ensure recovery between responses to successive stimuli. Stimulus level is defined in dB re the rms sound pressure over the 30 ms interval, thus underestimating the effective stimulus level in the temporal region where the stimulus has significant energy. If, rather than defining level over a fixed time interval, we had defined the level over the time interval that encompasses 99% of the energy of the stimulus waveform, this raised the stimulus level by roughly 15 dB.
For fibers with low spontaneous rates, the threshold level was found by listening for an audible response just above spontaneous activity from the electrode signal. For fibers with high spontaneous rates, a quick rate-level function was sometimes measured to find the threshold level. The stimulus levels were chosen to be near threshold and increased in 10 or 15 dB increments. At least 3 stimulus levels were presented for each fiber. Level was interleaved randomly across trials to minimize any effect of the order of sound levels in the stimulus presentation.
Each 300 ms trial consisted of a sequence of either 6 stimuli (3 ascending and 3 descending r-values (0.85, 0.9, 0.95, 0.95, 0.9, 0.85) with 50 ms inter-stimulus interval, or 10 stimuli (0.85, 0.9, 0.92, 0.95, 0.98, 0.98, 0.95, 0.92, 0.9, 0.85) with 30 ms inter-stimulus interval. Spike times from the same r-value inter-stimulus from the ascending and descending parts of the sequence were combined. This was done to minimize any possible effect of the order in which the stimuli were presented, though we observed no
systematic differences between the ascending and descending parts. Responses to these sequences were recorded for at least 100 trials (and typically between 200-300 trials) with no interruption.
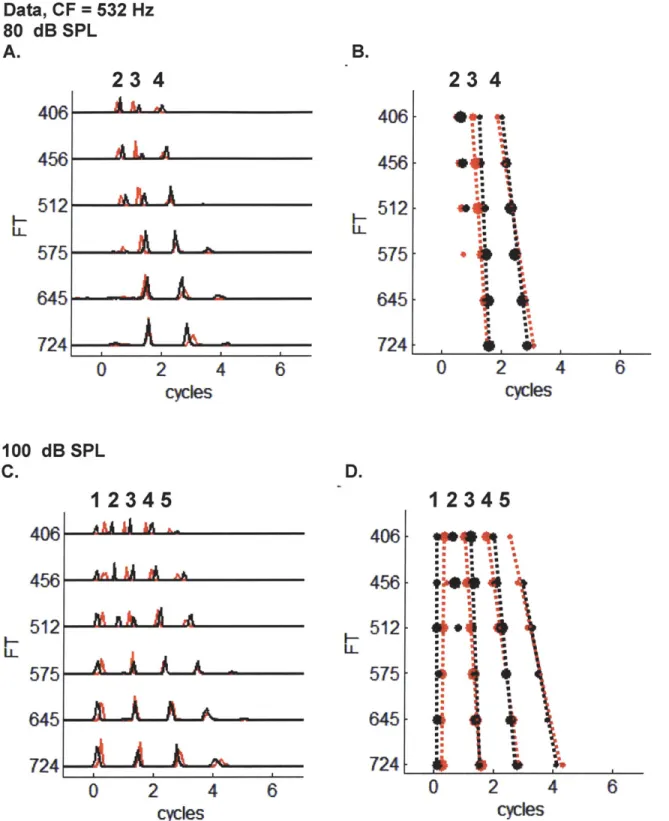
In all fibers (n=143), we measured responses to a Huffman stimulus in which FT was set at the CF of the fiber. In addition, for a subset of fibers (44/143), FT was varied from a half octave below CF to a half octave above CF in 1/6 octave steps. We used scaling invariance to infer responses of a population of AN fibers to a Huffman stimulus with fixed FT from responses of a single fiber to stimuli with varying FT (see Results for a detailed explanation).
Analysis
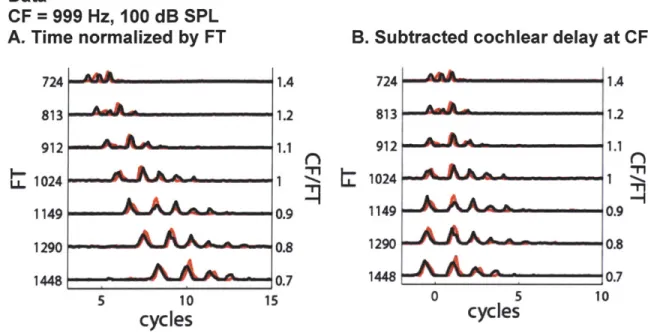
We compared "virtual" spatio-temporal patterns (from single real fiber responses to varying FT Huffman stimuli) with model virtual temporal patterns and true spatio-temporal patterns (from model fiber responses across CF to a fixed FT stimulus). Post stimulus time histograms (PSTHs) for each CF (or FT) were constructed (with bin width 0.1 ms) to build a (virtual) spatio-temporal pattern. Response peaks were found by detecting all local maxima in each PSTH that exceeded 5 standard deviations above baseline activity measured during the last 10 ms of each inter-stimulus interval (long after both stimulus and response had decayed). Examples of virtual spatio-temporal response patterns and their peaks are shown in Figures 2.7 and 2.9. These virtual spatio-temporal response patterns have had the non-scaling cochlear delay corresponding to the location of the CF (same delay in seconds across y-axes in Figures 2.7 and 2.9) subtracted from their x-axes. Then, the non-scaling cochlear delays corresponding to the locations of the
virtual CFs were added to each x-axis (different delay in seconds across virtual-CF axis in Figure 2.11 C).
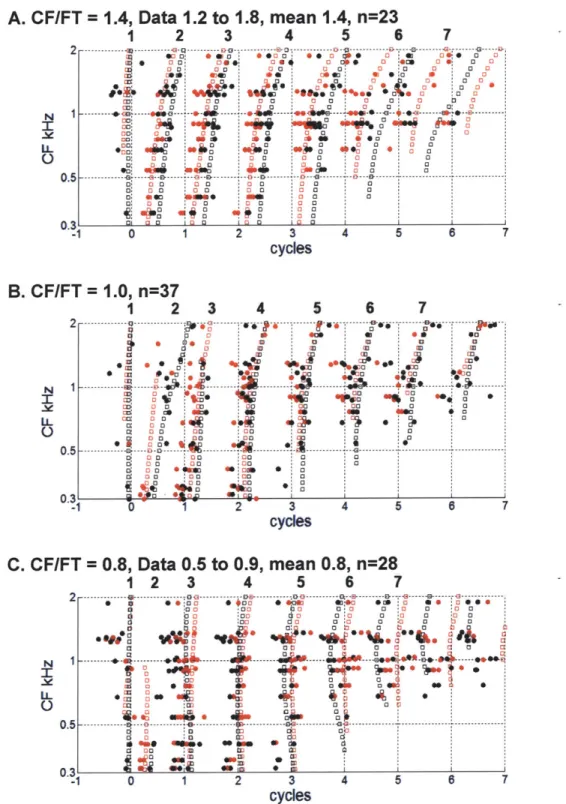
Sets of peaks across CF (or FT) were grouped together based on a matching algorithm that finds the most likely alignment, accounting for temporal offsets and warping. This is similar to the image registration problem in computer vision (Zitova and Flusser 2003). Specifically, for each pair of adjacent CFs (or FTs), the peak times for one were held fixed, while the peak times for the other were iterated over to find the most likely matching pairs between CF (or FT). This process was repeated until all adjacent pairs were aligned, and peaks were grouped into sets across CF (or FT). Peak sets were discarded if there were fewer than 3 peaks in the set, or if there was no peak in the set when FT was at CF, for either the broad or sharp phase transition stimulus. For real fiber responses, each peak set across FT was then assigned a number corresponding to the nearest model peak in time.
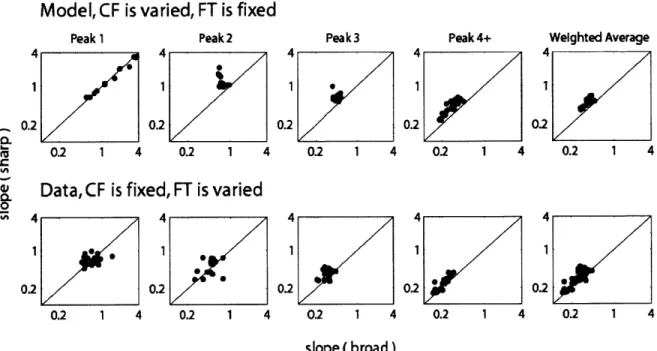
For each peak set across CF (or FT), line segments (at most 3 segments) were fit (least mean squares) to the peak locations. The slopes of these line segments (in frequency/time) quantify the degree of coincidence across CF (or FT) that each stimulus elicited (Figure 2.11 D). The slopes were then compared for different r-values to evaluate the relative degree of coincidence for each phase transition width (Figure 2.12).
Results
Model AN fiber responses to Huffman stimuli
General characteristics
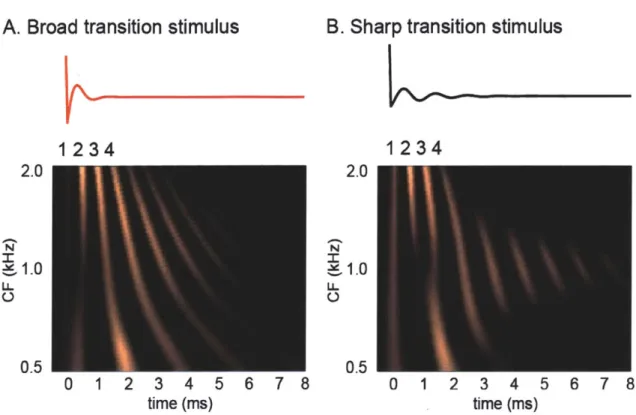
To test whether changing the slope of the phase transition of Huffman sequences manipulated the spatio-temporal pattern of discharges of the AN, we used an AN model (Zilany and Bruce 2006) to simulate the discharge patterns of a population of AN fibers. Figure 2.3 plots the response of an array of model fibers with varying CFs (500 to 2000 Hz with 1/25 octave spacing) to two Huffman sequences with different phase transition bandwidths: broad transition (r = 0.85) in panel A and sharp transition (r = 0.95) in panel B. The transition frequency (FT) was set to 1000 Hz, and the stimulus level was 60 dB SPL. In each plot, pixel intensity indicates the model neural response, i.e. the output of the inner hair cell synapse. The non-scaling cochlear delay (here defined as the time to the first peak in response to a 50 dB SPL condensation click stimulus) was subtracted for each CF (a different delay for each value on the y-axis) to facilitate comparison with normalized virtual spatio-temporal patterns described later.
The earliest peaks in response to Huffman sequences for both broad and sharp phase transitions line up nearly perfectly at time zero. Since the cochlear delay has been subtracted in the plot, this means that the first response peak to Huffman stimuli lines up with the first response peak to a click stimulus. Subsequent peaks in firing probability tend to occur at 1/CF intervals, as expected for a broadband stimulus such as a Huffman sequences. For example, the response patterns show 2 peaks per ms when CF is 2 kHz
and 1 peak every 2 ms when CF is 500 Hz. However, there are some slight deviations from this, especially in the response to the sharp transition stimulus.
A. Broad transition stimulus
B. Sharp transition stimulus
1234 1234 2.0 2.0 N N 1.0 1.0 0.5 0.5 0 1 2 3 4 5 6 7 8 0 1 2 3 4 5 6 7 8 time (ms) time (ms)
Figure 2.3: Array of model AN responses to two Huffman sequences with FT 1000 Hz at 60 dB SPL. The y-axis is the CF of the fibers, and the x-axis is time in ms. A. Broad phase transition (r = 0.85). B. Sharp phase transition (r = 0.95).
Effect of transition bandwidth
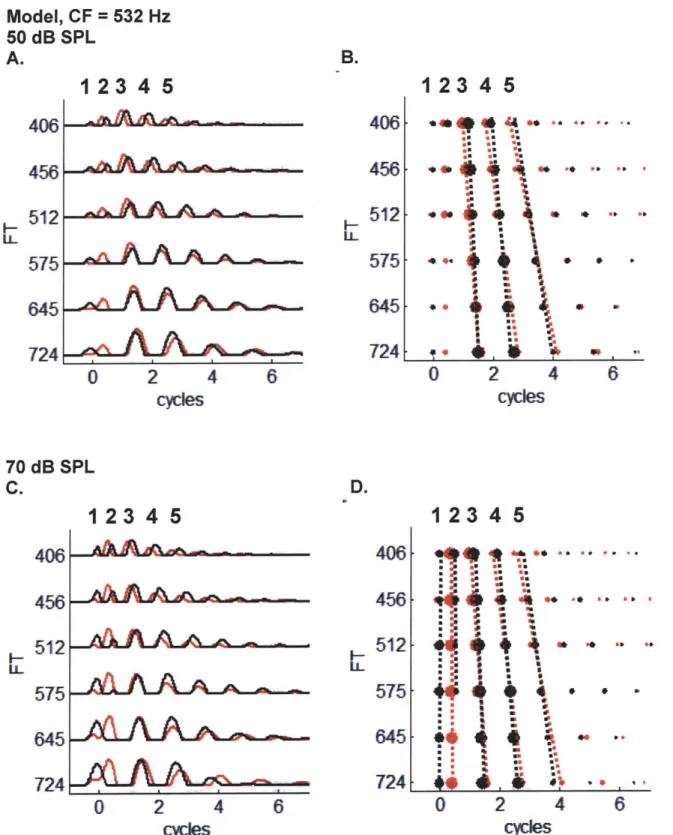
To quantify changes in the response patterns to the two transition widths, the patterns such as in Figure 2.3 were first reduced to their local maxima. Each panel in Figure 2.4 shows these maxima plotted together for the broad transition width in red and the sharp transition width in black. The relative area of each dot corresponds to the height of a local maximum in the response. Figure 2.4B shows the local maxima taken from the patterns in Figure 2.3 (at 60 dB SPL), while panel A shows the pattern at a lower stimulus level (40 dB SPL), and panel C shows the pattern at a higher level (80 dB SPL).
stimulus, FT = I kHz dB SPL 23456 time (ms) B. 60 dB SPL 12 3456 2.0 ra-EI -i N 1.0 0.5 time (ms) C. 80 dB SPL
1
2 3 4 2.0 lot 0 0.5 0 1 2 3 4 time (ms)Figure 2.4: A. Array of model AN responses to two Huffman sequences with fixed FT of 1000 Hz (broad phase transition in red, sharp phase transition in black). The y-axis is the CF and ranges from 0.5 (one octave below FT) to 2 kHz (one octave above FT). The x-axis is time normalized by FT. Level is 40 dB SPL. B. Same as in A, but at 60 dB SPL. C. Same as in A, but at 80 dB SPL. Fixed A. 40 2.0-N 1.0 U-0.5
-As level increases, the earlier peak heights increase while later peak heights decrease. For example, Peak 1 is not observed at 40 dB, has roughly the same size as later peaks at 60 dB, and is very prominent at 80 dB. On the other hand, Peak 4 is prominent at 40 and 60 dB, but is smaller than earlier peaks at 80 dB. Furthermore, the peak alignment across CF for both phase transition widths gets greater at higher levels, consistent with the widening of the cochlear filters.
Despite this level dependence, the pattern of differences in the relative response for the two transition widths remains the same across all three levels in Figure 2.4A-C. Peak 1, when it appears, is nearly vertical for both sharp and broad phase transitions, indicating nearly perfect cross-frequency coincidence. Peak 2 diverges for the two transition widths. As CF decreases away from 2 kHz, the red peaks (broader transition) occur earlier while the black peaks (sharper transition) occur later. Furthermore, the Peak 2 amplitude decreases for the sharp transition stimulus as CF decreases, and the peak ultimately disappears when the CF is below the FT of 1 kHz. For the broad transition stimulus, Peak 2 displays similar behavior as for the sharp transition stimulus at the lowest level, but at 60 dB, the broad transition peak does not disappear when CF is below FT. At 80 dB, the broad transition Peak 2 height very slightly decreases when CF is near FT, but increases again when CF is below FT.
For Peak 3, at 40 and 60 dB, the broad transition response remains fairly constant across CF, while the sharp transition response is larger when CF is away from FT and smaller when CF is near FT. The region of CFs for which the Peak 3 height to the sharp transition stimulus is smaller than that to the broad transition stimulus is narrower at 60 dB than it is at 40 dB. At 80 dB, the peak heights for both transition widths are roughly
constant across CF. The peak heights of Peaks 4 and later tend to be largest when CF is near FT. The heights of these late peaks when CF is away from FT for the sharp transition stimulus tend to be smaller than for the broad transition stimulus.
Peaks 3 and later all have approximately the same temporal relationship between the two transition widths across all levels. When CF is above FT, responses to the sharp transition stimulus occur slightly later than responses to the broad stimulus. As shown in Figure 2.2, for frequencies above FT, the sharp transition stimulus has a more negative
phase than the broad transition stimulus, resulting in an increased lag for the sharper phase transition at high frequencies. This trend reverses when CF is below FT, when sharp transition responses occur slightly earlier than broad responses, as a result of the decreased lag introduced with the sharper phase transition at low frequencies. Responses to the two stimuli only line up in time (have the same lag) when the FT is near the CF. As a result, the stimulus with sharp transition bandwidth excites more coincidentally across CF than the broad transition stimulus. These results are consistent with model AN responses in Carney's Figure 2 (1990) obtained from a simpler model (Carney and Yin 1988) that used linear cochlear filters (from revcor analysis) rather than the 3 path nonlinear model of Zilany and Bruce (2006).
Varying the r-value between and beyond the two values shown here (0.9, 0.92, and 0.98) also resulted in systematic and monotonic changes to the spatio-temporal pattern of the AN model (not shown).
Cochlear Scaling Invariance
To physiologically measure the response pattern to Huffman stimuli across an array of real AN fibers would be experimentally challenging because it would require finely and
60 dB SPL A. Fixed stimulus, FT = 1 kHz 12 3456 2.0 t NU a -. -. N 1.0 0 0.5 time (ms)
B. Fixed fiber, CF = 1 kHz, co-vary r and FT
1234 5 6
0.51
2M IL
-N X R 1.0 L. 2.0 time (ms)C. Fixed fiber, CF = 1 kHz, fixed r
123456
0.5 - .
2.
1.0
2.0 U
Figure 2.5: A. Array of model AN responses to two Huffman sequences with fixed FT of 1000 Hz (broad phase transition in red, sharp phase transition in black). The y-axis is the CF and ranges from 0.5 (one octave below FT) to 2 kHz (one octave above FT). The x-axis is time normalized by FT. Level is 40 dB SPL. B. Responses of a single model fiber with CF 1 kHz to Huffman stimuli scaled in time such that the r-value and FT co-vary. FT is shown on the y-axis and inverted. C. Responses of a single model fiber with CF 1 kHz to Huffman stimuli scaled such that the r-value is fixed, and FT varies.
uniformly sampling from AN fibers with differing CF. To get around this challenge, we apply the principle of local scaling invariance in cochlear mechanics (Zweig 1976), which states that in a completely invariant cochlea, the basilar membrane impulse
CF
response h(t, CF) at location CF and time t is the same as h(tpl, ), where 8 is an p8
arbitrary constant. This means that the shape of the impulse response h at location CF is the same as a time-scaled (by
P)
version of the response at a different cochlear locationCF
We define
P
as the ratio between the fiber CF and the FT of the Huffman stimulus. It then follows that the basilar membrane response at the cochlear location corresponding to the fiber's CF has the same shape as the basilar membrane response at the location corresponding to the stimulus FT. Furthermore, the two responses are scaled (in time byp)
versions of each other. Therefore, scaling the Huffman stimulus in time and recording the response at a fixed location allows us to infer the response to a fixed Huffman stimulus at differing cochlear locations. However, this principle only holds locally (Shera and Guinan 2003, van der Heijden and Joris 2006), and FT should be nearCF in order to apply scaling invariance.
In order to scale the Huffman stimuli in time, both the FT and the r-value (which sets the decay of the stimulus envelope) must be co-varied. For simplicity we only varied FT while keeping the r-value fixed in our recordings from real AN fibers. We use the AN model to address differences in the two scaling methods.
In Figure 2.5, we compare the response pattern of an array of model fibers (with different CFs) responding to a fixed FT stimulus (panel A, repeated from Figure 2.4B)
with the response patterns of a single model fiber responding to multiple Huffman stimuli. Panel B shows responses when the r-value and FT are co-varied, and panel C shows responses when only FT is varied. The y-axes in panels B and C have been inverted such that the normalized frequency (CF/FT) is the same as in panel A.
The patterns in all panels are very similar, and most of the description in the previous section for panel A (also Figure 2.4B) also describe panels B and C. Importantly, the relative changes in the response patterns to the different transition widths across all panels are the same, in that the earlier response peaks are more synchronous than the later peaks, and that the sharp transition stimulus excites more coincidentally across CF and FT for Peaks 3 and later.
However, there are some minor differences to note between the patterns. Peak 2 in panel A for the broad transition stimulus is small in height and is large in panel B. Furthermore, Peak 2 appears when CF is below FT in panels A and B but disappears completely in panel C for the same normalized frequency range. Furthermore, there are some differences in the way the peak height changes along the y-axis. For example, the height of Peak 1 decreases at lower CFs in panel A, but increases at higher FTs in panel C. Despite these differences, the nearly identical patterns across all three panels support the use of scaling invariance to infer the response of an array of fibers to a single Huffman stimulus from the response of a single fiber to Huffman stimuli scaled in time by either co-varying the r-value and FT, or by only varying FT.
To quantify the similarity between these patterns, we computed correlation coefficients between the two response patterns over a certain range of CF/FT. Correlations are shown as a function of frequency range (in octaves) in Figure 2.6 for
different stimulus levels. Not surprisingly when scaling invariance was rigorously applied (by co-varying the r-value and FT, shown in open circles), the correlation coefficients were better (ranging between 0.97 and 0.99) than when only the FT was varied (ranging between 0.94 and 0.99, shown in x symbols). The patterns are less correlated when a wider range of frequencies is considered, suggesting that the patterns
10
0 Figure 2.6: Correlation
coeff-0 icients between model patterns
for: x = varying CF (FT = 1000
0.95 --- 0 --- -- --- Hz) and varying FT (CF z n a y n T ( F = = 1 01000 Hz, r fixed), and o = varying CF
- d (FT = 1000 Hz) and co-varying 0 -<-40 dB FT and r (CF = 1000 Hz). -- 0 dB -0--80 dB 0.9 0.5 0.6 0.7 0.8 0.9 1
Frequency Range (octaves)
look less similar far from 1000 Hz than they do near 1000 Hz. This is consistent with the notion of the locality of scaling invariance, or that scaling invariance is only valid over a relatively narrow range of frequencies. Furthermore, the patterns are somewhat less correlated at high levels, possibly due to cochlear nonlinearities that may have different effects across the length of the cochlea at high sound levels. Despite these changes, the correlation between the patterns for both methods of scaling are high over the frequency range considered, justifying our approach in our experiments. The correlations were similarly high when the fixed frequency (CF for single fiber, or FT for fiber array) was varied from 250 Hz to 2500 Hz (not shown).