Publisher’s version / Version de l'éditeur:
Vous avez des questions? Nous pouvons vous aider. Pour communiquer directement avec un auteur, consultez la première page de la revue dans laquelle son article a été publié afin de trouver ses coordonnées. Si vous n’arrivez pas à les repérer, communiquez avec nous à PublicationsArchive-ArchivesPublications@nrc-cnrc.gc.ca.
Questions? Contact the NRC Publications Archive team at
PublicationsArchive-ArchivesPublications@nrc-cnrc.gc.ca. If you wish to email the authors directly, please see the first page of the publication for their contact information.
https://publications-cnrc.canada.ca/fra/droits
L’accès à ce site Web et l’utilisation de son contenu sont assujettis aux conditions présentées dans le site LISEZ CES CONDITIONS ATTENTIVEMENT AVANT D’UTILISER CE SITE WEB.
Journal of Materials Science, 21, 5, pp. 1533-1546, 1986-05
READ THESE TERMS AND CONDITIONS CAREFULLY BEFORE USING THIS WEBSITE.
https://nrc-publications.canada.ca/eng/copyright
NRC Publications Archive Record / Notice des Archives des publications du CNRC : https://nrc-publications.canada.ca/eng/view/object/?id=a91d6436-bc5a-4f3f-952a-4c29a2077c4a https://publications-cnrc.canada.ca/fra/voir/objet/?id=a91d6436-bc5a-4f3f-952a-4c29a2077c4a
NRC Publications Archive
Archives des publications du CNRC
This publication could be one of several versions: author’s original, accepted manuscript or the publisher’s version. / La version de cette publication peut être l’une des suivantes : la version prépublication de l’auteur, la version acceptée du manuscrit ou la version de l’éditeur.
Access and use of this website and the material on it are subject to the Terms and Conditions set forth at
Young arctic frazil sea ice: field and laboratory strength tests
Sinha, N. K.
8er
TH1
N21d
no.
1381
c. 2
BLDG
National Research
Conseil national
I
$
Council
Canada
de
recherches Canada
Institute for
lnstitut de
Research in
recherche en
Construction
construction
Young Arctic Fmzil Sea Ice:
Field and Laboratory Strength Tests
by N.K. Sinha
A N A L Y Z E D
Reprinted from
Journal of Materials Science
Volume 21, No. 5, May 1986
p. 1533
-
1546
(IRC Paper No. 1381)
Price $4.00
NRCC 25985
Ce document d6crit les mgthodes employ6es pour effectuer et
analyser des mesures de la rgsistance en compression uniaxiale
et de la dgformation, sur le terrain et en laboratoire, au
moyen d'un
appareil d'essais
classique et d'un
appareil
fonctionnant en boucle ferm6e; on y expose aussi les proc6dures
de prglzvement, d1exp6dition et de stockage des Qchantillons,
ainsi que les r6sultats d'gtudes microstructurales.
I1 est
possible d'obtenir, quel que soit l'endroit, des mesures
fiables de l'influence de la vitesse de mise en charge sur la
r6sistance et le module de d6formation de frasil conge16
provenant de glace jeune.
L'auteur pr6sente des donn6es
concernant le coefficient de Poisson, sa variation au cours des
essais et sa dgpendance 2 116gard de_-la
vitesse de mise en
J O U R N A L O F M A T E R I A L S S C I E N C E 2 1 ( 1 9 8 6 ) 1 5 3 3 - 1 5 4 6
Young Arctic frazil sea ice: field and laboratory
strength tests
N I R M A L - K . S l N H A
Geotechnical Section, Division of Building Research, National Research Council of Canada, Ottawa, Canada
Methods of conducting and analysing uniaxial compressive strength and deformation measurements in the field and in the laboratory by means of conventional and closed-loop controlled test machines, respectively, are described, plus procedures for sampling, shipping, storing specimens and microstructural studies. Reliable measurements of the rate sensitivity of strength and deformation modulus of young congealed frazil sea ice can be obtained irrespec- tive of location. Observations of Poisson's ratio, its variation during the tests, and its depen- dence on rate of loading are discussed.
1. Introduction
As a result of increasing activity in the Arctic and Antarctic, there is a growing requirement for infor- mation on the strength and deformation properties of various types of sea ice. Such properties are commonly determined using small specimens brought from the field to the laboratory. Although convenient, how- ever, this method presents a number of serious prob- lems, including how to ship and store the ice, how long it can be stored, and what effect storage has on the mechanical properties. Answers to some of these ques- tions can be found only by comparing results for freshly recovered specimens in the field and samples of the same ice tested in the laboratory.
Field tests impose severe physical limitations. There is a need, therefore, to develop reliable test methods for use in the field, and to improve and standardize test methods used in the laboratory, for example, the closed-loop controlled test. This paper describes an effort to examine some of these problems. Emphasis is placed on the rate sensitivity of uniaxial, unconfined compressive strength of young* congealed frazil sea ice. Until now there has been no information in the open literature on the strength and deformation of this type of sea ice.
Participation in the field programme of the Atmos- pheric Environment Service of Canada to determine the microwave properties of sea ice as part of a Radarsat Project offered an opportunity to conduct field tests at the High Arctic Weather Station at Mould Bay (Fig. I), Prince Patrick Island (76" 14'N, 119" 20'W). Tests were carried out in October 1981 using a conventional screw-driven test machine. Lab- oratory tests followed almost 15 months later, in January 1983 in Ottawa, using a closed-loop servo- hydraulic test system.
2. Ice characteristics
Mould Bay was covered with a uniform flat sheet of
new ice in October 1981 (Fig. 2). Microstructural examination at various observation stations along an east-west line established across the 7 km wide Bay near the weather station showed a predominantly columnar-grained structure, except for the ice cover near Station 2 about I km from the eastern shore. Here the ice sheet consisted almost entirely of con- gealed, frazil, slush-type ice. Large blocks through the full depth of the ice cover were obtained on 18 October 1981 using a chain-saw. The air temperature was
- 19" C. The blocks were brought to the base camp within an hour of sampling and were stored outside in the air, where for the next ten days, during which the physical tests were carried out, the mean daily air temperature fluctuated between - 20 and - 27" C [I].
Immediately on reaching the base camp, a vertical slice 20mm thick was removed and sectioned in 10 mm thick sections for vertical salinity profile deter- mination. These sections were melted in sealed plastic containers in a microwave oven and stored overnight in a shelter used for sleeping before salinities were measured by means of a calibrated refractometer type salinometer.
As there is no information available in the open literature on the mechanical properties of congealed frazil sea ice, it was decided not only to test this ice in the field but also to bring a freshly sampled block south for detailed study. This block was recovered 24 October 1981 when the air temperature was - 22" C. Incidentally, this is the precipitation temperature for NaCI, 2H,O. It was shipped to the laboratory in Ottawa the next day in a special heavily insulated box. The block was wrapped in plastic bubble pack and the remainder of the air space in the box filled with snow. Slices of dry ice were placed at the periphery of the block. A thick snow layer was left between the ice block and dry ice. These precautions were taken to avoid thermal or mechanical shock to the specimen. Transportation took about 20 h. There was still some *World Meteorological Organization (WMO) terminology for new ice cover with thickness up to 30cm.
Figure 1 Location of experimental site.
dry ice left in the box on its arrival in Ottawa, indi- tem at DBR/NRCC were fully operational. Laborat- cating that the ice was well protected at least ther- ory tests were conducted in January 1983. During mally. In Ottawa the block was stored at a tem- sampling, shipping and storage, therefore, the ice was perature of about - 35" C for more than a year until kept at temperatures well below the precipitation of all a new sea-ice cold room and the closed-loop test sys- the major salts in sea ice [2].
Figure 2 Side-looking airborne
radar (SLAR) image recorded by AES Electra, 21 October 1981.
3. Experimental procedure
Field tests were conducted in a portable, insulated but unheated structure on the eastern shore of Mould Bay. Mechanical tests were performed, first at - 10 0.5" C, then at - 18 & 0.5" C, dictated primarily by air
temperatures outside the laboratory. A small portable heater had sufficient capacity to keep the room at
- 10" C when the outside air temperature was in the range of - 20" C or higher. Later, the air temperature dropped substantially and it became necessary to carry out the measurements at lower temperature. Considerable effort before each test went into bringing the specimen temperature to within 0.5"C of the desired one. Surface temperatures of the specimens were measured by thermistor before and after testing. In addition, a deep hole was drilled along the longi- tudinal axis of one specimen and a mercury ther- mometer inserted to monitor temperature during the test. This specimen was not used for strength testing but was kept with those that were.
Test were carried out both in the field and in the Ottawa laboratory on large prismatic samples with final dimensions of 50mm x lOOmm x 250mm, their long dimensions parallel to the surface of the ice cover. In the field a portable bandsaw kept inside the cold room at - 10" C or lower was used to prepare samples. The specimen surfaces were finished by hand with medium-grade sandpaper on a flat surface to remove all cut marks. The end surfaces (50mm x 100 mm) of each specimen were given a final polish with a fine-grade paper to make certain that they were flat and at right angles to the long axis of the prisms. Final finish was given by wiping with a tissue paper slightly moistened with alcohol. Finished specimens were weighed to an accuracy of 0.01 g and their dimen- sions taken with a vernier caliper. Each specimen was stored separately in a plastic bag from which the air was withdrawn. They were turned periodically during storage in order to reduce adverse effects due to brine drainage or migration.
A commerical test machine (Soiltest CT-405) with a design load capacity of 50 kN was used in the field. It had been modified considerably to make it possible for two people to handle it. It is a conventional screw- driven machine capable of delivering a constant actu- ator displacement rate,
x,
up to 7 x 10c2mm sec-I, or a nominal strain rate, d, = x/1, up to 2.8 x loc4 secc' for a specimen length, I, of 250mm. Each specimen was tested between a pair of polished steel platens with load applied across the 50 mm x 100 mm faces. Load was measured with a calibrated load cell, and speci- men deformation with two specially designed dis- placement gauges (150mm gauge length) mounted directly on the two lOOmm x 250mm faces of the specimen (Fig. 3), as described by Sinha [3]. Output from the load cell and from the two displacement gauges was recorded separately, using strip chart recorders in heated and well-insulated boxes that also housed the load cell electronics and the 6 V dry cells for the DCDTs (direct current displacement trans- ducers) of the displacement gauges. Calibration of these gauges was checked after every few tests to ensure the accuracy of the strain measurements.Figure 3 Experimental arrangement, field test.
In Ottawa the ice block was transferred from its storage in the freezer at - 35" C to a laboratory cold room at - 10
+
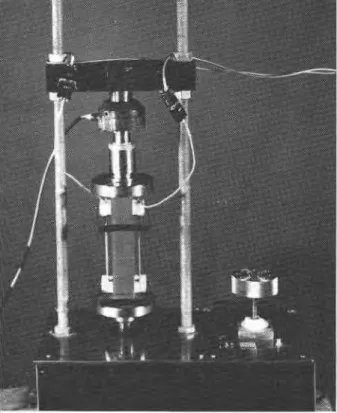
0. 1" C where it was allowed to warm for a day, still wrapped with insulating material. It was then sectioned with a bandsaw in a thick vertical slice for microstructural analysis. The rest of the block was used to prepare four specimens for strength tests, their major axis in the plane parallel to the original ice cover. They were machined to their final dimen- sions of 50 mm x 100 mm x 250 mm with a milling machine and a lathe inside the cold room. Cutter marks on the surfaces were removed with find sand- paper on a flat granite block. Final finish, as in the field, was given by wiping with a tissue slightly moist- ened with alcohol. The samples were then stored within the cold room in individual plastic bags and handled the same as in the field until they were tested within a few days.The test machine was an MTS closed-loop, servo- hydraulic system of 1.0 MN capacity situated inside the cold room near an observation window; the con- trols, pump, and recording system were outside. The loading train consisted of two 152 mm diameter com- pression platens (one at the top and one at the bottom of the specimen), a spherical seat, and a 250kN capacity load cell. The lower platen was attached to the actuator and the upper platen reacted against the load frame through the spherical seat and the load cell. The machine could be programmed to apply various amounts and rates of load, strain, and dis- placement. Axial strain rate, &, was maintained con- stant by the feedback system in the present tests by means of a 200mm gauge-length MTS extensometer (no. 1 in Fig. 4) attached directly to the central area of one 100 mm x 250 mm face of the specimen. Two metal strips (1 mm x 4 mm x 30 mm) with a groove
Figure 4 Arrangement following actual laboratory test at 3 x
1 0 - 4 s e c ' . Note uniform specimen deformation.
in the middle of the 4 mm x 30 mm faces and frozen near the top and bottom of the specimen were used to seat the knife edges of the displacement gauge as illustrated in Fig. 4. Two rubber bands held the gauge in position. The same pair of displacement gauges used to measure axial strain in the field study were also mounted (nos. 2 and 3) on the side faces (50mm x 250mm) of the specimen. Their output provided an independent method of examining deformation and its rate, controlled by the no. 1 gauge and the test system, as well as the uniformity of deformation of the specimen. Another pair of gauges (nos. 4 and 5) were mounted on the central area and across the width of the specimen to measure lateral deformation. Load and strain outputs from all the gauges were recorded separately, as functions of time, on strip chart recorders and on a digital data logging system outside the cold room. The strip chart recorders, in this case, provided a convenient method of monitoring the pro- gress of a test.
Compressive loads were applied to the 50mm x lOOmm faces of the specimens. Since the field tests could not be performed at nominal strain rates greater than about 2.8 x sec-I and since there were only four specimens, the laboratory tests were conducted at 3 x lop4, 6 x lop4, 1 x and 2 x 10⁻³sec-l.
4.
MaterialsStructural details of the ice at Station 2 may be seen in Fig. 5. Note the primarily frazil type of ice in the vertical section, except for the columnar-grained
Figure 5 Thin sections of ice, Station 2, under cross-polarized light: (a) vertical section; (b) horizontal section a t a depth of 50mm; (c) horizontal section at a depth of 150 mm.
structure near the bottom. In general, the grains in the frazil layer were elongated. The diameter of the grains was about 0.5 to 1.5 mm and the length was between 2 and 5 mm (Fig. 6). The long axis of the grains tended to be at right angles to the surface of the ice cover. Texture of this layer, therefore, was transversely iso- tropic, at least locally, with the plane of isotropy parallel to the surface. It is possible that this texture was developed as a result of closer packing when the elongated frazil crystals formed in the water were driven by wind towards the eastern shore. Records at a weather office situated about 3 km from Station 2 indicated heavy wind from the west before 24 i
September 198 1, the freeze-up date for complete ice cover in Mould Bay [I]. A similar type of ice texture
has also been noted by the author in a multi-year floe + in north Baffin Bay near Ellesmere Island. Ice with
discoids stacked in a vertical position (c-axis horizon-
tal) has also been reported by Weeks and Ackley [4].
*
a As the grains were small, it was not convenient touse the conventional polarized light and universal stage method to examine the fabric of the ice. An etching and replication technique developed earlier [5] and applied successfully for observing basal dislo- cation [6] was found to be ideal for this situation. Fig. 7 shows a scanning electron micrograph of a replica of a vertical section of the ice. As the etching and replicating processes were carried out at - 10" C,
Figure 6 Optical micrographs of thermally etched ice surfaces showing (a) vertical and (b) horizontal cross-sections of frazil crystals.
primarily at the grain boundaries but also smeared on the surface prepared by microtoming. It was found, however, that brine on the surface interferes with the etching processes, although not sufficiently to prevent etching of grain boundaries, as may be seen in the figure. Fig. 7a illustrates that the c-axis tended to be normal to the long axis of the grains and therefore parallel to the surface of the ice cover. This is indicated by the long direction of the elongated etch pits (Fig. 7b), corresponding to the intersection of the basal dislo- cations with the surface under observation [6]. The c-axis of the grains, however, are found to be ran- domly oriented in the horizontal plane (the plane in which load was applied during the strength tests). Because of this, not all the grains in Fig. 7b showed elongated pits, which develop only if the surface under etching coincides with one of the prismatic surfaces of the crystals.
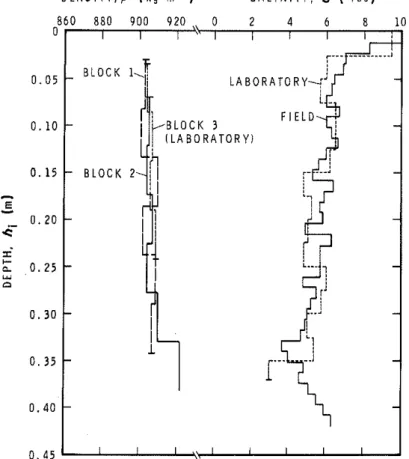
Vertical salinity and density profiles are shown in Fig. 8. To a depth of about 0.35m in the frazil layer the salinity decreases with depth, whereas density increases. Densities were determined from mass and volume, and volume was determined from the dimen- sions of the samples prepared for strength tests; den- sities are therefore considered to be representative of the bulk characteristics of the frazil layer of the ice cover because of the large size of the samples. Blocks 1 and 2 are representative of the samples tested in the field, block 3 of those tested in the Ottawa laboratory. The solid line for salinity presents the field obser- vations; the broken line gives salinities determined in the laboratory. They show that the salt content of the
ice tested in the laboratory was not different from that in the field.
5.
Stress-strain relationA comparison of the stress-strain behaviour observed in the field and in the laboratory for apparently similar loading conditions, as judged by the value of in and i , is presented in Fig. 9. Stress and strain histories for the two tests are illustrated in Fig. 10. Note that the true strain rate of the specimen in the field test was not constant in spite of a constant (actually measured) cross-head displacement rate. Thus, the test results illustrated in Fig. 9 are not comparable because of differences in loading history. The lower strength obtained in the field test was indeed caused by a lower rate of loading. The stain rate during the initial period in the field test was almost an order of magnitude lower than the nominal rate. It approached the nom- inal strain rate, as indicated by the slope of the strain- time record, as the stress approached the maximum or upper yield stress, of. This behaviour was not caused simply by less than ideal test conditions in the field. Similar observations involving conventional test machines have also been made in the laboratory, using laboratory-made fresh-water ice [3]. The average strain rate,
t,,
= &,Itf, where E, and tf are failure strain and failure time, respectively, has been shown to be useful in analysing results obtained with conventional machines [7], and therefore will be used for analysis of the present field data.As the laboratory tests were performed more pre- cisely than the field tests and contain a considerable
amount (Fig. 11). tunity to and the during a
Figure 7 Scanning electron micrograph showing (a) replica of
etched surface of vertical section, and (b) etch pits, encircled area in (a), elongated along [000 I] axes (c*).
rounding of the edges of the load-bearing end surfaces (50 mm x 100 mm) during final polishing would sig- nificantly affect the surface strain of the side surfaces (50 mm x 250 mm) on which gauges 2 and 3 were mounted. Considering this possiblility and the fact that total strains were extremely small, the defor- mations measured by gauges 2 and 3 indicate that the specimen deformed fairly uniformly and that the rates compare well with the controlled rates. It should be also noted (Fig. 1 lc) that gauges 3 and 4 fell from the sample the moment unloading was initiated. To avoid damage to the gauges during the fastest test in this series, only the controlling gauge was installed on the specimen.
The unloading curves show (1) that 60 to 70% of the failure strain during each test is recoverable, and (2) that more than 50% of it is a delayed-elastic (or time-dependent-recovery) response. Hence, the major part of the deformation at failure is associated with micromechanical phenomena related to elasticity and delayed elasticity. Thus, the analysis of failure behav- iour must take into account processes associated with elasticity and delayed elasticity as well as with per- manent deformation.
6.
Strength-timeIn both field and laboratory, load and time can be measured readily and more accurately than can strain. The simplest relation that can be examined from the experimental results, therefore, is the interdependence of upper yield or failure stress and failure time. Fig. 12 shows that results can be represented by a relation of
where t, is the unit or reference time (1 sec), and o, is the unit or reference stress (1 MNm-2). Results of regression analyses are shown in Table I. Note that the numerical values of the stress exponent, 8, are similar of information, they are presented in detail for the two sets of data at - 10" C. This relation has Data from gauges 2 and 3 provide an oppor- also been observed for fresh-water ice [3]. The value of examine the performance of control gauge 1 6 for conditions of constant cross-head displacement
uniformity in the specimen deformation rate, at - 10" C, for horizontally oriented, transversely test. It should be noted that even a slight isotropic, columnar-grained fresh-water ice (classified
Figure 8Vertical density and salinity profile in frazil ice
at Mould Bay, Station 2, October 1981.
as S-2 ice) was found to be 2.30; the corresponding value under closed-loop controlled, constant strain rate was 2.37 [7]. There is a remarkable similarity
between Equation 1 with the above values of 0 and the
dependence of creep rupture time on stress for metals and alloys at high temperatures [8-101. It would appear that the mechanical response of sea ice and fresh-water ice is comparable to that of other poly- crystalline materials.
7. Stress rate sensitivity
The simplest evaluation of the rate sensitivity of stength, proposed by Siuha [3] and discussed in detail
[7], may be obtained by using the average stress rate to
failure, u,, = a,/t,. With Equation 1 it can be shown
where
4
is unit stress rate defined as al/t,(= 1 MNm-'sec-I).
Substitution in Equation 2 of the values of
C
and 0from Table I gives, for
- 10" C, field or = 7.0 (3a) 6 5 - I O T , laboratory a, = 5.1 (u,,)~.'~ (3b) I I I I I I
-
-
/
LABORATORY. i = 3 x low4 SPC'-
- 18" C , field or = 6.8 (3c) --
--
-
-
-
F R A Z I L I C E . -10°C-
- 0 1 2 3 4 5 6Figure 9 Stress and strain diagrams for apparently similar loading conditions in field and laboratory.
similar field and laboratory tests.
T I M E . I ( s e c )
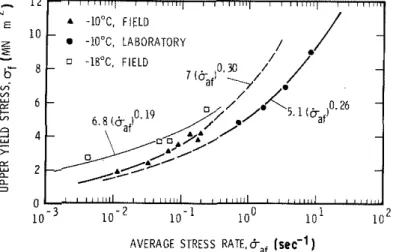
Equations 3a to c are shown in Fig. 13 along with the experimental results. It is apparent that the model provides a convenient means of comparison. The effect of temperature on stress-rate dependence of strength for the field results is clear. Extrapolation of
the field tests at - 10°C to higher rates, however,
indicates noticeably higher strengths than those obtained in the laboratory at the same temperature. This indicates that analyses based on average stress rate are of limited use and may not be extrapolated too far outside the range of loading rate for which they were developed. It should be mentioned here that the stress rate exponent for laboratory-made, transversely isotropic, pure fresh-water ice subjected to constant cross-head rate tests was also 0.30 [3] in the same stress-rate range and temperature. This indicates that the rate sensitivity of sea ice is similar to that of pure
ice and that the stress rate model provides a reason- able means of comparing results. For the present type of test, however, where specimen deformation has been measured, the strain rate method was deemed
preferable [7, 111.
8.
Strain rate sensitivityThe dependence of strength, a,, on average strain rate,
Car, for field tests and on the closed-loop controlled,
constant strain rate, E, for laboratory tests is shown in
Fig. 14. The strain rate dependence of failure stress may be described thus:
field tests
af
laboratory tests
-
=P
(iy
01
T A B L E I Results of regression analysts, frazil ice
Location Equation Temp. Coefficient Exponent Correlation
(" CI (C. 0. PI (8, u. D ) coefficient p~ - 8 Field -10 6.36 x 10' 2.32 0.973 Field 1, = C
(2)"
- 18 3.28 x lo' 4.41 0.939-"
Laboratory I? = C(:) - 10 5.08 x 10' 2.84 0.991 Laboratory I, = Qd-" -10 2.54 x lo-' 0.966 0.999 Field of = P($
-10 48.7 0.275 0.925 Field c rP ~(+J
- 18 66.9 0.282 0.951 Laboratory-
10 70.6 0.335 0.994where
C,
is the unit or reference strain rate (1 sec-I), P measurements were made is shown by the dashedis the upper yield stress for unit strain rate, and p is a curves.
constant. Table I gives the results of a least-squares As the number of tests was limited and each set of
regression fit of these equations to the observations. observations covered a limited range of strain rate, it
The equations are shown in Fig. 14; extrapolation is not advisable to extrapolate the results much
beyond the range of strain rate over which the beyond the range covered. It may be seen in Fig. 14,
(a1 T I M E , t ( S ~ C I 7 / I / I , ! , , I I I I , , , , 6 1 . 2
,
E 5 1 . 0 6 i L-
5
4 0 .a
2
!
3 "7 0.6 5 a:
2 CL w GAUGE LOCATIONS a. 4 + rn 1 0 . 2 0 0 4 n- 3 AXIAL.< (GAUGE 11 m-
-
AXIAL.€ (AVERAGE 2 & 31U, z- 2
-
a w b- rn 1 0 1 0 - I l o o lo3 (bl TIME. t ( s e c )Figure 11 Laboratory results for closed-loop controlled, constant strain rate tests an frazil ice at - 10°C. (a) B = 3 x 10-'sec-', (b) E = 6 x lO-%ec-', (c) 8 = 1 x 10-'sec-'.
( e l T I M E . t ( s e e )
Figure 11 Continued
however, that the strain rate curve for the field tests at -10°C can be extended one order of magnitude higher and still be consistent with the laboratory results. Similarly, the extrapolated curve for the lab- oratory tests is consistent with the results of field measurements. Admittedly there are noticeable dif- ferences between the two curves. But when consider- ation is given to the fact that the two sets of results were obtained from two different blocks of ice, that the only control on the rate of deformation in the field
was the rate of cross-head movement, and that the temperature of one specimen could have varied as much as l o C from another in the field, the differences in the results are not unreasonable. Overall, the strain rate analysis appears to be more appropriate than the stress rate analysis; it does not have the physical inconsistency inherent in the stress rate analysis, as
has already been discussed [7, 1 I].
The rate sensitivity of strength is usually described by the numerical value of the strain rate exponent, p.
-10°C. FIELD -1O0C, LABORATORY 0 -18°C. FIELD \ 4 -4.4 3.3 x 10 u, 6% I I / / t t 8 1 I
J
l o 0 lo1 lo2 l o 3Figure 13 Dependence of maximum stress on stress rate.
-
1 2 N E L l 0z
-
b- 8 - ", ",Field and laboratory measurements yielded reason- ably similar values for p. The laboratory value of 0.335 is close to that of 0.328 obtained previously for fresh-water, transversely isotropic, columnar-grained S-2 ice for conditions of constant cross-head rate [3], and of 0.345 obtained for the same types of fresh- water ice tested under closed-loop, controlled, con-
stant strain rate loading conditions [7]. The rate sen-
sitivity of strength appears, therefore, to be unaffected by the brine content of ice.
Another consideration is that the form of Equation
4 is the same as that describing the dependence of
stress on steady-state or, strictly speaking, minimum strain rate in creep tests under constant stress and temperature commonly observed for polycrystalline materials, including ice at high homologous tem-
peratures [8, 12, 131. The strain rate exponent for mini-
mum creep rate in fresh-water ice is commonly found to be near 0.33, which is also in close agreement with the strain rate exponents presented above.
1 ' """I i ' "' 8, ' " " " I 8 3 l l l 8 1 8 1 1 8 l i l r -IO0C, FIELD -
.
-10°C. LABORATORY / 0 -lB°C, FIELD - 7 l u af 1 0,.7
'
1'/
/
-9.
Failure time-strain rateIt was shown in an earlier series of closed-loop, con- trolled constant strain rate experiments on pure fresh-
water ice [7] that the dependence of the time to failure
on strain rate can be descibed by
S
6 - +/
4
5.1 ( b a $ 0.26 - --
0" " " '
" " " " 1 " " " ' " " " ' i " " ' " ' - 1 0 - I l o 0 l o 1 l o 2AVERAGE STRESS R A T E , k a f [sec-j)
where Q and q are constants.
A least-squares fit of Equation 5 to the laboratory
results yields Q = 2.54 x 10-I and q = 0.966 (Table
I), with a correlation coefficient of 0.999. As q is very nearly equal to unity, the failure time for frazil ice is almost inversely proportional to strain rate. This is remarkably close to the commonly observed depen- dence of tensile creep rupture time at constant tem- perature on the steady-state creep rate in pure materials, single-phase alloys, and other polycrystal- line materials [8, 9, 141.
10. Failure strain
By definition, failure strain is given by:
for field tests Er = i a r f r 7 -
El f l (6a)
& t ,
for laboratory tests 8, = : -
&I tl (6b)
From Equations 1, 4 and 6a, it can be shown that
I
'
" " " I ' " ' " t 4 1 l " " ' r A -lODC, FIELD-
-1O0C, LABORATORY 0 -18°C. FIELD - - - --
-
0.275-
_-
-
I, ,
I , ,I,
i i l i l i 1 l 8 1 l ll8U 0 1 0 - 2Fizure 14 Deoendence of maximum stress on strain
Figme 15 Dependence of failure strain on strain rate.
-1O0C, LABORATORY
o -18'C. FIELD
0 1 ' " ~ ' " ' 1 ' ' " " " i ' ' 1 " " ' 1 @ ' " " J
1 0 - ~ 1 0 - 2
STRAIN RATE, ba,,2 (sac-')
which gives, on substitution of the constants from Table I,
for field measurements at - 10°C. The data at - 18" C
are considered to be too scattered for this study. Equations 5 and 6b, on the other hand, can be combined to show that for laboratory tests
which gives, from Table I
E , = 2.54 x (e)'03 (8b) The dependence of failure strain on strain rate for various sets of results and the appropriate equations are shown in Fig. 15. Both field and laboratory observations indicate that the value of failure strain is small and deformation at failure practically indepen- dent of strain rate and hence of stress for the truly constant strain rate tests. These laboratory obser- vations bear a close resemblance to those for fresh- water ice [7] and for metals, alloys, and other materials under tensile mode of loading at high temperatures. For conditions where nucleation and growth of cavi- ties are responsible for failure, the fracture strain in polycrystalline metals, alloys, ceramics, etc, has been widely reported to be nearly independent of applied load, and thus of the minimum creep rate [8, 14, 151.
11.
Deformation modulusMost engineering solutions are based on elastic cal- culations. Engineering practice, therefore, customarily requires the determination of Young's modulus, or strictly speaking an appropriate "effective modulus." The question then arises as to what would be the appropriate modulus? Two distinct solutions may be visualized as examples of rationalization in ice engineering.
When a thick ice cover moves against a structure or a ship interacts with a thick floe (or iceberg) in a
ramming mode, failure by compressive crushing may occur. For this type of failure the secant modulus or
failure modulus, E, = u,/E,, with the definitions of of
and E, used here, is a useful engineering quantity. A
thin ice cover, however, may fracture in bending mode. In such situations the load levels are signifi- cantly lower and initial modulus values would be appropriate. The non-linear stress-strain diagrams shown in Fig. 9 emphasize the need to take into account rate of loading and load level when specifying initial moduli. It has been shown [3, 71 that the secant modulus, E,, to an appropriate stress, o (say 0.5 or 1.0MNm-2), is appropriate for dealing with engin- eering problems involving failure by fracture in bend- ing. Because of the low stress level chosen, this secant modulus will also be referred to later as "initial secant" or simply "initial modulus."
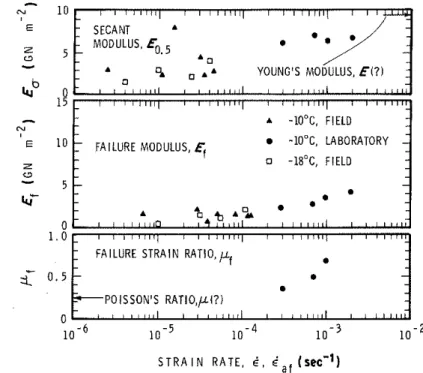
The rate sensitivity of both the initial secant modu- lus and failure modulus may be seen in Fig. 16. Par- ticularly noticeable is the increase in the initial modu- lus with increase in strain rate, approaching the dynamic elastic modulus at high rates. Using seismic methods, Langleben and Pounder [I61 obtained elastic modulus values of about 9.2 G N m-2 for Arctic sea ice with brine volumes in the range of 20 to 30%0, which is equivalent to the ice used here, with salinities in the range of about 4 to 6%0 according to the equations of Frankenstein and Garner [17]. The strain rate depen- dence of the initial modulus shown in Fig. 16 is in extremely close numerical agreement with the experi-
mental observations of Traetteberg et al. [la] on the
strain rate dependence of initial modulus of fresh-
water granular snow ice at - 10°C and with theor-
etical values presented by Sinha [I91 for ice with grain diameter of 1 mm. It therefore raises the question of whether Sinha's [19] assumption of the Young's modulus value in the range of 9.5GNrn-' for fresh- water ice is also valid for sea ice?
12.
Poisson's ratioFigure 16 Strain rate dependence of initial secant
E SECANT modulus, failure modulus, and failure strain ratio.
MODULUS, ED,5 o YOUNG'S MODULUS, E l ? ) 0 1 5 I ' " ' I 1 " " " 1 " " "
-
-, A -1D0C, FIELDFAILURE MODULUS, E, -1D0C, LABORATORY
0 -18°C. FIELD L 5
-
.
- . A % t, A?..
0 0 8 84 a , , , , 1 ,,
, I 8 8 8 1 . 0 1 1 i 1 l l l i , I 1 i l l l i , l 1 , 1 1 1 1 ) 1 / 1 8 , , 1 , T T- FAILURE STRAIN RATIO,
p,
.
7
...
POISSON'S RATIO,/LI?1 0
S T R A I N R A T E , < ,
e , ,
( s ~ c - ' )p, for sea ice. Langleben and Pounder [I61 suggested
one of 0.29. For fresh-water ice, Northwood [20] esti- mated a value of 0.33, and Gold [21] measured values up t o 0.88 for columnar-grained ice for stress less than 0.5 M N m - 2 . Poisson's ratio is commonly assumed to be 0.3 for elastic analysis and 0.5 for plastic analysis (assuming incompressibility). But for engineering problems the hehaviour of ice is neither purely elastic nor purely plastic. Moreover, the deformation mech- anisms associated with microcracking, known com- monly as dilatation, also play an important role depending on loading conditions. As the term Poisson's ratio, like Young's modulus, is usually associated with elastic behaviour, it is suggested that a simple term such as "strain ratio" be used and that it be denoted p,, the subscript indicating the effective nature of this quantity, similar to effective modulus,
E,, discussed earlier [22].
For conditions where cracking activity does not dominate the deformation processes and where final
strain consists predominantly of viscous flow, p, in
isotropic ice may be expected to increase with time during loading from an initial value (Poisson's ratio)
to a final value of 0.5. The shape of the p,-t curve
would, of course, depend on the relative contribution of the delayed elastic strain, associated with the grain- boundary sliding phenomenon, and the viscous flow
to the total strain. The increase in p, during the load-
ing period shown in Fig. l l a to c supports this. Very low values at the beginning of the test, however, are certainly erroneous and related to the low output from
the lateral gauges. There are indications that p, values
in the range of 0.2 may be realistic, which means that the Poisson's ratio of ice may be significantly lower than is commonly assumed.
In all the observations shown in Fig. 11 there seems
to be an inflection in the curve for pc beyond which a
significant change in slope occurs. This inflection, p,,
could be due to additional deformation mechanisms introduced by the increasing cracking activity in the material. As the rate of cracking depends on strain
rate [7], the rate of increase of p, would also depend on
i, and may be seen in Fig. 11. The dependence on B of
the strain ratio at upper yield or failure, p,, (as shown
in Fig. 16) appears to justify this statement. A direct proof that cracks play an important role in the dila- tation process may be seen in the sharp increase in the
value of p, on unloading, and its gradual increase
during recovery. Values of I(, significantly higher than
0.5 for the permanent deformations indicate that processes of dilatation caused by other than simple viscous flow occurred during the loading period. This
could partially explain the high values of
A
up to 1.2,obtained by Wang [23] in first-year, columnar-grained sea ice. As the deformation due to grain-boundary sliding phenomena is essentially two-dimensional in highly anisotropic columnar-grained ice, a high value
could be expected for
A,
depending on loading con-ditions, and Gold [21] did measure a value of 0.88 for loading conditions not involving cracking activity.
13. Conclusion
Uniaxial compressive strength and deformation tests on transversely isotropic, congealed frazil sea ice have been conducted on freshly sampled ice in the Arctic and on ice after 15 months of storage in an Ottawa laboratory. Field tests were conducted under constant cross-head rates; laboratory tests were conducted under closed-loop controlled, constant strain rates. It is shown that similar results can be obtained provided that they are analysed on the basis of stress and strain rates actually measured on the specimens, and provided also that the saline ice is stored well below
the NaCI, 2H,O precipitation temperature of
-
22" C.The stress rate method provides a suitable means of comparing rate sensitivity of strength determined in the field and in the laboratory. Strain rate analysis, however, seems generally more useful for engineering applications. The rate sensitivity of strength is not affected by brine content in ice and the strain rate exponent of frazil sea ice was found to be numerically the same as that obtained earlier for fresh-water ice.
The failure time for constant strain rate tests was almost inversely proportional to the strain rate, and the failure strain increased slightly with strain rate. Total strain to failure consisted of significant (up to 70%) elastic and delayed-elastic components, .with small permanent deformation. Both failure modulus and the initial secant modulus increased with strain rate, tending towards the dynamic elastic modulus. Failure modulus was, of course, significantly lower than initial modulus at the same rate. Poisson's, or initial strain, ratio was observed to be in the range of 0.2. The strain ratio was, however, noted to increase with time during loading, depending upon loading rate, and the ratio at upper yield increased signifi- cantly with strain rate due to cracking activity.
Acknowledgements
The author is grateful to R. 0 . Ramseier for the
opportunity to participate in the "Radarsat-1981" programme at Mould Bay and to Atmospheric Environment Service, Environment Canada, for financial support. He wishes also to express his sincere
thanks to K . W. Asmus, S. A. Dighy, and L. B. Solar
for their assistance in the field, and to R. Jerome for
his assistance in the laboratory. This paper is a contri- bution from the Division of Building Research, National Research Council of Canada.
References
I. N . K S I N H A , Can. J. Civil Eng. Il(1) (1984) 82. 2. W . F . W E E K S and A . A S S U R , "Themechanicalproper-
ties of sea ice", US Army Cold Regions Research and Engin- eering Laboratory, Report 11-C3 (1967) 3-5.
3. N . K . S I N H A , Exp. Mech. 21 (6) (1981) 209.
4. W . F. W E E K S and S. F. A C K L E Y , "Thc growth, struc- ture and properties of sea ice", US Army Cold Regions Research and Engineering Laboratory, Monograph 82-1 (1982).
5. N . K . S I N H A , Phil. M a g . 36(6) (1977) 1385.
6. Idem. J. Glociolo~y 21(85) (1978) 385.
9. Y . N R A B O T N O V , in "Creep Problems in Structural
Members" (North-Holland, Amsterdam, 1969) Ch. 6 , p. 358.
10. F. K . G . O D Q V I S T , in "Mathematical Theory of Creep and Creeo-Ru~ture" . . (Ciarendon Press. Oxford. 1974) Ch. 10. . .
p. 131.
I I . N . K . S I N H A , Ann. Glaciology 4 (1983) 253.
12. M F. A H S B Y , and H. J . F R O S T , in "Constilutivc Equations in Plasticitv". edited by A. S. Argon (Massa- ch;setts Institute of ~ k h n o l o ~ y , Cambridge, Massachusetts, 1975) OD. 117-47. . .
I . W E E R T M A N , Creep of ice, in "Physics and Chemistry
of Ice", edited by E. Whalley, S. J. Jones and L. W. Gold :
(Royal Society of Canada, Ottawa, 1973) pp. 320-7.
, .
A . J P E R R Y , J. More?. Sci. 9 (1974) 1016.
G , w. G R E E N W O O D , in "The Microstructure and t 8
Design of Alloys" (Institute of Metals and The Iron and Steel Institute, London, 1973) pp. 91-105.
M , P. L A N O L E B E N , and E . R . P O U N D E R , Elastic parameters of sea ice, in "Ice and Snow-Pracesscs, Propcrtics and Applications", edited by W. E. Kingery (Massachusetts Institute of Technology, Cambridge, Masst+chusetts, 1963) pp. 69-78.
G . F R A N K E N S T E I N and R . G A R N E R . J. Glneiology 6(48) (1967) 943.
A . T R A E T T E B E R C , L . W . G O L D , and R . F R E D E R - K I N G , "The strain rate and temperature dependence of Young's modulus of ice", in Proceedings of the 3rd Inter-
national Symposium on Ice Problems, Dartmouth College,
August 1975, Hanaver, New Hampshire (International
Association on Hydraulic Research, Hanover, 1975)
pp. 479-86.
N . K . S I N H A . "Grain-size influence on effective modulus
of ice", in Proceedings of the Workshop on the Bearing
Capacity of Ice Covers, Winnipeg, Canada, 16 to 17 October 1978, National Research Council of Canada, Associate Com- mittee on Geotechnical Research (Snow and Ice Subcommit- tee) Ottawa, TM 123, (1979) pp. 65-77.
T . D. N O R T H W O O D , Cm. J. Res. A25 (2) (1947) 88. L . W . G O L D , Can. J. Phys. 36(10) (1958) 1265.
N. K . S I N H A , Exp. Mech. 18(2) (1978) 464.
Y , S , W A N G , "Uniaxial compression testing of Arctic sea ice", in Praccedings of the 6th International Conference on Port and Ocean Engineering under Arctic Conditions,
Quebec, Canada, Vol. I (Lava1 University Press, Quebec City,
1981) pp. 346-55. 7. Idem, J . M<ttrr. Sci. 17(3) (1982) 785.
8, E . G A R O F A L O , in "Fundamentals of Creep and Creep-
Rupture in Metals" (MacMillan, New York, 1965) Chs. 6 and Received 12 May


![Figure 7 Scanning electron micrograph showing (a) replica of etched surface of vertical section, and (b) etch pits, encircled area in (a), elongated along [000 I] axes (c*)](https://thumb-eu.123doks.com/thumbv2/123doknet/14290081.492639/9.896.459.807.12.253/figure-scanning-electron-micrograph-showing-vertical-encircled-elongated.webp)