Publisher’s version / Version de l'éditeur:
Adhesives Age, 23, 11, pp. 41-47, 1980-11
READ THESE TERMS AND CONDITIONS CAREFULLY BEFORE USING THIS WEBSITE. https://nrc-publications.canada.ca/eng/copyright
Vous avez des questions? Nous pouvons vous aider. Pour communiquer directement avec un auteur, consultez la première page de la revue dans laquelle son article a été publié afin de trouver ses coordonnées. Si vous n’arrivez pas à les repérer, communiquez avec nous à PublicationsArchive-ArchivesPublications@nrc-cnrc.gc.ca.
Questions? Contact the NRC Publications Archive team at
PublicationsArchive-ArchivesPublications@nrc-cnrc.gc.ca. If you wish to email the authors directly, please see the first page of the publication for their contact information.
NRC Publications Archive
Archives des publications du CNRC
This publication could be one of several versions: author’s original, accepted manuscript or the publisher’s version. / La version de cette publication peut être l’une des suivantes : la version prépublication de l’auteur, la version acceptée du manuscrit ou la version de l’éditeur.
Access and use of this website and the material on it are subject to the Terms and Conditions set forth at
Weathering of silicone sealant on strain-cycling exposure rack
Karpati, K. K.
https://publications-cnrc.canada.ca/fra/droits
L’accès à ce site Web et l’utilisation de son contenu sont assujettis aux conditions présentées dans le site LISEZ CES CONDITIONS ATTENTIVEMENT AVANT D’UTILISER CE SITE WEB.
NRC Publications Record / Notice d'Archives des publications de CNRC:
https://nrc-publications.canada.ca/eng/view/object/?id=e232fc23-32d8-420b-9f2f-6fc2c8fe5543 https://publications-cnrc.canada.ca/fra/voir/objet/?id=e232fc23-32d8-420b-9f2f-6fc2c8fe5543National Research Council of Canada
Conseil national de recherches du Canada
SET
TH1
N21d
no.
957
c .
2
WEATHERING OF SILICONE SEALANT ON
STRAIN-CYCLING EXPOSURE RACK
by K. K. Karpati
ANALYZED
Reprinted from
Adhesives Age
Vol.
23, No. 1 1 , November 1980
p. 41-47
DBR Paper No. 957
Division of Building Research
OTTAWA
I
-
-
-
-
-N R C
-
C 1 9 T lI
.
BLDC;.
RES.
SOMMAIRE
Cet article etudie les consequences des intemperies sur un mastic d'etancheite a un
seul composant,
a
base de silicone,
a
polymerisation chimique. Les proprietes des
joints qui ont ete exposes aux intemperies sont comparkes au moyen d'essais de trac-
tion
a
celles des joints vieillis
a
la chaleur et controlks.
Weathering of Silicone Sealant
on
St rain-cycling Exposure
Investigation of the possibility of pre- dicting performance of sealants from laboratory testing ( I ) indicated that cy- cling tests provide the closest labora- tory reproduction of outdoor behavior. Because such tests are time consuming, a relation has been established between laboratory cycling and faster tensile tests at various strain-cycling rates (2). At the low rates occurring in practice, however, laboratory methods are im- practical and a strain-cycling outdoor exposure rack was designed (3). This paper describes the changes a one-part chemically curing silicone sealant un- dergoes while exposed on the strain-cy- cling rack.
Specimens were cast on primed aluminum substrate and then exposed on a rack that produces a range of maximum yearly movements with su- perimposed daily movements. To sepa- rate the effects of outdoor exposure from those of strain-cycling, specimens were also exposed without movement and were stored in a constant-temper- ature room for the same three years of exposure. Comparison was made as well with heat-aged specimens, and the effect of fall versus spring cycling starts was examined. Periodically, the specimens were assessed visually and subjected to tensile tests. From these, the log strain versus log time at break was plotted, shown by previous work (4) to be the best method of character- izing the properties of the sealant.
By K. K. KARPATI
NATIONAL RESEARCH COUNCIL OF CANADA DIVISION OF BUILDING RESEARCH
OTTAWA, CANADA
Experimental
The sealant investigated was a one- part chemically curing silicone sealant conforming to Canadian General Stan- dards Board (formerly Canadian Gov- ernment Specifications Board) Stan- d a r d 1 9 - G P - 9 . G r a d e 6061T6 aluminum, primed according to the manufacturer's recommendation, was used as substrate. The sealant beads (12.70 x 12.70 x 50.80 mm; 0.500 x 0.500 x 2.000 in.) were cast in a con- stant-temperature room at 22°C (72°F) and 50 percent relative humidity. They
were cured for about two months be- fore being exposed to allow easy han- dling and scheduling of the work.
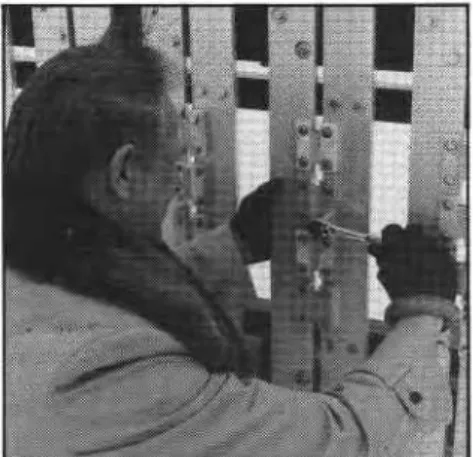
The specimens were bolted on a strain-cycling rack (Figures 1 and 2)
(3), and differential movement between the aluminum and the steel parts of the rack (induced by outdoor temperature changes) was transmitted to the sealant beads. The amount of movement the specimens underwent varied with their position on the rack and was measured weekly by maximum-minimum gauges (5). Simultaneously, the surface tem- perature of the rack was recorded and related by statistical analysis to the
Figure 1. Strain-cycling exposure rack.
Figure 2. Specimens are bolted to rack.
movement. This enabled deduction of an accurate average value for the yearly movements that occurred during the three years of exposure. One quar- ter of the total rack area produced identical movements: the maximum of the average yearly width changes on the 12.70 mm (0.500 in.) wide speci-
Rack
mens was k15.8 percent. On the re- maining area, movement increased from k4.8 to 230.4 percent in 36 in- crements. These values varied some- what with the year, the season, and the load on the rack, causing a variation of between k0.1 and 21.1 percent in addition to the k4.8 and 230.4 percent values, respectively, with proportional changes between these extremes.
The specimens were subjected to continuous movement on the rack for three years, starting in November 1974, and a few specimens for two and a half years, starting in May 1975. In both cases the air temperature was around the yearly average when the specimens were attached to the rack so that they underwent equal amounts of extension and compression during the yearly cycles. The samples faced south in a vertical position. Simultaneously, specimens were exposed, without movement, on a vertical rack facing south, using spacers and clamps to maintain the original width. After vari- ous exposure times specimens were taken for tensile tests from the differ- ent locations. Those not at the original width were put on spacers and clamps and conditioned for at least two weeks prior to testing to restore them to the original configuration. Testing and conditioning were done at 22°C (72°F) and 50 percent relative humidity.
In view of the limited number of specimens exposed to the same move- ment cycle, all specimens (failed or not) were taken off the rack and ten- sile tested. A careful examination of the results and of the tested specimens showed that a cross-sectional failure area less than or equal to about 40 mmz (0.06 sq. in.) had developed on exposure, but it did not influence the tensile curves. Failure areas larger than these lowered the tensile load for the same extension and were, therefore, not included in the tensile results. Fail- ures, either on exposure or in the ten- sile test, usually started at a corner on the side exposed to the south and
..-.*..
C O N T R O L T E S T S 10 5 c r n l m ~ n ) I I I J , 1 . 1 1 0.0005 c m l m r n ,/,o--- 1 - - - 0-
S T R A I N - C Y C L I N G E X P O S U R E R A C K E X P O S U R E R A C K W I T H O U T M O V E M Epropagated cohesively. The test. either propagated a failure developed on ex- posure or started one at another cor- ner, provided the original failure did not exceed the 40 mm2 (0.06 sq. in.). Only one of the 66 specimens exposed on the cycling rack exhibited complete cohesive failure. Records comprising notes, sketches, and photographs were kept of the visual changes the speci- mens underwent during exposure.
One batch of specimens was heated at 70°C (158°F) for 30 days, then ten- sile tested at room temperature to ex- amine the use of heat as an accelerator of the aging process.
Results and Discussion
Evaluation by Tensile Tests
A representative sample of the ten- sile curves obtained with specimens of various exposures is shown in Figure 3. The continuous lines refer to specimens subjected for three years on the strain- cycling rack to k15.8 percent max- imum yearly movement and tested at 22°C (72°F) at 0.5 and 0.005 cm/min extension rates. The dotted lines pre- sent results of tensile tests on unex- posed specimens cured in the constant temperature room for two months and tested at a rate of 0.5 cm/min. The difference in shape of the continuous and dotted curves is very small, al- though the exposure conditions varied greatly. There is considerable variation in stress and extension at failure, pro- ducing a scatter in the results. It may also be seen that the extension at fail- ure diminishes with exposure and with decreasing rate of extension.
Because the number of specimens was limited for a given exposure condi- tion, failure points alone could not serve as a reliable basis for the analysis of results. The curves were compared first, therefore, at 25 percent extension because that was the maximum exten- sibility claimed for the sealant when used in joints.
The stress readings at 25 percent ex- tension are plotted in Figure 4 for three different rates of extension. Three of the points are means of two to four readings; all others were calcu- lated using the type of plot shown in Figure 5 where the logarithm of stress versus logarithm of time is plotted (4). The continuous lines show the re- calculated tensile curves obtained at different rates, and the dashed lines are the best fitting lines across the ten- Figure 3 (top): Specimens exposed on strain-cycling rack and control tests. Figure 4 sile curves connecting points at the (center): Tensile stress at 25% extension a s a function of exposure time. Figure 5 same extension. The values plotted in
fitting line for the 25 percent exten- sions, thus increasing the number of points taken into consideration and the reliability of the results.
In Figure 4 the continuous lines show the results obtained with speci- mens exposed on the strain-cycling rack, and the dashed lines indicate re- sults for those subjected to exposure without movement. The points at zero exposure are the results of tests carried out after two months of curing in a constant-temperature room at 22OC (72OF) and 50 percent RH, the approx- imate time of laboratory curing the specimens underwent before exposure.
The sealant appears to be softer when strain-cycled, stress being lower in the strain-cycled specimens. General- ly, there is a decrease in stress during the first six months in both cases. Af- tep that, the stress increases and stays above zero exposure value without cy- cling, but it does not regain the origi- nal value if cycled. The curves ob- tained at different rates of extension show similar behavior, with lower stress at lower rates. After two years the strain-cycled specimens had very little rate dependence, as shown by the parallel lines.
As a further analysis of the effect of strain-cycling, the tensile stress at 25 percent extension was plotted as a function of maximum yearly strain- cycle (Figure 6 ) . Each plotted point represents a single tensile test and each curve a different exposure time. Al- though the number of test points avail- able is limited, it can be deduced that a marked decline of stress occurs with increasing yearly strain.
To compare stress versus exposure time (as in Figure 4) at different strain- cycles, the readings were divided into two groups, one less than or equal to and one greater than +21 percent yearly strain-cycles. This division pro- vided enough points for plotting the curves shown in Figure 7, which corre- spond to the uppermost continuous line in Figure 4 at 0.5 cm/min rate of extension. The separation between the two curves of Figure 7 further con- firms that strain-cycling had a stress- reducing effect. (There were not suf- ficient readings at rates other than 0.5 cm/min for similar analyses.)
Having analyzed tensile stress at 25 percent extension in Figure 4, the in- vestigator plotted it as a function of exposure time in Figure 8; and the two
. . .
..
0.05 c m l m ~ n 0.005 c m l m ~ n 0 4 M O N T H S A 6 M O N T H S 0 2 Y E A R S 0 3 Y E A R S -*--- - S T R A I N C Y C L I N G E X P O S U R E R A C K----
E X P O S U R E R A C K W I T H O U T M O V E M E N Twere compared' The curves have Figure 6 (top): Tensile stress at 25% extension as a function of yearly strain. Figure similar shapes, but the changes are at- 7 (center): Tensile stress at 25% extension as a function of exposure time and tenuated in Figure 8. Without the sup- strain-cycle. Figure 8 (bottom): Tensile strength as a function of exposure time.
0 . 0 0 0 5 c m l m i n
S T R A I N - C Y C L I N G E X P O S U R E R A C K
----
E X P O S U R E R A C K W I T H O U T M O V E M E N TFigure 9. Extensibility as a function of exposure time. porting evidence of Figure 4 showing
the same changes, the variations of the stress at break would be considered mainly due to scatter of the readings.
The pattern of variation of the ten- sile strength having been confirmed as inherent behavior of the material, it may be assumed that variation of the extension at break as a function of ex- posure is also inherent behavior and
not a result of scatter in the readings. The extension at failure for the various exposures is tabulated in Table I and plotted in Figure 9. The curves show a variation with exposure time that is very similar to that of stress behavior with less than two years of exposure: both stress and strain decrease in the first six months and go through a max- imum at one year if the specimens also
Figure 11. After two months' exposure. undergo strain-cycling. Without strain- cycling the maximum does not occur and the curves flatten out. Either type of exposure produces a drop of exten- sibility after two years or more, and the drop is larger if the specimens are cycled. With decreasing strain rates in the tensile tests, the curves flatten and show the same shape; but the values are lower.
dou 85c
340+1n
+(j8B *n2r:;171
i1n*8d.4y0:&.a
nnflool
I 115.8%
~ o ~ n ~ n r l o c c c ~ o u o ~ c o : l ~ ~ o o ~
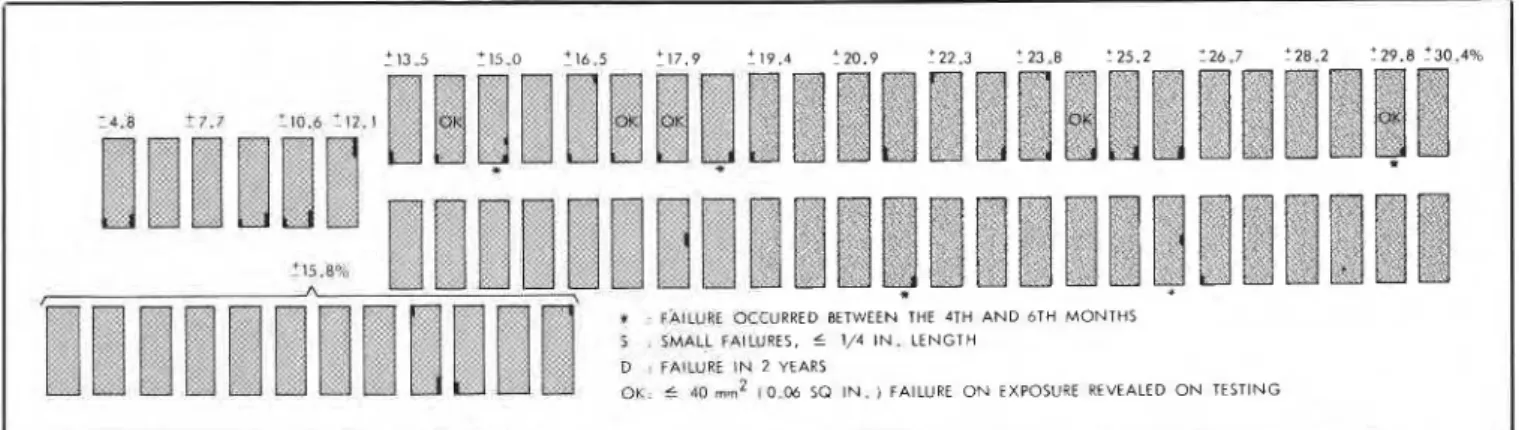
V FAILURE OCCURRED BETWEEN THE 4TH A N D 6TH MONTHS
S SMALL FAILIJRES, f 1/4 I N . LENGTH D FAILURE IN 2 YEARS
U O K 5 4 0 rnm2 10.06 SQ I N . ) FAILURE O N EXPOSURE REVEALED O N TESTING
Figure 10a. Adhesive failures occurring on the specimens within six months on strain-cycling rack.
115.7 t16.5 ' 1 7 . 9 23.0 t23.8 '26 0 1 2 6 . 7 '28.2 ' 2 8 . 9 '30.4
: 7.7
D D D
-
FAILURE O N SOUTH EXPOSURE SIDE1
LJ. . .
.
.
.
FAILURE O N NORTH EXPOSURE SIDEf 15.890 C
il
-- -
Figure 12. Failure advancing. Figure 13a. After 2.5 years' exposure. Figure 13b. After 3 years' exposure. These results have been obtained
with specimens that did not fail on ex- posure. They will have to be compared with qualitative assessment of exposed specimens where both failed and non- failed specimens are assessed to obtain a complete picture of material behav- ior.
Visual Assessment of Exposed Specimens
The specimens exposed on the rack without cycling movement showed no failure even after three years; neither did the specimens stored in the con- stant-temperature room. Strain-cycling, however, produced various degrees of failure on 38 of the 66 exposed speci- mens.
Figure 10a shows the layout of the specimens on the strain-cycling rack. The rectangles represent the side of the sealant bead exposed to the south. The average maximum yearly movement is shown on top. The failures that oc- curred within the first six months are indicated schematically. All are adhe- sive failures of shallow depth (less than the length shown). Very few occurred on the back or ends of the sealant bead and these are not shown in the schematic presentation.
Failures started within six months on 27 specimens. Those marked by aster- isks occurred after March 1975, leaving 22 specimens that showed some failure during the first winter. Specimens with and without failure were removed from the rack from time to time and tensile tested. This left 41 specimens exposed after six months, and only two showed any progress in failure during the sub- sequent summer (about 0.2 cm). These specimens are shown in Figures 11 to 16, where progress of failure may be followed through the entire three-year period. They illustrate failure charac- teristic of all the specimens.
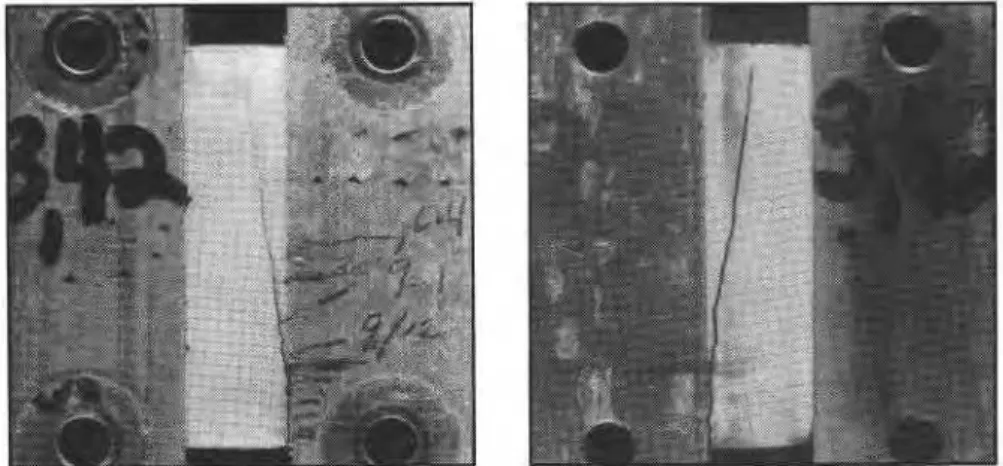
Figure 11 shows the start of failure
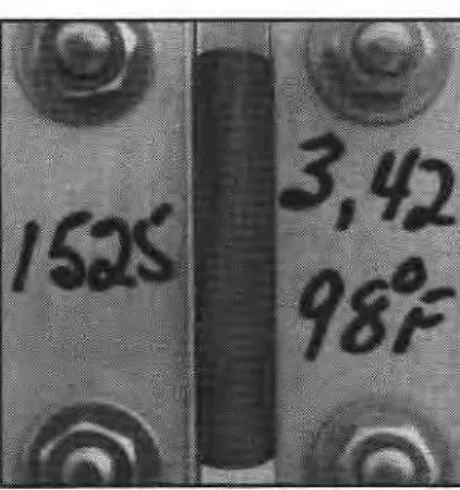
within the first two months of expo- sure for a specimen exposed where the average maximum yearly movement was k26.0 percent. Figure 12 indicates the progress of failure on the same specimen. It may be seen that the sec- ond half of the failure occurred during the third winter. Figures 13a and 13b show the sides of the same specimen exposed to the south and the north when compressed on the rack in the last summer at air temperatures of about 38°C (100°F). The adhesive fail- ure is barely visible under compression on this specimen (mostly undetectable in others). The front and back views of the specimen following removal from the rack after three years of exposure show that there was no further change after the third winter (Figures 14a and 14b).
The specimen shown in Figures 15 and 16 was exposed to k15.8 percent average maximum yearly movement. Two corners show adhesive failure af- ter two months; one remained un- changed while the other advanced with time of exposure (Figure 16a). Figure 16b shows the back of the specimen where there is hardly any failure; this specimen was held in a slightly bent position while being photographed to make the failure more visible.
The specimens
-
failed and un- changed-
were progressively removed for tensile testing; the state of those left exposed until the end of the third year is shown in Figure lob. The marks indicate failures of 13 mm (95in.) or longer through the entire depth of the bead, with failure surfaces per- pendicular to the sealant surface
2 years 3% years rposure
.
w * 4 months 6 months*
,,*3, JFC,' 2 years 3 years Instant- Ire room No. readi IreTable
I-
Extension st Tensile
Failu--
~ l n ) O.OM15 OI S1 z monrns 46- 3 years 47 Exposure without movement 2 months 2 69'
-
6 months 4 62 41 1 year 4 5 5*-
E 11 E: ,ith srraln-cyc 4 48" 6 58 37 4 7 7 dfi E E-
'Average readingFigures 14a and 14b: After three years' exp shown. Except for these specimens, all were tested and those that revealed less than or equal to 40 mm2 (0.06 sq. in.) of failure surface (developed before testing) are marked "OK" in Figure 10. The presence or absence of dust on the failure surface made possible the distinction between failure on exposure and failure on testing. Sample speci- mens were taken at intervals from evenly distributed areas of the rack so that the proportion of specimens at various yearly movements was approx- imately maintained. There were rela- tively more specimens left on the rack at the larger movements because larger failures occurred there, making tensile tests impossible. Those with failures of
% to 1 in., marked "D," were left on the rack so that the progress of further failure could be followed. These large failures developed mainly during the second winter at or above +26 percent movement. They usually showed no advance during the summer but contin- ued to advance during the third winter. Two failures developed to medium size during the final summer (at 223.8 and k24.5 percent).
osure.
The total number of specimens in Figure l o b is 26, of which five (marked "D") failed at two years of exposure, leaving 21 specimens that reached three years of exposure. Fol- lowing tensile testing of all of them, nine proved to be good (G0.06 sq. in. failure area on exposure) and five had minor failures (marked "S") of '/4 in. long or less separation at one corner and the same depth (>0.06 sq. in.). Approximately half of the specimens exposed for three years failed. When equal numbers of specimens cycled be- low and above k22 percent maximum yearly movement were compared, there were fewer failures among those cycled at less than k22 percent. The larger difference is in the appearance of the failure, which is often complete at larger movements but much less exten- sive at smaller ones.
Spring versus Fall Start of Sealant installation
To investigate spring versus fall starts for sealant exposure, twelve specimens exposed on the rack without
movement in November 1974 were transferrea to the cycling rack in May 1975. These specimens, therefore, did not undergo movement during the first winter; and their behavior was differ- ent from that of all other specimens, although they were prepared at the same time from the same batch. All reached the end of the exposure period without failure, having been subjected to strain-cycling exposure for two and a half years. The strain imposed on them varied, as it did on the other specimens: four were cycled at k12.2, four at k15.8, and four at different values between k19.4 and k27.4 per- cent. All specimens were tensile tested after exposure, but the tensile results did not reveal significant differences when compared with results obtained at other conditions because of the scat- ter in test results.
Effect of Heat Aging
Correlation of the tensile properties of heat-aged and exposed specimens was sought. The shape of the tensile curves did not change with heat aging, but failure occurred at higher exten- sions and stresses. Changes in proper- ties are best illustrated by plotting the logarithm of extensibility against the logarithm of time to reach failure, as in Figure 17, where the best fit line of the points is indicated but the actual points are omitted for the sake of clar- ity. The continuous line representing the heat-aged specimens is at higher ex- tensibility values than any of the other lines.
The slope of the best fit lines de- creases with increasing exposure time, and at two years, and after it is par- allel to that of the heat-aged speci- mens. The extensibility increase with
HTAG. 1 mo. n
-
14._=-
ALFE, 1 yr. n-
4n = NUMBER OF SPECIMENS TESTED \ b A L F E , 6 mo, n = 6
mo = MONTH ALFE. 3 yr. n = 9
HTAG = HEAT AGING. 1 MONTH
CTR = CONSTANT TEMPERATURE ROOM
ALFE = CYCLING EXPOSURE RACK
(CONSTRUCTED OF A l AND Fel
tl R E R C H : A l l
5
L U R E , m l n
Figue 17. Best fit lines of extensibility data a s function of time to reach failure. heat aging as opposed to the decrease
found with strain-cycling indicates that some of the changes taking place on heat aging are different from those of natural aging. The most likely cause is an improvement in adhesion with heat aging, requiring higher strength to break the sample and resulting in high- er extensibility. It may be concluded that heat aging is not suitable as an ac- celerated aging process for silicone sealants.
Specimens exposed without move- ment showed little change, and the best fit lines of the periodic tests (not shown) were in the region of the lines representing fresh specimens and speci- mens cycled for two years. The line of the laboratory-stored specimens stayed in the region of the line of fresh speci- mens, with the slope approaching that for heat-aged ones.
tween the sealant and the substrate or primer.
The silicone sealant installed in spring did not show failure at the end of three years of exposure because the adhesive bond was firmly established before being exposed to strain-cycling.
Acknowledgments
The author is indebted to R. C.
Seeley for his indefatigable cooperation in conducting the investigations. This paper is a contribution from the Divi- sion of Building Research of the Na- tional Research Council of Canada and is published with the approval of the division's director.
References
(1) Karpati, K. K. 1979. Revel ment of test procedure lor $$ting performance of sealants. In Plastic mortars. sealants and caulking
Conclusions compou>ds, ed. R. B. seymour;
Strain-cycling movement is the pre- ACS Symposium Series 113, pp. 4 e- "A
1 3 1 - I Y .
dominant factor that causes failure
(2) Karpati, K. K. 1974. Extension cy- during weathering of a one-part chem- cling of sealants. XI1 FATIPEC ically curing silicone sealant; outdoor Kongress. Garmisch-Partenkirchen. weathering alone is negligible. DD. i55-59.
Failure is also influenced by extent of movement, becoming more exten- sive at higher yearly strain-cycles. Ten- sile tests reveal a notable decrease in strength beyond about +22 percent movement.
For this particular silicone sealant heat aging cannot be used to accelerate weathering since the properties im- prove instead of deteriorate, as on out- door cycling. This is probably due to the establishment of a better bond be-
(3) i('arpati,-K. K.; Solvason, K. R.; and Sereda, P. J. 1977. Weathering rack for sealants. J. Coatings Tech.
49 (626): 44-47.
(4) Karpati, K. K. 1972. Mechanical properties of sealants. Performance testing of silicone sealants. J. Paint
Tech. 44 (571): 75-85.
(5) Karpati, K. K., and Sereda, P. J.
1976. Joint movement in precast concrete panel cladding. ASTM J.
Testing and Evaluation 4 (2):. 151-