HAL Id: cea-02978395
https://hal-cea.archives-ouvertes.fr/cea-02978395
Submitted on 26 Oct 2020HAL is a multi-disciplinary open access archive for the deposit and dissemination of sci-entific research documents, whether they are pub-lished or not. The documents may come from teaching and research institutions in France or abroad, or from public or private research centers.
L’archive ouverte pluridisciplinaire HAL, est destinée au dépôt et à la diffusion de documents scientifiques de niveau recherche, publiés ou non, émanant des établissements d’enseignement et de recherche français ou étrangers, des laboratoires publics ou privés.
Steady state heat exhaust in Tore Supra: operational
safety and edge parameters
R. Mitteau
To cite this version:
R. Mitteau. Steady state heat exhaust in Tore Supra: operational safety and edge parameters. Journal of Nuclear Materials, Elsevier, 2005, 337-339, pp.795-801. �10.1016/j.jnucmat.2004.10.051�. �cea-02978395�
This is a post-print to Journal of Nuclear Materials, Vol. 337–339, 2005, Pp 795-801 ISSN 0022-3115 - https://doi.org/10.1016/j.jnucmat.2004.10.051
http://www.sciencedirect.com/science/article/pii/S0022311504008177
Steady State Heat exhaust In Tore Supra :
Operational Safety And Edge Parameters
R. Mitteau, Tore Supra team
Association Euratom - CEA sur la Fusion Contrôlée, DRFC/DSM/CEA, CEA Cadarache BP1, F-13108 Saint Paul Lez Durances, France
ABSTRACT
Long pulse operation imposes severe constraints on plasma facing components. Tore Supra pioneers this operation mode, with a large area high heat flux limiter technologically repre-sentative of next step experiments divertor targets. The failure mode of the individual elements are described, along with the strategies employed to reduce the occurrence of accidents. Two are developed : the knowledge of the heat flux in the scrape off layer and particularly the ability to predict the power density on the component’s surface, and the feed back control of edge diagnostics. Emphasis is set on infrared thermography which delivers 2D+time data, particu-larly useful for the prevention of accidents. This diagnostic is sensitive to the growth of carbonaceous deposits, which are highly non uniform in Tore Supra as is presented in the paper.
1.
INTRODUCTION
Long pulse operation is increasingly recognized as a necessity for fusion experi-ments, to reinforce more vigorously the interest of the fusion road for power generation. Such operation requires an actively cooled first wall, which also opens new technological and scientific issues (plasma facing components (PFC), manu-facturing, safety margins in operation, PFC lifetime, fuel retention etc…). The last two issues favor low in-service surface temper-atures, the choice of Tore Supra. A low thermal resistance is needed, implying a reduced thickness (<10 mm between the coolant channel and the surface) and structure materials with high thermal conductivity. The reduced thickness (compared to inertial devices where amour tiles can be several centimeters thick) goes along with moderate heat capacity. Such elements have a reduced resistance to off-normal events. Moreover, inertial devices allow the tiles to reach 2000 K, thanks to the use of adequate bolts, whereas bonded
actively cooled elements hardly go beyond 1000 K to prevent melting of the metallic structure. Hence guarantying safe operation in an actively cooled experiment imposes tougher challenges than inertial devices. Tore Supra has been a leading experiment in that field for more than a decade. Opera-tional safety is developed to reduce the water leak occurrence. Key points are: • The identification of the degradation
modes of the components (section II) • The implementation of safety
diagnostics. Many, such as visible light cameras, spectroscopy and calorimetry are used to make the operation safer, further facilitated when feed-back capabilities are set up. Among all, infra-red thermography appears as very informative, due to the imaging possibility (2 spatial dimensions and time). A wide infrared coverage of the internal vessel has been installed at Tore Supra, with feed back control capability (section III).
• The ability to predict surface heat fluxes, with a precision that is commen-surate with the components technologi-cal margins (the lowest safety margin at Tore Supra is 40%). It encompasses a more general knowledge of the scrape off layer (SOL), also required for the various plasma losses to the wall caused by the additional heating systems. These losses carry a small fraction of the power but can be very concentrated (Section IV)
• The apparent power density on the PFC deviates from the models, due to the occurrence of carbonaceous deposits. The preliminary observations based on infrared measurements are presented section V.
The aim of the collective effort toward operational safety is to be able to guarantee a safe and predictable operation domain with a reasonable confidence.
2.
TORE SUPRA ACTIVELY
COOLED COMPONENTS
OPERATION
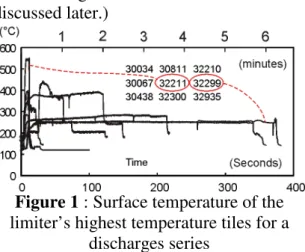
Tore Supra is a circular superconductive Tokamak designed during the mid-eighties, dedicated to study the physics and technol-ogy of long pulses (~1000s). All PFC where refurbished in 2000 to extend the duration capability (project Composants Internes Et Limiteur, [1]). The main heat exhaust component in Tore Supra is a toroidal pumped limiter (TPL) extracting typically half the injected power, the rest being retrieved by the vessel liner or shadowed secondary components. The high heat flux elements consists in carbon composite armor tiles, bonded to a hardened copper alloy heat sink cooled by pressurized water, a concept which has been researched at Tore Supra for 15 years [2]. The same materials have been chosen for the ITER divertor targets with a thick macrobloc structure. The surface temperature of the hottest tiles of the limiter are reported in Fig. 1 for a series of typical discharges, showing the record injected energy of 1.07 GJ performed
in 2003 [3] as well as the most powerful discharges of 9.6 MW where the limiter peak heat flux reaches 5 MW/m2. (Due to the extended time scale on the abscissa, it is not visible that the temperature reaches steady state during the first few seconds of that discharge. The heat flux evaluation is discussed later.)
Figure 1 : Surface temperature of the
limiter’s highest temperature tiles for a discharges series
The limiter behaves according to design (Fig. 2), about half way to the nominal per-formance (25 MW injected, 10 MW/m2 peak heat flux). The performances presented Fig. 1 are limited by the capability of the additional heating systems and do not represent the TPL limits. Their extension (CIMES upgrade) is under way [4].
Figure 2 : Surface temperature increase of
the limiter’s highest temperature tiles as a function of the power injected into the
plasma.
The TPL elements are the most exposed of Tore Supra, and their failure modes have been extensively studied. They can be divided according to the failure conse-quences : with immediate ones and with delayed ones. The first category is associ-ated with a heat flux excess for a duration
longer than the structure thermal time constant (τ). Single energetic events short relative to τ are not critical unless they are repetitive, a feature not encountered at Tore Supra due to the absence of ELMs.
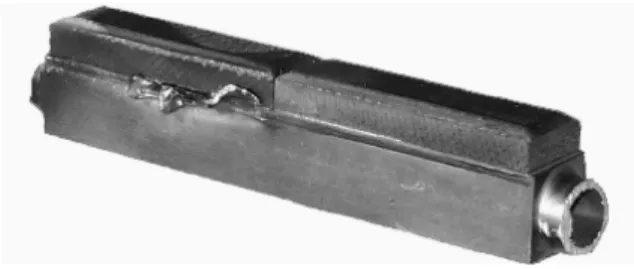
There are 2 excess heat flux failure modes (a) The critical heat flux, where boiling sets up in the cooling channel, reducing dramat-ically the heat transfer to the coolant. This leads to the melting of the metallic structure and to a water leak in the vessel. (b) The de-bonding of the tile. The fracture of the mechanical bond is associated with a dramatic increase of the structure thermal resistance. The behavior of the tile becomes then inertial (radiative cooling). With the macrobloc technique, the tile stays in place and continues to protect the metallic structure from the plasma. This has also been observed twice with the flat tile tech-nology, one in the high heat flux test facility EB200 and one in Tore Supra (Fig. 3). It is however questionable how long such a tile might stay in place under repetitive cycling. An inertial tile is a weak link in the device ,and evolves in two phases. Firstly, the tile cooling is assured by radiation all over the vessel. The high temperatures attained led to material evaporation and erosion, causing surface recession (self-shaping). Progres-sively, the system enters the second phase where the incident heat flux reaches the adjacent tile due to the grazing incidence angle, with a two-fold increase of its heat load.
Figure 3 : Photo of the failed element of
the former inner bumper, damaged during low density operation : the interlayer has
melted while the tile remained in place. The prevention of those risks for the TPL imposes a limit on the incident heat flux of 18 MW/m2.
The second category is associated to delayed risks because it is also desirable to assure a regular operational capability during a given duration. They are related to the aging of plasma facing components. Two are of concern (a) Bond fatigue, caused by the thermal cycling, which causes plastic deformation of the surrounding materials. The bond deteriorates and its thermal resistance increases with the cycle number. For a given heat flux, the surface tempera-ture stabilizes at a higher value than normal elements. If the deterioration is not homo-geneous over the bond, the risk of critical heat flux increases due to the narrowing of the thermal bridge between the amour and the structure. A heat flux under 10 MW/m2 allows 104 full power cycles [2]. (b) Erosion : the uncertainties associated with the life time evaluation lead to imposing a limit on the maximum surface temperature of 1000K.
When an increasing number of bonds are damaged (either partially or completely), the overall first wall thermal resistance increases. It approaches gradually the behavior of a conventional inertial tokamak. The operating domain becomes narrower, either in terms of maximum admissible heat load (hence injectable additional power) or in term of discharge duration.
Since the CIEL start in 2001, some inci-dents have perturbed the operation of Tore Supra. Most of them are associated to secondary limiters and to off-normal loads that are insufficiently known. Although these events were rather perturbing for the experiments, they do not jeopardize the design of the limiter which is proving to be a very resilient component for the steady state extraction of the power.
3. IR MONITORING
Due to the importance of PFC surface tem-perature or heat flux measurements, infra-red thermography appears to be the most suitable tool to increase operational safety. Tore Supra is equipped with 7 endoscopes, described in [5]. The temperature is measured with infrared focal plane array
cameras having the remarkable ability to deliver temperature maps between room temperature and 1500°C within a single range, an achievement that was initiated in industry for the need of Tore Supra. This characteristic is based on a triple exposure during one camera cycle, with different integration durations. The first one of 340 µs delivers the temperatures between RT and 300°C, the second one of 65 µs the tem-peratures between 300 and 800°C, and the last one of 11 µs the temperatures over 800°C. Each frame out of the three expo-sures can include areas which are under or overexposed. For each pixel, the camera electronics chooses the best integration time. A single frame is reconstructed, containing the full dynamic range. This technique, combined with the rather low overall transmission of the endoscope (typically 25%) requires a meticulous cali-bration. The optical elements are associated in three homogenous groups, the sapphire window at the vessel temperature (usually 120°C), the optical head at 30°C and the endoscope body at 20°C. The temperature is deduced from the radiance given by the camera by subtracting the spurious contri-butions of each group, using the calibration data established in laboratory using a black body. The acquisition system allows feed back control capability, based on the maxi-mum surface temperature of up to 12 pre-defined zones of interest per camera. The current design aims to reduce the additional power before the maximum surface temper-ature is reached, and to trigger a soft termi-nation of the plasma when the maximum surface temperature is reached.
4. LIMITER HEAT FLUX
The heat flux foot print on the limiter has been well documented since the CIEL start in 2001 [6]. It can be split between plasma conduction/convection and supra-thermal losses.
4.1 observations of plasma convection The majority of the plasma convection arrives on the TPL. The heat pattern is strongly influenced by the ripple of the
toroidal magnetic field with the conse-quence that the pattern has the periodicity of the toroidal field (TF) coils (20°). Two areas of heat flux concentration are present in a pattern period, one on the ion drift side, one on the electron drift side. The separation between the two heat flux legs is a cosine-like frontier drawn on the TPL surface. Above the TF coils, the entry and exit of field lines gives birth to private flux regions where only radiation and charge exchange heat the surface. This pattern has been modeled with the heat flux deposition code TOKAFLU [7] based on the cosine model [8] and validated by infrared emission of the limiter surface [6].
The TPL surface temperature increase is only a function of the incident heat flux and not of the time (Fig. 1,2). The maximum heat flux depends mainly on the injected power, showing that this parameter is the first one to consider for surface temperature scaling. Other parameters (plasma current, toroidal magnetic field, plasma shape, position etc…) do have an influence too and no simple scaling can be derived, making mandatory the use of a heat flux deposition code like TOKAFLU.
The distance between temperature maxima on the limiter is characteristic of the heat flux decay length (λq) that has to be set in the cosine model to reproduce the heat pattern. It is evaluated to be 5 mm on the TPL. This value is 4 to 6 times smaller than the λq in the SOL, which is evaluated to be between 20 and 30 mm by two independent diagnostics [9]. This "far SOL" λq hence appears improper to model the limiter heat flux. As a consequence, the deduction of the power extracted by a secondary compo-nent from the power extracted by the main limiter presents too large errors to be of any use for operational safety. The simple SOL model assuming a constant λq in the SOL and on the PFC proves too limiting for that objective.
Another feature of the plasma convection on the limiter is that the heat flux cannot be modeled by one single heat flux component along the field lines. A cross field fraction
has to be added to the cosine model. The heat flux is then written as :
α ⋅ ϕ + α ⋅ ϕ = ϕ λ δ − ⊥ λ δ − cos e sin e q 0 q 0 // (1) where 0 //
ϕ is the heat flux along the field lines at the last closed flux surface (LCFS),
0 ⊥
ϕ is the heat flux across the field lines at the LCFS, δ is the distance from the limiter to the LCFS, λq is the heat flux decay length and α the incidence angle. In Eq. 1, the first term corresponds to the cosine model, the second term is the contribution of the cross field heat flux.
The parallel power deposed on the limiter P// can be expressed as =
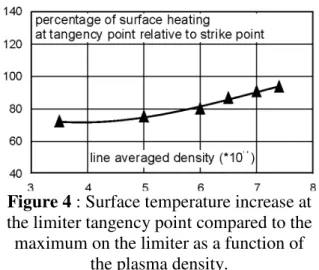
ϕ ⋅ α λ δ − iter lim 0 // // e sin P q(2) and the cross field power as
ϕ ⋅ α = λ δ − ⊥ ⊥ iter lim 0 cos e P q (3). On the TPL, P// and P⊥ have the same order of magnitude [6]. Another evaluation of ϕ⊥ is given by the percentage of surface temperature increase in the valley between the two heat flux max-ima, of 80% instead of zero if the heat dep-osition were purely parallel (Fig. 4). Few variations are observed with the plasma density, and further scans with other param-eters still show that the local cross field heat flux fraction varies remarkably little. Over the years, the three major classes of limiters have been researched on Tore Supra, namely localized limiter (mushrooms, 1993-1996 ; poloidal x toroidal dimensions = 0.4 m x 0.4 m), large area bumpers (inner first wall, 1988 - 1999 ; 2.5 m x 10 m) and now the TPL which is an intermediate case (since 2001, 0.5 m x 15 m). Although the fraction of cross field heat flux is almost constant with different plasma conditions for each limiter type, large variations (between 0 and 100 %) are observed between the different types.Figure 4 : Surface temperature increase at
the limiter tangency point compared to the maximum on the limiter as a function of
the plasma density.
A very good agreement is observed between the number of directions (poloidal and/or toroidal) along which the plasma is close to the limiter and the amount of cross field heat flux. These results are summarized in table 1.
limiter size (1) (2) remark modular limiter 0.5 x 0.5 m² 0 0 no cross field heat flux is necessary inner bumper 2 x 10 m² 100 2 cross field heat flux is sufficient TPL 0.5 x 15 m² 50 1 mixed case
Table 1 : correspondence between limiter
size and cross field power fraction. (1) percentage of cross field power needed to reproduce the thermal pattern observed by infrared cameras ; (2) number of directions
of extension of the limiter (toroidal or poloidal)
The smaller the limiter surface, the better the simple cosine model fits the thermal pattern. At the other end of the scale, large area limiters are dominated by cross field heat flux. Finally, the cross field heat flux appears primarily governed by the large scale geometry of the first wall rather than plasma intrinsic characteristics. This is strongly limiting in those models that spatially average the cross field transport in the SOL for power deposition modeling. Advanced modeling based on a Monte Carlo principle is underway to address this issue [10].
This section shows that the heat flux pattern on the main limiter is accessible to models,
provided the correct λq and fraction of cross field heat flux are set. However, using addi-tional heating modify this heat pattern, and further heat flux profiles have to be accounted for.
4.2 suprathermal losses to the wall
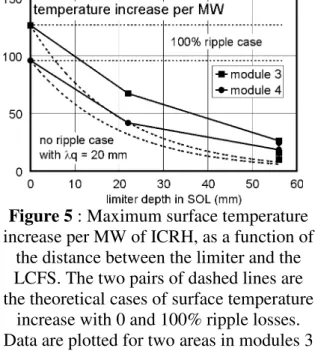
These losses have a small influence on the global power balance, because they carry a minor percentage of the injected additional power. But they are concentrated and locally the heat flux density can reach the same order of magnitude as from the plasma convection. These mechanisms are docu-mented [11-14] but have new manifesta-tions in the CIEL configuration. The lower hybrid (LH) heating causes populations of suprathermal particles, but emphasis is set here on the ion cyclotron resonance heating (ICRH) which has a strong influence on the heat pattern. It is then dominated by one unique concentration area at the tangency point between LCFS and limiter. The surface temperature scaling as a function of additional power is 10-20% higher than with lower hybrid alone. This is attributed to ion ripple losses, and has some relevance for ITER because of the relationship to alpha particles losses. The heat flux is not caused by direct losses, which was verified by having similar discharges with the inner bumper as main limiter. In this configura-tion, the plasma convection and conduction are directed toward the inner bumper and the TPL is heated by the ripple losses. By varying the distance between the LCFS and the limiter, it is possible to distinguish between the convection / conduction and the ripple losses. During this series of discharges, the maximum TPL heat flux was reduced by a factor of 4 when the limiter depth in the SOL was increased from 0 to 56 mm (Fig. 5). This indicates that the excessive heating of the TPL during ICRH discharges cannot be attributed to a high fraction of ripple losses. An increase of the sheath transmission factor caused by the energetic ions’ impact on the TPL is currently the first candidate mechanism.
Figure 5 : Maximum surface temperature
increase per MW of ICRH, as a function of the distance between the limiter and the LCFS. The two pairs of dashed lines are the theoretical cases of surface temperature
increase with 0 and 100% ripple losses. Data are plotted for two areas in modules 3 and 4 (modules are 60° toroidal sections of
the TPL).
5. CARBONACEOUS DEPOSITS
Deposits have been first suspected after the infrared images of low heat flux regions (deduced from the modeling) presented increasingly higher temperatures than heat flux concentration areas. Carbonaceous deposits are an issue which is gathering more and more focus, primarily due to their ability to store high quantity of hydrogen, linked with the theme of retention [15-16]. For the operational safety, these deposits are also unfavorable because they hide the surface temperature of the actual compo-nent, hindering the expression of the surface temperature as a heat flux. A visual inspec-tion of the limiter surface in 2003 indeed showed the presence of deposits, at locations where the infrared images showed over-heating. The deposits are of two kinds: • dust having the form of sub-millimeter flakes. It is loose and is easily removed by aspiration (although the infrared images that where obtained afterward still showed overheating areas, indicat-ing that aspiration didn't remove all the dust)
• hard layer on the side of the gap between the tiles. This layer holds firmly to the tile.
The two kinds of deposits are interpene-trated. In both cases, the deposit grows in shadowed areas. For the loose dust, it corre-sponds to the private flux region at the surface of the limiter, for the hard layer to the shadow in the gaps.
Quantitative infrared measurements confirm the presence of deposits. The thermal time constant (τ) in suspected deposit locations is in a range of 0.2 to 0.5 seconds, significantly shorter than the expected 1+/-0.3 second, calculated for the TPL elements and observed on a high heat flux facility .
Even the tile surface in the areas of strong plasma surface interaction is influenced by layers. τ is here 0.4 s, still smaller than 1 s. A further indication is that the incoming power on the limiter (evaluated from the IR data to be 1142 kW), is 42% higher than the value evaluated from the calorimetry diag-nostic. In this evaluation, the area of known dust is extrapolated from the rear of the elements.
The modeling of the deposits’ thermal behavior can be split between two diametri-cally separated cases, although there actually is a continuum of models with all possible mixed cases.
1. The isolated, capacitive layer with a purely radiative cooling (limit case for the flakes).
2. The conductive layer (limit case for the hard layer).
For case 1, the flake reaches a temperature where the incident flux can be equilibrated by radiation of the two faces.
The ∅D model (Fig. 6) supposes that the rest of the machine is at the coolant temper-ature, an approximation justified in an actively cooled tokamak like Tore Supra where the hot surface (2 m²) area is small compared to the overall size of the wall (100 m²). The equilibrium temperature depends only on the incident heat flux. For heat fluxes under 0.1 MW/m2 the steady state surface temperature remains under 600°C.
Figure 6 : Stabilization temperature and
thermal time constant of an isolated layer over an actively cooled plasma facing
component.
The thermal time constant depends on the incident heat flux and on the thickness of the layer, but it can be small or close to the limiter thermal time constant itself so that it helps little to reveal such an inertial behav-ior from the IR data alone.
Figure 7 : The surface temperature of an
area of the TPL, with two times constant of 0.3 and 0.7 s.
Case 2 has a behavior closer to the one of a regular structure. The stabilization temper-ature is a function of the total thermal resistance. The time behavior may deviate from an exponential (Fig. 7), due to the existence of more than one thermal time constant if they are sufficiently different but still measurable (the one of the regular structure and the one of the layer). In the two cases, the deposit leads to higher surface temperatures than expected, and τ
helps little to evaluate the possible over-estimation.
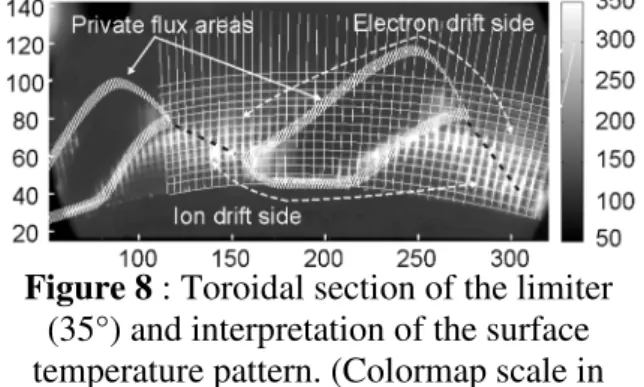
Figure 8 : Toroidal section of the limiter
(35°) and interpretation of the surface temperature pattern. (Colormap scale in
Celsius.)
The introduction of the in-situ examination maps helps to interpret the infrared images. A toroidal section of 35° is represented (Fig. 8), along with the tiles delimitation. The private flux regions are approximately located by the white dashed areas, the inter-est of precise delimitation being reduced by shape change caused by varying plasma parameters. The hottest areas are close to the edges of the private flux region and the edges of the tiles. The mapping justifies the use of the infrared images, and allows deduction of heat fluxes from surface tem-perature in areas of minimal perturbation. 6. CONCLUSION
Infrared measurements are extremely important for Tore Supra’s operational safety. Major advantages are the fact that they give the surface temperature, a measurement strongly linked to heat load, and the 2D + time capability which is very informative. The interpretation of the infra-red images has however to separate three mixed phenomena :
• Heat pattern description, including λq and ϕ⊥ evaluations,
• Supplementary loads by additional heating.
• Occurrance of carbonaceous deposits with strongly different thermal behavior. This unknown multiplicity hinders the analysis of the large amount of data produced. One developing method consists
of determining the deposits properties while knowing the incident heat flux (active heating during off-plasma phases), using reverse engineering methods. The installa-tion of high resoluinstalla-tion optics in one endo-scope is planned, and will help to resolve the transition from loose dust to adherent layer. Finally, an increasing confidence with infrared data interpretation could enable the activation of an electronic inter-lock between the infrared diagnostic and the plasma control, providing feed back control capability which should be a significant help in the achievement of higher power experiments.
REFERENCES
[1] Fusion Engineering and Design, vol. 49-50 (2000) p.89-95 (2000)
[2] Fusion Engineering and Design, vol.39-40 (1998) P.235-240 (1998) [3] Nucl. Fusion 44 (2004) L11-15 [4] Fusion Engineering and Design,
vol.56-57 (2001) p.667-672 (2001) [5] Nucl. Fusion 43 (2003) 797-804 [6] J. Nucl. Mater., 313-316 (2003)
1229-1233
[7] J. Nucl. Mater., vol.266-269 (1999) p.798-803
[8] J. Nucl. Mater., 128&129 (1984) 407-417
[9] Mitteau, R. Proc of 19th IAEA Fusion Energy Conference, Lyon, October 14th-19th, 2002
[10] J. Nucl. Mater., 337-339 (2005) 395-399
[11] Nucl. Fusion 44 (2004) 181-192 [12] Nucl. Fusion, 38, N°6 (1998)
[13] Y. Peysson, R. Dumont, G. Giruzzi, et Al., Lower hybrid current drive efficiency and power deposition profile during MHD activity in Tore Supra, proc of 14th Topical Conference on Radio Frequency Power in Plasmas (2001)
[14] J. Nucl. Mater. , 337-339(2005) 831-834
[15] J. Nucl. Mater. , 313-316(2003)135 [16] J. Nucl. Mater., vol.290-293 (2001)