HAL Id: cea-03218568
https://hal-cea.archives-ouvertes.fr/cea-03218568
Submitted on 5 May 2021
HAL is a multi-disciplinary open access
archive for the deposit and dissemination of
sci-entific research documents, whether they are
pub-lished or not. The documents may come from
teaching and research institutions in France or
abroad, or from public or private research centers.
L’archive ouverte pluridisciplinaire HAL, est
destinée au dépôt et à la diffusion de documents
scientifiques de niveau recherche, publiés ou non,
émanant des établissements d’enseignement et de
recherche français ou étrangers, des laboratoires
publics ou privés.
Microfluidic platform for monitoring Saccharomyces
cerevisiae mutation accumulation
Eliet Sipos, Adélaïde Léty-Stefanska, Cyril Wilkes, Julie Soutourina, Florent
Malloggi
To cite this version:
Eliet Sipos, Adélaïde Léty-Stefanska, Cyril Wilkes, Julie Soutourina, Florent Malloggi. Microfluidic
platform for monitoring Saccharomyces cerevisiae mutation accumulation. Lab on a Chip, Royal
Society of Chemistry, In press. �cea-03218568�
Microfluidic platform for monitoring Saccharomyces cerevisiae mutation accumulation
Eliet H. Siposa, Adélaïde Léty-Stefanskab,Cyril Denby Wilkesa,Julie Soutourina*a, and Florent Malloggi*b
aUniversité Paris-Saclay, CEA, CNRS, Institute for Integrative Biology of the Cell (I2BC), 91198, Gif-sur-Yvette, France bUniversité Paris-Saclay, CEA, CNRS, NIMBE, 91191 Gif-sur-Yvette Cedex, France
*Correspondence: [email protected], [email protected]
Abstract
Mutations in DNA have large-ranging consequences, from evolution to disease. Many mechanisms contribute to mutational processes such as dysfunctions in DNA repair pathways and exogenous or endogenous mutagen exposures. Model organisms and mutation accumulation (MA) experiments are indispensable to study mutagenesis. Classical MA is, however, time consuming and laborious. To fill the need for more efficient approaches to characterize mutational profiles, we have developed an innovative microfluidic-based system that automatizes MA culturing over many generations in budding yeast. This unique experimental tool, coupled with high-throughput sequencing, reduces by one order of magnitude the time required for genome-wide measurements of mutational profiles, while also parallelizing and simplifying the cell culture. To validate our approach, we performed microfluidic MA experiments on two different genetic backgrounds, a wild-type strain and a base-excision DNA repair ung1 mutant characterized by a well-defined mutational profile. We show that the microfluidic device allows for mutation accumulation comparable to the traditional method on plate. Our approach thus paves the way to massively-parallel MA experiments with minimal human intervention that can be used to investigate mutational processes at the origin of human diseases and to identify mutagenic compounds relevant for medical and environmental research.
Introduction
Mutations are the source of the genetic diversity necessary for evolutionary changes and lead to diseases such as cancer. Mutational processes can arise from several mechanisms including dysfunctions in DNA repair pathways and exogenous or endogenous mutagen exposures. It is therefore essential to characterize the dynamics of the appearance of mutations on the genomic scale. The yeast Saccharomyces cerevisiae is an excellent unicellular eukaryotic model to study mutagenesis and to isolate the contribution of DNA transactions and mutagen factors on mutational processes. There are powerful genetic and genomic tools available to study this species, and it possesses a compact genome and a short generation time compared to human cells.
There are two main methods used to study mutation rates: the fluctuation assay and the mutation accumulation (MA) method. The fluctuation assay measures the mutation rate indirectly by counting the number of mutants of a selective marker within a population of micro-organisms by plating of the population on a selective medium. However, the mutation rate obtained is limited to the scale of a single gene, which is the selectable genetic marker1. This rate is therefore not representative of the whole genome mutation rate2, 3.
MA experiments are the most suitable to investigate mutagenesis at the genomic scale and to estimate unbiased mutational profiles4, 5. This approach consists of propagating cell populations through repeated bottlenecks to minimize the efficiency of selection. In contrast to adaptive evolution with continuous cultures or serial dilutions, these bottlenecks lead to the fixation of arbitrary mutations without respect to their effect on fitness. Coupled with high-throughput genome sequencing, this allows mapping spontaneous mutations in an essentially unbiased fashion, giving a direct estimate of the mutational rate. Since mutation rates are typically very low (as low as ~10-10 events per position per generation in wild-type yeast) and differ widely between mutation types, many lineages need to be propagated in parallel in order to characterize mutational profiles with precision. Several replicates are passed through a fixed number of bottlenecks to drastically reduce the population to one cell. These bottlenecks decrease genetic diversity and minimize natural selection. Once cells have been passed through a specific number of bottlenecks, their whole genome is sequenced (MA-WGS). Therefore, the probability of a mutation accumulation is linked to the random bottlenecks and not to the effect that a mutation has on fitness. Most mutations measured in the MA experiment, except the lethal and deleterious ones, are present at a rate close to their mutation rate. Most of our understanding of the fundamental properties of spontaneous mutation rates has been gained from the analysis of MA experiments6. However, classical MA experiments are time intensive and laborious since cells are propagated by repeated plating on agar plates and bottlenecks are implemented by randomly picking a single colony at each step, which takes 2 days for budding yeast at 30°C. In total, more than 6 months are necessary to achieve 100 single-cell bottlenecks in yeast MA experiments. In addition to being time consuming, the human intervention required every 48 hours (the time necessary to form individual yeast colonies) introduces bias, as there could be a non-random choice of a colony that could lead to the selection of mutants with the greatest fitness. For example, the largest colony, which could be chosen over a
smaller one, might have acquired an advantageous mutation. In this case, the mutation rate measured does not correspond to the spontaneous mutation rate. Moreover, human intervention can modify the environment of cell growth by introducing bacterial or fungal contamination. For these reasons, MA experiments are seldomly used, reducing the number of insights on spontaneous mutation rates in unicellular and multicellular organisms. Given the essential role of mutations in evolution and disease, it is crucial to facilitate genome-wide MA studies by developing an automated and high throughput approach. Since its origins in the early 1990s, microfluidics has simplified laboratory handling through the automatization of experiments. Microfluidics is recognized as a promising technique due to its high throughput, low material consumption, low cross contamination and the small amount of sample needed for analysis7. In recent years, biology has taken advantage of the possibilities offered by microfluidics8, 9. The use of microfluidics for cell culture has enabled many novel applications in diagnostics10, tissue engineering11, organs-on-chip12, 13, cell trapping14 and single cell analysis15. More specifically, automated microfluidic devices have been designed to study the complex mechanisms of single-cell aging in haploid and diploid yeast cells, clearly emphasizing the importance of microfluidics to transform tedious and time-consuming approaches16-18. For example, Wang et al. reported the culture of yeast cells in linear arrays of microfluidic chambers. Cells would grow to fill a chamber and then enter a narrow canal to colonize empty chambers downstream19.
Inspired by this pioneering work, we developed an automated microfluidic-based approach for MA coupled with high-throughput genome sequencing using the yeast S. cerevisiae. To validate our approach, we performed microfluidic MA experiments on strains with two different genetic backgrounds: a wild-type strain and a strain with a deletion of UNG1 gene, which encodes the uracil-DNA glycosylase involved in base-excision DNA repair (BER), characterized by a well-defined mutational profile. This unique experimental tool reduces the time necessary for genome-wide measurements of mutational profiles by one order of magnitude, paving the way to massively-parallel MA experiments with minimal human intervention.
Materials and methods Paternal genotype
The paternal strain used for the MA experiments was a haploid strain YPH499 (MATa ura3-52 lys2-801_amber ade2-101_ochre trp1-Δ63 his3-Δ200 leu2-Δ1). This strain carries the mutation ade2-101, which confers a red colour to the colonies in the presence of oxidative respiration20. The colour marker allowed visual screening for the presence of defects in oxidative respiration typically seen in the mitochondrial petite mutants.
Deletion of the ung1 gene was made by the PCR-based epitope tagging method using the plasmid pFA6-natNT221. The PCR-amplified DNA fragment, which contains the natNT2-selectable marker flanked by the upstream and downstream sequence of the ORF of interest, was transformed into the YPH499 strain. The gene deletion was verified by PCR.
Manual mutation accumulation line establishment
For each genetic condition, four parallel mutation accumulation (MA) lines were derived from a single parental strain and subjected to 100 single-cell bottlenecks manually. The manual single-cell bottleneck was performed by randomly selecting a colony and streaking it to obtain single colonies on yeast extract/peptone/dextrose (YPD) agar plates for 48 hours at 30°C. In 48 hours, 21 generations of yeast can grow on the YPD medium at 30°C. For a total of 100 bottlenecks, around 2100 generations grew. The mitochondrial mutation was screened out using the red colour phenotype. Small white colonies were considered to contain the petite mutation and were screened out whilst average red colonies were selected.
Microfluidic device fabrication
The mutation accumulation device was fabricated using standard PDMS soft-lithography replica moulding techniques22 with a Si/SU8 master mould. Photolithography was performed using three layers to make chambers and channels of different heights. The Si/SU8 master was prepared by spincoating SU8 photoresist (1st layer: SU8-2002 at 1000rpm; 2nd layer: SU8-2005 at 2500rpm; 3rd layer: SU8-2015 at 1500rpm; Chimietech, France) with a spincoater (SPIN150, SPS-Europe) onto a Si wafer (diameter 4”, Sil’Tronix Silicon Technologies). After spincoating, microstructures were created by photolithography (UV-KUB, KLOE, France). To create a photomask, the device structure was designed with a computer-aided design program and printed onto a flexible polyester film by a commercial service (JD Photo Data, UK). The master was then replicated into polydimethylsiloxane (PDMS) by casting Sylgard 184 prepolymer base and curing agent (Neyco, France). They were mixed at a 10:1 ratio, poured onto the mould and kept at 60°C for at least 2 hours. The cured slab was then peeled off from the mould. Holes of 3 mm and 1.5 mm were punched (biopsy puncher, VWR) to define cell inoculation, nutrient and waste channels, respectively. Before bonding, the surface of the PDMS and the cover glass were treated with oxygen plasma for 1 minute (CUTE, Femto Science Inc, South Korea). Plasma is used to activate and also to sterilize the surfaces prior to bonding. Before cell culturing, all tubing was sterilized with ethanol (70%) for at least 10 minutes. Before inoculation, a flow rate of at least 8μL/min of liquid YPD was established with the microfluidic flow control system (FLOW-EZ) coupled to a flow rate platform (Fluigent, France).Cells were then inoculated with a sterile cone in the 3 mm holes within a sterile environment and the holes were sealed with a sterile adhesive plastic23 (ThermalSeal RTS). The sterilization of the chip and tubing, as well as the use of
sterile materials for cell inoculation and hole sealing, were essential to avoid contamination over the long duration of the MA experiments.
Microfluidic microscopy
Cell line propagation monitoring was performed by fitting the microfluidic chip on an inverted microscope (IMT-2, Olympus) with a computer-controlled camera (pixelfly, PCO, Germany). For time-lapse experiments, the microdevice was fitted with a homemade heated sample holder maintained at 30°C during experiments. Time-lapse images were collected every minute using Micro-Manager software (Open source Microscopy Software [https://www.micro-manager.org/]). For long-term experiments, i.e. several months, devices were put into a dedicated incubator.
Microfluidic mutation accumulation experiments
After cell loading, cell medium was continuously injected at a flow rate of 8μl/min and the device was kept at a temperature of 30°C. Cells were continuously sustained with YPD liquid medium supplemented with the antibiotic Chloramphenicol at a concentration of 2 μg/mL to prevent bacterial contaminations. The YPD-Chloramphenicol liquid medium flowed from the nutrient channel to the waste channel. The flow of the nutrient channel was created in the opposite direction of the growth of the cells. This way, the growing cells downstream received fresh media unaffected by cell waste. Moreover, the pressure from the liquid flow kept cells in their chambers to allow for sequential occupation of chambers.
Once the upstream chamber was fully occupied, only a single cell could enter the connecting path, creating a single cell bottleneck. Cells grew in the connecting channel and entered the second chamber (see Results section for details).
Next generation sequencing
MA lines obtained by classical plating and microfluidic approaches were conserved in a frozen stock and streaked on YPD medium for 48 hours at 30°C. In addition, the parental strains were also included in genome sequencing analysis. Colonies were then inoculated from the solid medium onto 10mL of liquid YPD overnight at 30°C on a 180 rpm shaking incubator until saturation. Cells were then pelleted and resuspended in 200 μL of a buffer containing 10mM Tris-HCl pH 8.0, 1mM EDTA, 100 mM NaCl, 1% SDS, 2% Triton X100, for DNA extraction with glass beads (Sigma Aldrich) and Phenol:Chloroform:Isoamyl Alcohol (25:24:1) (Sigma-Aldrich) and vortexed at room temperature for 10 minutes. 200μL of Tris-EDTA (Sigma-Aldrich) buffer was added and this was centrifuged at 9000g for 5 minutes at room temperature. The supernatant was then precipitated with twice the volume of cold absolute Ethanol (VWR Chemicals) and 0.1 volume of 3M NaOAc (Sigma Aldrich). The solution was precipitated for 20 minutes at -80°C, centrifuged at 4°C and the pellet was washed with cold Ethanol 70% (VWR Chemicals) and then resuspended in water. The solution was treated with RNAse at 50μg/mL (Thermofisher Scientific) at 37°C for 1hour. The solution was precipitated with Ethanol for 20 minutes at -80°C, centrifuged at 4°C and the pellet was washed in cold Ethanol 70% (VWR Chemicals) and then resuspended in water. DNA was quantified using a Nanodrop instrument (Thermoscientific), and genomic DNA samples from 4 parallel MA lines for each strain were merged in equal quantities for library preparation. The DNA was then sonicated with a Covaris sonicator using the program with a duty factor of 10%, peak incident power of 175W, cycles per burst of 200 and a time of 180 seconds. Library preparation for genomic DNA was performed on an IP-Star system using the MicroPlex Library Preparation Kit v2 (Diagenode), following the manufacturer's instructions.
Bioinformatic analysis of genome sequencing data was performed using the following procedure. Reads were first trimmed with cutadapt (v1.12) then mapped on the reference S. cerevisiae genome of the S288C strain (University of California at Santa Cruz [UCSC] version sacCer3) using bowtie2 (2.3.4.3) (with the "very-sensitive parameters" setting). Files were converted and filtered using Samtools (v0.1.18; minimum mapping quality set to 10, PCR duplicates were discarded with the “rmdup” option). The number of mapped reads for each experiment is indicated in Supplementary Table S1. The GATK (Genome Analysis Toolkit, v4.1.3.0) variant calling pipeline (Broad Institute), in particular HaplotypeCaller, was used to identify SNP and small Indels variants. All positions with more than 1 variant were removed. Variants were kept if observed on more than 2 reads on a position covered by more than 12 reads. Sequence variations recurrently found in MA lines and parental strains corresponding to constitutive variations between the reference S288C strain and the wild-type yPH499 strain or ung1∆ strain used in this work were filtered out. All retained SNPs can be found in Supplementary Excel file 1-ESI. The genome sequencing data have been deposited to the ArrayExpress repository under the access number E-MTAB-10259.
Results
Design of the microfluidic system for yeast MA experiments
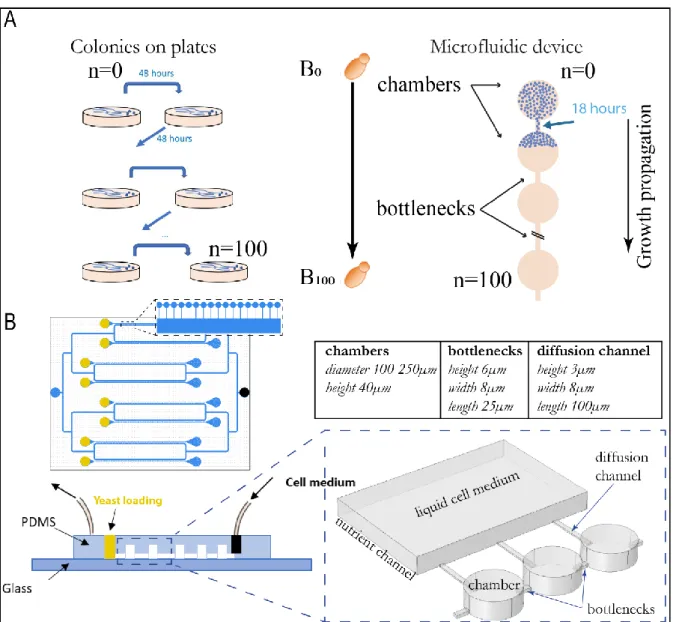
In order to replace the classical colony plating approach with an automated system, we developed a PDMS-based microfluidic device comprising linear arrays of culture chambers. Each chamber allows the growth of a yeast population over many generations, after which a narrow channel creates a bottleneck that permits the passage of only a single cell to populate the neighbouring chamber downstream (Figure 1A-Right). Thus, the microfluidic MA experiment consists of growing cells
sequentially in a microfluidic chamber that corresponds to the single colony-forming units in the manual experiment. Cells grow to occupy the chamber fully before being physically constrained by a small channel that allows only one cell inside. The small channel physically-constraining the growth of cells creates a single-cell bottleneck, and thus only one cell reaches the downstream chamber. The device geometry, terminology and dimensions are shown in Figure 1B. The yeast growth in each chamber is monitored by standard light microscopy. At the end of the device, yeast cells are collected for genome sequencing. In order to maintain the growth of yeast over many generations for up to 4.5 months, nutrient channels linked to the culture chambers by small channels similar to those of bottlenecks (named diffusion channels) were included in the microfluidic design as visible in Figure 1B. A pressure box connected to a flowmeter controls the flow of nutrient into the microdevice. Importantly, our microfluidic design improves the classical MA experiments by reducing the time of the experiment from 6 months using the manual method down to as short as 1 month. Moreover, this approach automates the step of hand-picking of a single colony, and therefore reduces the bias associated with human intervention. The final improvement is the parallelization of the mutation accumulation experiment by operating up to 8 MA lines simultaneously on the same microfluidic chip. This allows replication of the same experiment and increases the accuracy of mutational profile characterisation (see inset Figure 1B).
Figure 1. A. Principle of mutation accumulation experiments on plate and with the microfluidic approach. B. Description and geometrical characteristics of the microfluidic platform.
Analysis of hydrodynamic flows within the nutrient channel and culture chambers
Numerical simulations of hydrodynamic flows in the microfluidic device and flow experiments using particles or fluorophores were performed to analyse the steady-state flow within the chip after reaching equilibrium (Figure 2). We used the Fluid Flow module of COMSOL Multiphysics software to model the flow inside the microfluidic device.
Figure 2. A. Numerical simulation of the flow in the microfluidic chip. Most of the flow is in the nutrient channel with a maximum of ~30mm/s (total flow rate of 8µl/min). A fraction of this flow passes through the chambers as shown in the stream lines and velocity vector insets. B. Experimental visualisation of the flow by seeding the fluid with fluorescent microparticles. The moving particles in the central flow form blurred segments which indicate a high flow rate. Conversely, particles stuck in the chambers indicate no or a weak flow (see also Video M1-ESI). C. Experimental visualisation of the nutrient diffusion through the chambers.
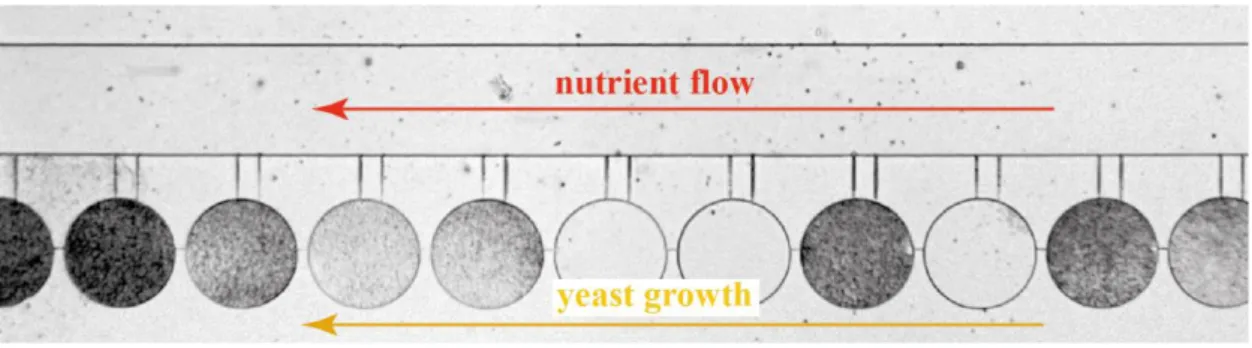
Numerical simulation of the velocity field clearly indicates that the flow is situated mainly in the nutrient channel. Only a very small fraction of the flow goes into the culture chambers as illustrated by the streamlines and velocity vectors from the simulations. Due to the small velocity inside chambers, we also plotted the normalized velocity vectors for easier visualisation (Figure 2A, insets). It is important to note that the slight flow in the culture chambers ensures the sequential colonisation of the chambers since yeast can only pass into the next chamber when the previous chamber is fully occupied (see FigureS1-ESI). Experiments in which the nutrient flow was reversed (yeast growth and flow in the same direction) show that the yeast cells colonize the chambers in a non-linear manner (see FigureS2-ESI). Yeast divide by budding, so when the yeast growth and the flow are in the same direction, the daughter cells can detach themselves from the mother yeast and then be dragged away by the flow. To avoid this situation and to ensure the sequential colonisation of the chambers in MA experiments, the flow was always applied opposite to the direction of yeast growth.
These simulation results suggest a hydrodynamic decoupling of the nutrient channel from the culture chambers, which was further confirmed experimentally. By seeding the nutrient channel with particles of 2 μm, we observed that the flow occurred mainly in this channel and that the few particles present in the culture chambers did not move, at least within the time of this experiment (Figure 2B and Video M1-ESI). To evaluate the diffusion of the growth medium between the nutrient channel and the culture chambers, the fluorophore fluorescein was introduced into the nutrient channel (Figure 2C). We first observed fluorescence in this channel, and after 10-20 seconds the culture chambers also became fluorescent, confirming that the fluorophore diffused into the chambers. In other words, fresh nutrients arrive in the chambers every 10-20 seconds. Following Fick’s law, these experimental results are in agreement with a rapid estimation of the diffusion time t ~L2/D. For L=100µm (diffusion channel length) and a fluorescein diffusion coefficient of D=5.10-6 cm2/s, the time required to diffuse along the entire channel is ~20s. Taken together, our results show that, by geometric construction, we have strongly decoupled the hydrodynamics of the culture chambers from the hydrodynamics of the main channel without preventing the diffusion of nutrients. Consequently, the yeast cells present in each of the culture chambers receive nutrients.
Yeast growth for MA experiments on plate and on the microfluidic chip
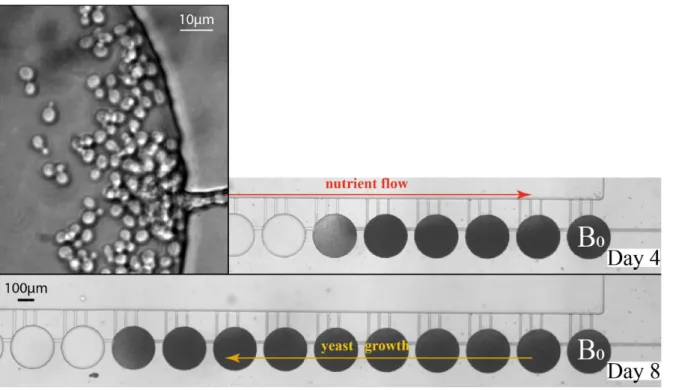
Figure 3. Time-lapse images of sequential yeast growth in a microfluidic platform with 250 µm chamber diameter. Inset. Higher magnification image of the chamber entrance.
We used the microfluidic device for mutation accumulation experiments with the yeast S. cerevisiae (Figure 3). Time-lapse imaging allowed us to follow yeast growth through the microfluidic device and to visualize cell divisions and random passages of yeast into subsequent chambers. In the example presented here, it took one day to fill a 250 µm diameter chamber. Once a yeast cell reaches a new chamber, it divides and colonizes it. It is only once the whole chamber is completely filled that passage to the next chamber is possible, as can be seen in video M2-ESI. When the image becomes darker, it means that the path through which the light passes becomes denser, and therefore in our case, that several layers of yeast are superimposed. Yeast cells might also pass through the diffusion channel and end up in the nutrient channel. Since the flow is opposite to the direction of growth, the escaped yeast cannot contaminate the upstream chambers.
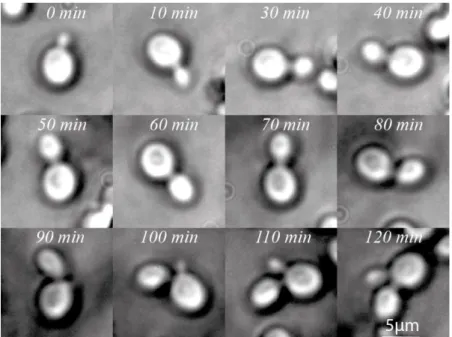
Importantly, the generation time of the wild-type strain in the microfluidic device was estimated to be between 90-100 min (Figure S3-ESI), comparable with that measured in standard growth condition in rich liquid YPD medium. However, the mutation accumulation on plate and in the microfluidic device have inherent differences regarding the number of cells that divide before a bottleneck and the time to achieve a bottleneck (see Table 1). In mutation accumulation experiments on the rich-medium agar plates, colonies of 2.26 million cells are formed in 48 hours, which represents 21 generations. The microfluidic device for mutation accumulation contains, within the 100 µm chambers, 4800 cells before the restriction of population which is formed in 20 hours and represents 12 generations (log base 2 of the total number of yeast cells). This estimate was calculated in relation to the estimated volume of a yeast and the volume of a chamber. The number of generations is an important factor to consider in the MA experiments as cells acquire mutations during the mitotic and replicative processes. Therefore, in the microfluidic device chambers there are fewer generations of cells and these could acquire fewer mutations than in the plate experiment, where there are a greater number of generations before each bottleneck.
Table 1. Mutation accumulation differences between colonies on plate and microfluidic platform. yeast diameter ~5µm
yeast volume ~65,4 µm3 generation time ~100min
Colonies on plate
Microfluidics Chamber
D= 100µm H=40µm
Number of yeast cells per bottleneck 2.26E+06 4800
Number of yeast generations per
bottleneck 21 12
Time to achieve one bottleneck 48 h ~18h-20h
100 bottlenecks 150 bottlenecks >6 months >9 months ~ 2-3 months ~3-4.5 months
Mutational analysis of MA lines on plate and on a microfluidic chip
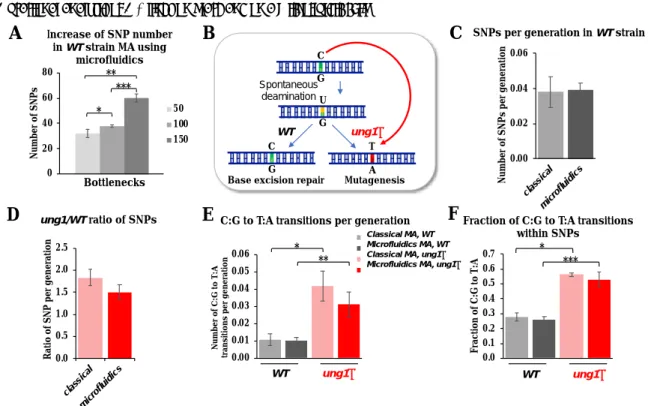
Figure 4. A. Genome-wide MA experiments in WT strain using the microfluidic device (100 µm chamber diameter). Base substitution (SNP) numbers for 50, 100 and 150 bottlenecks are indicated (mean and SEM of 2 to 4 experiments with 4 parallel MA lines). B. Schematic representation of C:G to T:A mutagenesis in ung1∆ context. C, D, E, F. Comparison of classical and microfluidics MA in WT strain for number of SNPs per generation (C), in ung1∆ strain over the WT for SNPs (D), in WT and ung1∆ strains for C:G to T:A transitions per generation (E) and fraction of these mutations within SNPs (F). Mean and SEM of 2 to 9 experiments are indicated.The asterisks represent significant differences at P-values of < 0.05 (*), 0.005 (**) or 0.0005 (***) from a Student’s t-test.
To validate the microfluidic-based approach in yeast S. cerevisiae, we first performed MA experiments with a wild-type strain growing through 50, 100 or 150 bottlenecks. Experiments with 4 parallel MA lines were repeated 2 to 4 times and the yeast cells were collected after the indicated number of bottlenecks for genome sequencing. Single nucleotide polymorphism (SNP) variant analysis of these MA experiments confirmed an increase in mutation number with MA progression (Figure 4A).
Then, we compared the genome-wide mutational profile of MA lines obtained with classical and microfluidic methods. Two yeast strains were used for MA experiments, a wild-type strain and a BER-deficient ung1∆ strain. We chose this latter genetic background since it is characterized by a well-defined mutational profile. The UNG1 gene encodes the uracil-DNA glycosylase. This enzyme is responsible for the repair of C to U spontaneous deamination events and ung1∆ strains showed an increased rate of C:G to T:A transitions24 (Figure 4B). Indeed, the uracil in DNA does not block replication and DNA polymerases can efficiently incorporate A opposite U in the template, leading to a C:G to T:A transition mutation.
The classical and microfluidic MA systems differ in the number of generations per bottleneck (Table 1). This parameter was thus taken into account to compare MA experiments. Our results showed that the number of base substitutions (SNPs) per generation was similar between classical and microfluidic methods in the wild-type context (Figure 4C). Moreover, a comparable increase in this number was observed in BER-deficient context when classical or microfluidic approaches were used (Figure 4D).
As described above, an ung1 deletion is characterized by a specific increase in C:G to T:A transitions. We therefore analysed these types of SNPs in wild-type and ung1 MA lines obtained by classical plating and microfluidic approaches. Importantly, the numbers of C:G to T:A transitions per generation were similar between the two approaches in wt context and a near 3-fold increase was observed in ung1 context for both approaches (Figure 4E). As expected, the fraction of C:G to T:A transitions within SNPs was close to 0.25 in the wild-type context and was increased in the ung1 deletion strain in a comparable way for classical and microfluidic methods (Figure 4F). Our results thus confirmed that a specific mutational signature can be detected using the microfluidic device in a way comparable with the classical method. Moreover, results clearly show that our microfluidic system allows MA comparable to the classical method, taking into account the number of generations in each experiment, and is
WT ung1∆
Classical MA, WT Microfluidics MA, WT Classical MA, ung1∆ Microfluidics MA, ung1∆
A
B
C
D
E
Bottlenecks WT ung1∆ C G U G Spontaneous deamination C G Base excision repairWT ung1∆ T A Mutagenesis
F
0 20 40 60 80 N u m b e r o f S N P s Increase of SNP number in WT strain MA using microfluidics 50 100 150 0.0 0.1 0.2 0.3 0.4 0.5 0.6 0.7 F ra c ti o n o f C :G t o T :AFraction of C:G to T:A transitions within SNPs 0.00 0.01 0.02 0.03 0.04 0.05 0.06 N u m b er o f C :G t o T :A tr a n si ti o n s p e r g e n e ra ti o n
C:G to T:A transitions per generation
* *** ** * ** * *** 0.00 0.02 0.04 0.06 clas sica l mic roflu idic s N u m b e r o f S N P s p er g e n e ra ti o n
SNPs per generation in WT strain
0.0 0.5 1.0 1.5 2.0 2.5 clas sica l mic roflu idic s R a ti o o f S N P p e r g e n e ra ti o n ung1/WT ratio of SNPs
Discussion
In this work, we have developed and validated an innovative microfluidic-based system for automatizing the culture of cell lines over many generations for MA experiments in budding yeast. This unique experimental tool, coupled with high-throughput sequencing, significantly streamlines and speeds up genome-wide measurements of mutational profiles. Indeed, this approach allows replacing manual colony plating – which requires 800 Petri dishes and human intervention every 2 days for more than 6 months – with a single microfluidic chip that contains up to 8 MA lines operating in parallel for 2-3 months (in the case of the 100-bottleneck chip) with limited intervention (at least once every fortnight to check if the device is working properly).Crucially, we have demonstrated that the microfluidic approach also results in mutation accumulation comparable to the traditional experiment on plate.
This work represents a significant achievement in maintaining yeast growth over thousands of generations in a microfluidic device with regular population bottlenecks. Long-term cell culturing for 1 – 4.5 months within a microfluidic system is not common and imposed important constraints in terms of risk of contamination, requirement of a constant nutrient supply and precise control of flows within the system. These constraints were overcome with the geometric construction, which decoupled the hydrodynamics of the culture chambers from that of the nutrient channel without preventing the diffusion of nutrients, thus allowing the sequential colonisation of downstream chambers.
Moreover, this microfluidic device enables several MA lines to be run in parallel – up to 8 in the current design. This allows the simultaneous comparison of many yeast strains, in an unbiased manner and at reasonable time cost, and results in added precision to the genome-wide analysis of mutational processes. In the classical plating MA approach, the time necessary for colony formation determines the population size between each bottleneck. The microfluidic approach allows studying precisely the impact of the size of the population on mutation accumulation by changing the size of the chambers, since the number of yeast generated is proportional to the volume of the chamber. We expect that for a very small size of the culturing chamber (about a few yeast cells) the number of the yeast generations becomes too low for seeing significant mutation accumulation. In the same manner, varying the number of the bottlenecks can influence the mutation accumulation. For instance, with small size chamber it would be preferable to increase the number of bottlenecks.
The multiplexing of the system makes it possible to increase the precision of MA experiments. Our results on genome sequencing of MA lines demonstrated that the microfluidic system is compatible with detection of as low number of mutations as that observed in a wild-type context, even with a lower number of generations between each bottleneck compared to the classical MA method. Additionally, the fabrication of the microfluidic chip can be easily adapted to increase the number of bottlenecks and therefore the number of mutations that can be obtained in MA experiments. Importantly, we show that MA experiments using our microfluidic system are comparable with a classical MA approach when the number of mutations was normalized per generation in each experiment. As a proof of concept, we were also able to confirm an increase in a specific SNP type (C:G to T:A transitions) as expected for a given genetic background (ung1 strain deficient in BER DNA repair pathway).
One of the advantages of microfluidic systems is their ability to control environments in terms of temperature and nutrients. We do not exclude that the growth conditions could differ between the classical experiments and the microfluidic environment. It should be also kept in mind that microfluidic environments could cause potential stresses for yeast cells. For example, glucose-limited conditions induce a stress response in yeast25. To limit this potential stress and starvation conditions in general, our microfluidic system is connected to a nutrient channel with a constant flow of fresh medium containing optimal concentrations of glucose and other nutrients. We are also aware of the potential mechanical stress that the cells could encounter in confined microfluidic environments. For example, Holt et al.26 suggested that yeast cells growing under confinement in a chamber without any exit can potentially induce a compressive stress. In our system, the chambers are connected by a channel allowing yeast cell to pass and to colonize the next chamber. Even though the compressive stress conditions can occur during the MA experiments in filled chambers, this should not affect the overall results since the cells are colonizing the next chamber. Moreover, we did not observe any major increase in growth rate or the block in the G1 phase of the cell cycle reported for growth-induced pressure26. MA experiments were previously performed both in haploid and diploid yeast backgrounds, providing complementary knowledge to understand mutational processes. For example, yeast mutator genotypes were analysed in haploid27 and homozygous diploid backgrounds28. The effect of ploidy state, such as loss of heterozygosity, can be directly addressed in diploid strains29. A recent study suggested that the genome-wide rate and types of spontaneous mutations can differ between haploid and diploid yeast30. Our microfluidic design can be readily adapted to diploid backgrounds, in particular, by adjusting the diameter of the channel connecting the chambers to allow the passage of an elliptical diploid cell with a volume near two-times greater than spherical haploid cell. More generally, the microfluidic chip relies on hydrodynamic mechanisms that are generic. As a consequence, it should be also possible to study other organisms such as different yeast species or bacteria provided that the geometry, in particular the size of the bottleneck channels and culture chambers, is adapted.
Our microfluidic approach will significantly improve MA experiments to study mutagenesis. Mutation accumulation analysis in model organisms such as budding yeast, where changes in DNA transactions and effects of environmental conditions can be precisely controlled, is important to understand mutational processes in eukaryotic cells. As most cellular functions are conserved from yeast to human cells, this knowledge can help to understand mutational processes at the origin of many human diseases
Conclusions
Conventional mutation accumulation experiments with the plate cell culture method are labour intensive and time consuming. The present microfluidic device reduces mutation accumulation experiments from more than 6 months to 1-4.5 months with several lines operating in parallel and considerably less human intervention. This makes it possible to simultaneously compare, in an unbiased manner, many yeast strains to precisely decipher genome-wide mutational processes. This device has the potential to accumulate mutations and can be used to discover the mutagenic effect of a specific yeast mutant. In the future, it can also be used to discover new therapeutic targets, identify mutagenic compounds, and serve as a basis for the development of human cell culture systems to closely imitate the accumulation of mutations within diseases such as cancer.
Author Contributions
ES: Methodology, Investigation, Data curation, Writing – original draft. AL-S: Conceptualization, Investigation. CDW: Data curation, Formal analysis. JS: Funding acquisition, Project administration, Conceptualization, Methodology, Supervision, Validation, Visualization, Formal Analysis, Writing – original draft, Resources, Writing – review & editing. FM: Funding acquisition, Conceptualization, Visualization, Investigation, Formal analysis, Data curation, Methodology, Supervision, Validation, Visualization, Resources, Writing – original draft, Writing – review & editing.
Conflicts of interest
There are no conflicts to declare.
Acknowledgements
We thank Dr. Mark Levenstein for critical reading of the manuscript and Drs. Pierre Nicolas and Arach Goldar for fruitful discussions. We acknowledge the High-throughput sequencing facility of I2BC for its sequencing and bioinformatics expertise. This work was funded by the CEA DRF-Impulsion program. E.S. was supported by a PhD training contract from the CEA.
References
1. P. L. Foster, in Methods in Enzymology: DNA Repair, Part B, 2006, vol. 409, pp. 195-213. 2. A. Frenoy and S. Bonhoeffer, PLoS Biol, 2018, 16, e2005056.
3. K. T. Nishant, N. D. Singh and E. Alani, BioEssays, 2009, 31, 912-920. 4. J. E. Barrick and R. E. Lenski, Nat Rev Genet, 2013, 14, 827-839. 5. V. Katju and U. Bergthorsson, Genome Biol Evol, 2019, 11, 136-165.
6. D. L. Halligan and P. D. Keightley, Annual Review of Ecology, Evolution, and Systematics, 2009, 40, 151-172. 7. G. M. Whitesides, Nature, 2006, 442, 368-373.
8. L. Y. Yeo, H. C. Chang, P. P. Y. Chan and J. R. Friend, Small, 2011, 7, 12-48. 9. E. W. Young and D. J. Beebe, Chem Soc Rev, 2010, 39, 1036-1048. 10. C. D. Chin, V. Linder and S. K. Sia, Lab Chip, 2012, 12, 2118-2134.
11. A. Khademhosseini, R. Langer, J. Borenstein and J. P. Vacanti, Proc Natl Acad Sci U S A, 2006, 103, 2480-2487. 12. N. Azizipour, R. Avazpour, D. H. Rosenzweig, M. Sawan and A. Ajji, Micromachines (Basel), 2020, 11, 599.
13. D. Huh, B. D. Matthews, A. Mammoto, M. Montoya-Zavala, H. Y. Hsin and D. E. Ingber, Science, 2010, 328, 1662-1668. 14. J. P. Frimat, M. Becker, Y. Y. Chiang, U. Marggraf, D. Janasek, J. G. Hengstler, J. Franzke and J. West, Lab Chip, 2011, 11,
231-237.
15. K. Zhang, C. K. Chou, X. Xia, M. C. Hung and L. Qin, Proc Natl Acad Sci U S A, 2014, 111, 2948-2953. 16. P. Liu, T. Z. Young and M. Acar, Cell Rep, 2015, 13, 634-644.
17. E. A. Sarnoski, R. Song, E. Ertekin, N. Koonce and M. Acar, iScience, 2018, 7, 96-109. 18. T. Z. Young, P. Liu, G. Urbonaite and M. Acar, Cell Rep, 2019, 28, 2220-2230 e2227.
19. L. Wang, J. Liu, X. Li, J. Shi, J. Hu, R. Cui, Z.-L. Zhang, D.-W. Pang and Y. Chen, Biomicrofluidics, 2011, 5, 044118–044118-044119.
20. B. Dujon, in The Molecular Biology of the Yeast Saccharomyces. , eds. J. N. Strathern, E. W. Jones and J. R. Broach, Cold Spring Harbor Laboratory Press, Cold Spring Harbor, NY, 1981, pp. 505-635.
21. C. Janke, M. M. Magiera, N. Rathfelder, C. Taxis, S. Reber, H. Maekawa, A. Moreno-Borchart, G. Doenges, E. Schwob, E. Schiebel and M. Knop, Yeast, 2004, 21, 947-962.
22. Y. Xia and G. M. Whitesides, Annual Review of Materials Science, 1998, 28, 153-184.
23. M. Serra, I. Pereiro, A. Yamada, J. L. Viovy, S. Descroix and D. Ferraro, Lab Chip, 2017, 17, 629-634. 24. K. J. Impellizzeri, B. Anderson and P. M. Burgers, J Bacteriol, 1991, 173, 6807-6810.
25. M. Chatterjee and M. Acar, Sci Adv, 2018, 4, e1701775.
26. L. J. Holt, O. Hallatschek and M. Delarue, Methods Cell Biol, 2018, 147, 215-231.
27. A. Serero, C. Jubin, S. Loeillet, P. Legoix-Ne and A. G. Nicolas, Proc Natl Acad Sci U S A, 2014, 111, 1897-1902.
28. S. Loeillet, M. Herzog, F. Puddu, P. Legoix, S. Baulande, S. P. Jackson and A. G. Nicolas, Proc Natl Acad Sci U S A, 2020, 117, 24947-24956.
30. N. P. Sharp, L. Sandell, C. G. James and S. P. Otto, Proc Natl Acad Sci U S A, 2018, 115, E5046-E5055. 31. P. Mao, M. J. Smerdon, S. A. Roberts and J. J. Wyrick, Genome Res, 2020, 30, 12-21.
Electronic supplementary information
Microfluidic platform for monitoring Saccharomyces cerevisiae mutation accumulation assay
Eliet H. Siposa, Adélaïde Léty-Stefanskab,Cyril Denby Wilkesa,Julie Soutourina*a, and Florent Malloggi*b
aUniversité Paris-Saclay, CEA, CNRS, Institute for Integrative Biology of the Cell (I2BC), 91198, Gif-sur-Yvette, France bUniversité Paris-Saclay, CEA, CNRS, NIMBE, 91191 Gif-sur-Yvette Cedex, France
*Correspondence: [email protected] , [email protected]
1- Sequential colonisation of the chambers
Figure S1. Sequential colonisation of the chambers. From left to right. The yeasts grow but do not move on to the next chamber until the space is completely filled due to the weak flow that prevents passage by simple diffusion.
2- Non-sequential colonisation of the chambers
Figure S2. Non-sequential colonisation of the chambers when nutrient flow and yeast growth are in the same direction.
Figure S3. Monitoring of yeast budding time inside the microfluidic chamber.
4- Genomic mutation accumulation experiments
Supplementary Table S1. Number of mapped and unique reads in genomic MA experiments
Sample Genotype Passage Bottleneck Sequenced
reads Mapped reads % mapped reads Unique reads % unique reads base_series1_YPH_B0 WT Manual 0 31230266 27493880 88.04% 26631944 96.86% classical_series1_YPH_B50 WT Manual 50 29138434 24725654 84.86% 23094298 93.40% classical_series2_YPH_B50 WT Manual 50 23533304 20081674 85.33% 19215568 95.69% classical_series2_YPH_B100 WT Manual 100 20883446 17606426 84.31% 16848804 95.70% classical_series1_YPH_B150 WT Manual 150 25028582 21243502 84.88% 20179962 94.99%
base_series1_UNG1_B0 ung1∆ Manual 0 47072948 40339044 85.69% 38567376 95.61%
classical_series1_UNG1D_B50 ung1∆ Manual 50 24852636 20558552 82.72% 19125694 93.03%
classical_series1_UNG1D_B100 ung1∆ Manual 100 24995042 20720080 82.90% 19715038 95.15%
microfluidic_series2_YPH_B50 WT Microfluidics 50 22564074 19257704 85.35% 18361968 95.35% microfluidic_series4_YPH_B50 WT Microfluidics 50 24749996 21298216 86.05% 20253602 95.10% microfluidic_series3_YPH_B100 WT Microfluidics 50 22520754 19526708 86.71% 18663478 95.58% microfluidic_series1_YPH_B100 WT Microfluidics 100 22891176 19852134 86.72% 19021606 95.82% microfluidic_series2_YPH_B100 WT Microfluidics 100 20335664 16626802 81.76% 15544548 93.49% microfluidic_series4_YPH_B100 WT Microfluidics 100 25007680 21760306 87.01% 20752540 95.37% microfluidic_series3_YPH_B50 WT Microfluidics 100 24077992 21090592 87.59% 20119910 95.40% microfluidic_series2_YPH_B150 WT Microfluidics 150 26049344 22208094 85.25% 21195206 95.44% microfluidic_series4_YPH_B150 WT Microfluidics 150 33170468 29010288 87.46% 28030692 96.62%
microfluidic_series5_UNG1D_B50 ung1∆ Microfluidics 50 29555802 25157800 85.12% 24373254 96.88%
microfluidic_series5_UNG1D_B100 ung1∆ Microfluidics 100 28706734 24470540 85.24% 23559670 96.28%