HAL Id: tel-01150950
https://tel.archives-ouvertes.fr/tel-01150950
Submitted on 12 May 2015
HAL is a multi-disciplinary open access archive for the deposit and dissemination of sci-entific research documents, whether they are pub-lished or not. The documents may come from teaching and research institutions in France or abroad, or from public or private research centers.
L’archive ouverte pluridisciplinaire HAL, est destinée au dépôt et à la diffusion de documents scientifiques de niveau recherche, publiés ou non, émanant des établissements d’enseignement et de recherche français ou étrangers, des laboratoires publics ou privés.
Joan Massich
To cite this version:
Joan Massich. Deformable object segmentation in ultra-sound images. Signal and Image processing. Université de Bourgogne; Universitat de Girona, 2013. English. �NNT : 2013DIJOS090�. �tel-01150950�
Thèse de Doctorat
n
é c o l e d o c t o r a l e s c i e n c e s p o u r l ’ i n g é n i e u r e t m i c r o t e c h n i q u e sU
N I
V
E
R
S I
T
É
D E
B O U
R G O
G N
E
Segmentation d’objects
d ´eformables en imagerie
ultrasonore
Joan
M
ASSICH
Thèse de Doctorat
é c o l e d o c t o r a l e s c i e n c e s p o u r l ’ i n g é n i e u r e t m i c r o t e c h n i q u e s
U
N
I
V
E
R
S
I
T
É
D
E
B
O
U
R
G
O
G
N
E
TH `
ESE pr ´esent ´ee par
Joan
M
ASSICH
pour obtenir le
Grade de Docteur de
l’Universit ´e de Bourgogne
Sp ´ecialit ´e :Informatique
Segmentation d’objects d ´eformables en imagerie
ultrasonore
Soutenue le 4 d ´ecembre 2013 devant le Jury :
DenisFRIBOULET Pr ´esident du jury Professeur `a l’Institut national des
sciences appliqu ´ees de Lyon
RobertMART´I Examinateur Professeur `a l’Universitat de Girona
FrancescoTORTORELLA Examinateur Professeur `a l’Universit `a degli Studi di
Cassino e del Lazio Meridionale
FabriceMERIAUDEAU Directeur de th `ese Professeur `a l’Universit ´e de Bourgogne
JoanMART´I Co-directeur de th `ese Professeur `a l’Universitat de Griona
DECLARE
That the work entitled Deformable object segmentation in Ultra-Sound
im-ages, presented by Joan Massich to obtain the degree in Doctor of
Phi-losophy, has been developed under our supervision and complies with the requirements needed to obtain the International Mention.
Therefore, in order to certify the aforesaid statement, we sign this docu-ment.
Girona, October 2013.
G.B. Stern
Utilitzant la mateixa f´ormula que utilitza alg´u que durant aquest per´ıode de doctorat ha passat a ser important per mi, m’agradaria agrair la feina que aqu´ı presento a totes aquelles persones que fan possible que els meus somnis es facin realitat. Per`o en aquest cas no nom´es voldria agrair-ho a qui m’ajuda, em guia i crea refor¸c positiu per tal d’aconseguir que surti el millor de mi, sin´o que no voldria oblidar-me dels altres, de tots aquells que em fan serrar les dents i resar dos em cago en d´eu, perqu`e sense ells potser tampoc hi hagu´es arribat.
Un cop dit aix`o tan gen`eric, m’agradaria agrair de forma m´es expl´ıcita a Joan Mart´ı Bonmat´ı i Fabrice Meriaudeau, els meus dos directors de tesi, que hagin tingut la valentia (o falta de seny) de posar-se a dirigir una nau ingovernable, sempre a la deriva de l’´ultima idea sense sentit, i que, a m´es a m´es, ho hagin fet sota la meva conducta incendi`aria, sota el crit de “foc a bordu” o “aix`o ´es una merda” mentre m’he dedicat, dia per altre, i durant quatre anys, a cremar-li les veles.
En la mateixa l´ınia tamb´e m’agradaria agrair al professor Hamed Sari-Sarraf la mateixa valentia o falta de seny per acollir-me dues vegades dins l’equip d’investigadors de l’Applied Vision Lab a la Universitat de Texas Tech (guns up, riders!).
Tampoc voldria oblidar-me d’agrair la paci`encia infinita de Sergi Ganau i Rosalia Aguilar, el personal d’UDIAT amb qui he treballat per entendre, recolectar i catalogar les imatges amb les quals realitzem les nostres tasques d’investigaci´o. Estic d’acord que les colaboracions, en m´es o menys mesura, formen part de les obligacions de tots, per`o repeteixo que la paci`encia infinita que han tingut a UDIAT per formar, divendres rere divendres, a un analfabet m`edic com jo per tal que pogu´es llegir les imatges d’ultras`o adequadament i veure m´es enll`a de simples taques, ´es un esfor¸c que els agraeixo molt.
TIN2007-60553 i TIN2011-23704, i al Consell regional de la Bourgogne, ja que dels diners que han aportat entre els uns i els altres ´es d’on han anat sortint totes les misses.
Un cop dit tot aix`o, podria anar agraint un per un a tothom fins arribar a agrair de forma personal al repartidor que porta les pizzes a la universitat si et fas passar per l’Andr´es. Per`o si he de fer aix`o fins arribar als repartidors de Girona, Lubbock i Le Creusot no acabar´e mai, aix´ı que doneu-vos tots per agra¨ıts.
Far´e l’esfor¸c, per`o, d’agrair el recolzament a tots els companys d’entrenament d’aqu´ı i d’all`a. Potser tamb´e a alg´u m´es perqu`e sin´o m’ho sentiria a dir i en definitiva els agraiments ´es l’´unic que llegireu.
A en Pueyo, per tot el que representa; al carcamal d’en Quintana, que ha passat de ser un vadell a haber de passar dues vegades per veure’l i, si la carretera fa pujada, haver-me’n d’oblidar de veure’l; a en Guilloume quan no est`a en forma; als nens com n’Enric, en Gubern o en Gamussilla per les sortides a peu, encara que facin el que els doni la gana i despr´es es trenquin. A en Valverde, perqu`e em fa sentir menys tarat. A l’avi Cuf´ı, pel ritme que tant m’agrada, o a en Robert, que encara ´es m´es c`omode. Nois, seguiu pujant a Le Creusot perqu`e els d’all`a estan tarad´ıssims. A en Fabrice, en Micha, n’Olivier, n’Albhan, en Cedric i tots amb els que anem a c´orrer i que, un cop despenjat, passen a recollir-me per seguir torturant-me, els molt animals. A l’equip de triatl´o de Texas i al de ciclisme. Als dos equips amb els quals vam fer els ironmans. A la S´ılvia, que em compensa les c`arregues d’entrenament i feina amb dietes a base de pl`atans, tot i saber que en s´oc al`ergic.
Tampoc voldria oblidar-me d’en Ricard Prados, qui es pensa que l’he estat putejant amb estima durant quatre anys quan, en realitat, majori-tariament tot han estat maniobres molt ben estructurades per n’Albert i executades per en Quintana. I sabeu que puc demostrar-ho perqu`e en tinc proves gr`afiques.
M’agradaria agra¨ır tamb´e, per`o de forma seriosa encara que ells siguin uns catxondos, les converces i la feina feta amb l’Arnau, en Xavi, en Chris-tian, en Gerard, en Desir´e, n’Ian, n’Arunkumar o la poligonera de la Meri, que al final no mossega tant com ens vol fer creure perqu`e ´es un tros de p`a beneit que quan s`apiga que us ho he explicat ja la sentir´e.
I finalment en aquests agraiments no hi pot faltar, i ell ja sap perqu`e, en Miki que encara que no us ho creieu m’ha convencut m´es d’un cop en afluixar i passar per l’aro.
the course of this phd along with a list of undergoing publications as outcome of this dissertation.
published contributions
• Massich, Joan, Fabrice Meriaudeau, Elsa P´erez, Robert Mart´ı, Arnau
Oliver, and Joan Mart´ı. ”Lesion segmentation in breast sonography.” In Digital Mammography, pp. 39-45. Springer Berlin Heidelberg, 2010.
• Massich, Joan, Fabrice Meriaudeau, Elsa P´erez, Robert Mart´ı, Arnau
Oliver, and Joan Mart´ı. ”Seed selection criteria for breast lesion seg-mentation in Ultra-Sound images.” In MICCAI Workshop on Breast Image Analysis, pp 55-64. Toronto, Canada. 2011
• J.Mart´ı, A.Gubern-M´erida, J.Massich, A.Oliver, J.C.Vilanova, J.Comet,
E.P´erez, M.Arzoz, and R.Mart´ı. Ultrasound Image Analysis. Methods and Applications. Recent Advances in Biomedical Signal Processing, pp 216-230. Eds: J.M.G´orriz, E.W.Lang, and J.Ram´ırez, Bentham Science Publishers. 2011.
• Massich, Joan, Fabrice Meriaudeau, Melcior Sent´ıs, Sergi Ganau, Elsa
P´erez, Robert Mart´ı, Arnau Oliver, and Joan Mart´ı. ”Automatic seed placement for breast lesion segmentation on US images.” In Breast Imaging, pp. 308-315. Springer Berlin Heidelberg, 2012.
• Massich, Joan, Fabrice Meriaudeau and Joan Mart´ı. ”Segmentation
techniques applied to breast ultrasound imaging: A review.” to be published. Submitted to Medical Image Analysis, Elsevier.
3.1 Optimization methods characteristics . . . 66 3.2 Configuration details of the experiments . . . 119
1.3 Tomosynthesis image acquisition and reconstruction . . . 5 1.4 Comparison between conventional B-mode Ultra-Sound (US)
imaging and real time spatial compound US imaging (sonoCT). 7 1.5 conventional hand-held US and Automated whole Breast
Ultra-Sound (ABUS) acquisition devices comparison. . . 8
1.6 Magnetic Resonance Image (MRI) imaging. . . 9
1.7 Lesion that is shielded under Digital Mammography (DM) but distinguishable under US . . . 12 1.8 Appearance of breast structures in US images. . . 13 1.9 Breast Ultra-Sound (BUS) image examples of different
adi-pose and fibro-glandular topologies with the presence of le-sions illustrating the different Breast Imaging-Reporting and Data System (BI-RADS) tissue types. . . 15 1.10 Partial views of the structural elements of the breast
illus-trating the influence of zoom . . . 17 1.11 Illumination inhomogeneities in US images. . . 18 1.12 Speckle noise characteristic of Ultra-Sound (US) images. . . . 19 1.13 BI-RADS lexion descriptor: mass shape. . . 21 1.14 BI-RADS lexion descriptor: mass orientation. . . 22 1.15 BI-RADS lexion descriptor: mass interior echo-pattern. . . . 23 1.16 BI-RADS lexion descriptor: mass margin. . . 24 1.17 BI-RADS lexion descriptor: lesion boundary. . . 24 1.18 BI-RADS descriptors for assessing breast lesions in US images
and their occurrences across several lesion types. . . 25 1.19 BI-RADS lexion descriptor: background echo-texture. . . 26 2.1 Role of segmentation procedures within Computer Aided
Di-agnosis (CAD) systems. . . 32 xi
2.3 Conceptual map of the segmentation strategies applied tu BUS 45 2.4 Conceptual map of supervised Machine Learning (ML)
train-ing and goals. . . 47 2.5 Qualitative assessment of some feature examples . . . 50 2.6 Methodology evaluation. . . 52 2.7 Non-symmetry propoerty of the Minimum Distance (MD)
metric. . . 57
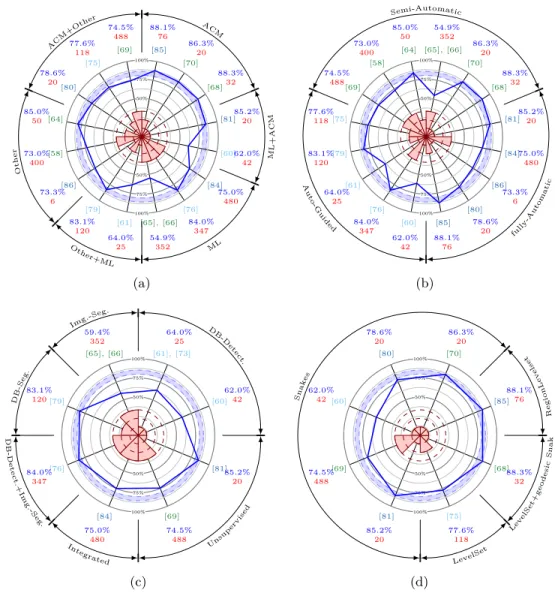
2.8 Graphical performance comparison of the reviewed methods. 64
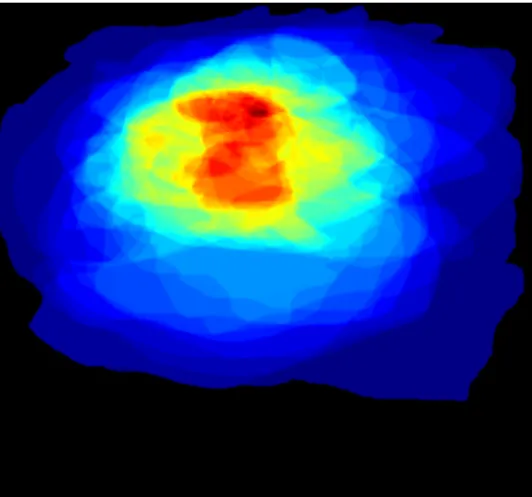
3.1 Gaussian Constraining Segmentation (GCS) complete method-ology block diagram. . . 68 3.2 Intensity Texture and Geometric (ITG) block diagram . . . . 69 3.3 Lesion pixel occurrence in a normalized image P (x, y|Lesion)
obtained from an annotated dataset . . . 70 3.4 Ψ(x, y) construction for GCS segmentation purposes. . . 72 3.5 GCS outline. . . 72 3.6 Complementary qualitative results for GCS based breast
le-sion segmentation. . . 73 3.7 Toy example illustrating data and pairwise costs and how the
overall minimal segmentation is selected. . . 75 3.8 Conceptual representation of the optimization framework
pro-posed for segmenting breast lesions in US data. . . 76 3.9 Visual comparison of super pixels produced by different
meth-ods. . . 79 3.10 Qualitative analysis of Quick-shift based superpixels. . . 81 3.11 Qualitative analysis of using Global Probability Boundary
(gPb) as a superpixel. . . 82 3.12 Brightness appearance feature based on comparing superpixel
and image statistics (Quick-shift). . . 86 3.13 Qualitative examination of the brightness feature (Quick-shift). 87 3.14 Brightness appearance feature based on comparing superpixel
and image statistics (gPb). . . 88 3.15 Qualitative examination of the brightness feature (gPb). . . . 89 3.16 Self-Invariant Feature Transform (SIFT) descriptor illustration. 92 3.17 Representation of the Bag-of-Features (BoF) (or Bag-of-Words
(BoW)) procedure. . . 93 3.18 SIFT descriptor visual interpretation. . . 94 3.19 SIFT dictionary . . . 95
3.24 Multi-resolution example for a given image and gPb
super-pixel (distance to image mean). . . 101
3.25 Multi-resolution example for a given image and gPb super-pixel (distance to image median). . . 102
3.26 Multi-resolution example for a given image and gPb super-pixel (distance to image maximum). . . 103
3.27 Multilabel Ground Truth (GT) examples illustrating label co-herence. . . 105
3.28 Simulated Annealing (SA) behavior. . . 108
3.29 Data term graph construction to solve the data part of the labeling problem using min-cut/max-flow. . . 110
3.30 Data and pairwise terms graph construction to solve the com-plete labeling problem using min-cut/max-flow. . . 110
3.31 Multi-class graph construction example using three sites ex-ample. . . 111
3.32 B-mode breast US image dataset collection. . . 114
3.33 Randomized sampling for classifier training purposes. . . 116
3.34 Quantitative results. . . 118
3.35 Quantitative AOV results compared to the methodologies re-viewed in section 2.4. . . 119
3.36 Qualitative inspection of the quantitative results achieved in experiments 3 and 4. . . 122
3.37 Qualitative inspection of the quantitative results achieved in experiments 7 and 8. . . 123
3.38 Experiment 4 detailed results. . . 125
3.39 Experiment 8 detailed results. . . 126
3.40 Qualitative result example from experiment 4. . . 128
3.41 Qualitative result example from experiment 7 and 8 to illus-trate the effect of the homogeneous pairwise term. . . 129
ACM Active Contour Model . . . 37
ACR American College of Radiology . . . 14
ACWE Active Contour Without Edges . . . 66
ADF Anisotropic Diffusion Filter. . . .37
AMED Average Minimum Euclidian Distance. . . .57
AOV Area Overlap . . . 36
ARD Average Radial Derivative . . . 36
ARE Average Radial Error . . . 55
BI-RADS Breast Imaging-Reporting and Data System . . . 20
BoF Bag-of-Features . . . 91
BoW Bag-of-Words. . . .91
BUS Breast Ultra-Sound . . . xxii
CAD Computer Aided Diagnosis . . . xxii
CADe Computer Aided Detection . . . 27
CADx Computer Aided Diagnosis . . . 27
CC Cranio-Caudal. . . .3
CRF Conditional Random Field. . . .42
CV Computer Vision . . . 77
DIC Ductal Infiltrating Carcinoma . . . 113
DICOM Digital Imaging and Communications in Medicine . . . 112
DM Digital Mammography . . . xxi
DPM Deformable Part Model. . . .42 xv
EM Expectation Maximization. . . .37
FFDM Full-Field Digital Mammography . . . 4
FN False Negative. . . .40 FNR False-Negative Ratio. . . .55 FP False Positive. . . .40 FPR False-Positive Ratio . . . 55 FPR’ False-Positive Ratio’. . . .54 GC Graph-Cut . . . xxii
GCS Gaussian Constraining Segmentation . . . 36
GLCM Gray-Level Co-occurrence Matrix . . . 41
gPb Global Probability Boundary . . . 80
GRASP Greedy Randomized Adaptive Search Procedure . . . 106
GT Ground Truth . . . 39
HD Hausdorff Distance . . . 56
HGT Hidden Ground Truth . . . 39
HOG Histogram of Gradients . . . 49
ICM Iterated Conditional Modes . . . 106
IDC Intra-Ductal Carcinoma . . . 113
IID Independent and Identically Distributed . . . 39
ILC Infiltrating Lobular Carcinoma . . . 113
ITG Intensity Texture and Geometric . . . 68
JSC Jaccard Similarity Coefficient . . . 53
LOOCV Leave-One-Out Cross-Validation. . . .116
MAD Median Absolute Deviation . . . 85
MAP Maximum A Posteriori . . . 39
MCDE Modified Curvature Diffusion Equation . . . 40
MD Minimum Distance . . . 56
ML Machine Learning . . . 39
OF Overlap Fraction . . . 54
PCA Principal Component Analysis. . . .93
PDE Partial Differential Equation. . . .44
PDF Probability Density Function . . . 45
PD Proportional Distance . . . 57
PET Position Emission Tomography . . . 10
PPV Positive Predictive Value . . . xxii
PR Pattern Recognition . . . 99 QC Quadratic-Chi . . . 85 QS Quick-Shift. . . .115
RBF Radial Basis Function . . . 104
RGI Radial Gradien Index. . . .38
RGI Radial Gradient Index . . . 38
RG Region Growing . . . 45 ROI Region Of Interest. . . .37
SA Simulated Annealing . . . 106
SIFT Self-Invariant Feature Transform. . . .91
SI Similarity Index . . . 53
SLIC Simple Linear Iterative Clustering
STAPLE Simultaneous Truth and Performance Level Estimation . . . 39
SVM Support Vector Machine. . . .104
TN True Negative . . . 51 TPR True-Positive Ratio. . . .54 TP True Positive . . . 40 US Ultra-Sound . . . xxi
1.1 Breast cancer . . . 1
1.2 Image diagnostic techniques applied to breast cancer . . . 2
1.2.1 X-ray screening, Mammography and Tomosynthesis . 3
1.2.2 Sonography . . . 5
1.2.3 Magnetic Resonance Image (MRI) . . . 8
1.2.4 Other breast imaging techniques . . . 9
1.3 Ultra-Sound imaging and its role in Breast Cancer . . . 10 1.3.1 Screening of the breast using Ultra-Sound images . . . 11 1.3.2 Elements degrading Breast Ultra-Sound (BUS) images 16 1.3.3 Breast lesion assessment based on Ultra-Sound
imag-ing . . . 19 1.4 Computer Aided Diagnosis (CAD) . . . 27
1.4.1 Image segmentation applied to BUS segmentation for CADx applications . . . 28 1.5 Thesis Objectives . . . 28 1.6 Thesis Organization . . . 29
2 A review of lesion segmentation methods in Ultra-Sound
images 31
2.1 The role of segmentation in breast US CAD system . . . 32 2.1.1 Interactive Segmentation . . . 33 2.1.2 Automatic Segmentation . . . 38 2.2 Segmentation methodologies and features . . . 43 2.2.1 Active Contour Models (ACMs) . . . 44 2.2.2 The role of Machine Learning (ML) in breast lesion
segmentation . . . 45 2.2.3 Others . . . 47 2.2.4 Features . . . 48
2.3.2 Multiple grader delineations . . . 58 2.4 Discussion . . . 59
3 Objective Function Optimization Framework for Breast
Le-sion Segmentation 65
3.1 Introduction . . . 65 3.2 GCS-based segmentation . . . 67 3.2.1 General outline of the segmentation framework . . . . 67 3.2.2 Seed Placement . . . 68 3.2.3 Preliminary lesion delineation using region growing . . 70 3.2.4 Gaussian Constrain Segmentation (GCS) . . . 71 3.2.5 Qualitative results . . . 71 3.3 Optimization framework for segmenting breast lesions in
Ultra-Sound data . . . 72 3.3.1 System Outline . . . 75 3.3.2 Pre-processing . . . 75 3.3.3 Image Partition . . . 76 3.3.4 Feature descriptors . . . 80 3.3.5 Classification or data model generation . . . 99 3.3.6 Pairwise or smoothing modeling . . . 104 3.3.7 Cost minimization . . . 105 3.3.8 Post-processing . . . 111 3.4 Case of Study . . . 112 3.4.1 Gathered dataset . . . 112 3.4.2 Experimentation and results . . . 115
4 Conclusions and further work 131
4.1 Short term perspective . . . 132 4.1.1 Long term perspective . . . 134
stomach, prostate and liver cancers [1]. In terms of mortality, breast cancer is the fifth most common cause of cancer death. However, it place as the leading cause of cancer death among females both in western countries and in economically developing countries [2].
Medical imaging plays an important role in breast cancer mortality re-duction, contributing to its early detection through screening, diagnosis, image-guided biopsy, treatment follow-up and suchlike procedures [3]. Al-though Digital Mammography (DM) remains the reference imaging modal-ity, Ultra-Sound (US) imaging has proven to be a successful adjunct image modality for breast cancer screening [3], [4], specially as a consequence of the discriminative capabilities that US offers for differentiating between solid lesions that are benign or malignant [5] so that the amount of unnecessary biopsies, which is estimated to be between 65 ∼ 85% of the prescribed biop-sies [6], can be reduced [7] in replacing them by short-term US screening follow-up [8].
Regardless of the clinical utility of the US images, such image modal-ity suffers from different inconveniences due to strong noise natural of US imaging and the presence of strong US artifacts, both degrading the over-all image quality [9] which compromise the performance of the radiologists. Radiologists infer health state of the patients based on visual inspection of images which by means of some screening technique (e.g. US) depict physi-cal properties of the screened body. The radiologic diagnosis error rates are similar to those found in any other tasks requiring human visual inspection, and such errors, are subject to the quality of the images and the ability of the reader to interpret the physical properties depicted on them[10].
Therefore the major goals of medical imaging researchers in general, and also in particular for breast lesion assessment using US data, has been to provide better instrumentation for improving the image quality, as well as,
scribing and reporting the lesions have been developed [5], [11]–[13] in order to reduce diagnosis inconsistencies among readers [14]. Such unifying terms so called lexicons are proven to be a useful framework for the radiologists when analyzing Breast Ultra-Sound (BUS) images. The Positive Predic-tive Value (PPV) and NegaPredic-tive PredicPredic-tive Value (NPV) which represent the percentage of properly diagnosed cases [15] achieved when describing lesions with these lexicon tools turned them into the standard for human reading and diagnosis based on BUS images.
A common framework allows managing the US imaging inconveniences such as strong noise or artifacts by allowing the comparison of double read-ings done by several specialized observers. The major inconvenience for double reading is the elevated time required from the radiologists. Thus, since a single observer using Computer Aided Diagnosis (CAD) as a second opinion has been proven to achieve comparable results [16], CAD systems are used to aliviate the time demand from the radiologists. However these descriptors are subject to an accurate delineation of the lesion which when read by an expert radiologist is instantly understood but in a CAD system a computerized system is required.
This thesis analyzes the current strategies to segment breast lesions in US data and proposes a fully automatic methodology for generating accurate segmentations of breast lesions in US data with low false positive rates. The proposed approach targets the segmentation as a minimization procedure for a multi-label probabilistic framework that takes advantage of min-cut/max-flow Graph-Cut (GC) minimization for inferring the appropriate label from a set of tissue labels for all the pixels within the target image. The image is divided into contiguous regions so that all the pixels belonging to a particular region would share the same label by the end of the process. From a training image dataset stochastic models are build in order to infer a label for each region of the image. The main advantage of the proposed framework is that it splits the problem of segmenting the tissues present in US the images into subtasks that can be taken care of individually.
c`ancer de pulm´o, seguit del c`ancer de colon, d’est´omac, de pr`ostata i de fetge. En termes de mortalitat en tota la poblaci´o, el c`ancer de pit ´es la cinquena causa de mortalitat. Si nom´es es t´e en compte la poblaci´o femenina, el c`ancer de mama lidera la mortalitat per c`ancer tant en pa¨ısos desenvolupats com en pa¨ısos en desenvolupament.
La imatge m`edica juga un paper crucial a l’hora de combatre la mortal-itat per c`ancer de mama, i en facilita, entre d’altres, les tasques de detecci´o preco¸c, diagnosis, bi`opsies guiades per imatge o seguiment de l’evoluci´o de les lesions. Tot i que la Mamografia Digital (MD) segueix essent la princi-pal modalitat d’imatge, les imatges d’ultras`o s’han convertit en una valuosa modalitat d’imatge per complementar les exploracions m`ediques. La seva principal v`alua ´es que aquestes imatges aporten informaci´o que permet de-terminar la benignitat o malignitat de les lesions s`olides, que no es poden determinar nom´es amb MD. Com a conseq¨u`encia de complementar MD amb imatges d’ultras´o, s’estima que entre un 65% i un 85% de les bi`opsies pre-scrites es podrien evitar, tot canviant-les per un seguiment peri`odic basat en imatges d’ultras`o.
Malgrat la utilitat m`edica de les imatges d’ultras´o, aquest tipus d’imatges s´on molt sorolloses i pateixen artefactes que comprometen les capacitats de diagnosis per part dels radi`olegs que han d’interpretar l’estat de salut del pa-cient a partir d’aquestes imatges. Els errors de diagnosi basats en la lectura d’imatges m`ediques s´on similars als de qualsevol altra tasca que requereixi inspecci´o visual i es troben subjectes a la qualitat de les imatges, aix´ı com a les habilitats dels radi`olegs per interpretar-les correctament.
Per aquestes raons, dins la comunitat que investiga imatge m`edica de forma general, aix´ı com en el cas particular del c`ancer de mama, s’intenta desenvolupar tant maquin`aria i/o processos que millorin la qualitat de les imatges, com metodologies per millorar-ne i sistematitzar-ne la lectura i
les lectures dels radi`olegs. S’ha demostrat que la utilitzaci´o d’aquest tipus d’eines, consistents en un conjunt d’atributs concrets (l`exic) que s´on assig-nats a les imatges per tal de descriure-les, millora el percentatge de lesions correctament diagnosticades, fet que les ha convertit en l’est`andard a l’hora de llegir imatges per part dels radi`olegs.
El fet d’utilitzar un l`exic com´u permet comparar m´ultiples lectures de diversos radi`olegs per millorar, aix´ı, la diagnosi final. Tot i que dur a terme aquest tipus de lectures m´ultiples ´es d’una pr`actica habitual, no deixa de ser molt costosa, ja que diversos especialistes han d’analitzar les imatges. Per aquesta ra´o, dins el camp m`edic s’han introdu¨ıt els sistemes CAD d’assist`encia computaritzada per la diagnosi per obtenir una segona opini´o. S’ha demostrat que la diagnosi final produ¨ıda per un radi`oleg util-itzant un sistema CAD ´es equiparable a la decisi´o consensuada per m´ultiples radi`olegs, fet que permet elleugerir el volum de tasques dels radiolegs. El principal problema en el desenvolupament de sistemes CAD acurats rau en qu`e aquest l`exic dep´en d’una delineaci´o fidel de les lesions, que un lector ex-pert pot dur a terme de forma intu¨ıtiva i natural per`o que un sistema CAD necessita d’un proces que realitzi aquesta tasca. D’aqu´ı la import`ancia de desenvolupar sistemes acurats de delineaci´o de lesions en imatges de mama en ultras`o.
En aquest treball, es proposa un sistema autom`atic per generar delinea-cions acurades de les lesions de mama en imatges d’ultras`o. El sistema pro-posat planteja el problema de trobar la delineaci´o corresponent a la minim-itzaci´o d’un sistema probabil´ıstic multiclasse mitjan¸cant el tall de m´ınim cost del graf que representa la imatge. El sistema representa la imatge com un conjunt de regions i infereix una classe per cada una d’aquestes regions a partir d’uns models estad´ıstics obtinguts d’unes imatges d’entrenament. El principal avantatge del sistema ´es que divideix la tasca en subtasques m´es f`acils d’adre¸car i despr´es soluciona el problema de forma global.
c´ancer de pulm´on, seguido por el c´ancer de colon, de est´omago, de pr´ostata y del c´ancer de h´ıgado. En t´erminos de mortalidad respecto toda la poblaci´on, el c´ancer de mama es la quinta causa de mortalidad. Considerando sola-mente la poblaci´on femenina, el c´ancer de mama lidera la mortalidad por c´ancer en pa´ıses desarrollados y tambi´en en pa´ıses en v´ıas de desarrollo.
La imagen m´edica es crucial para combatir la mortalidad por c´ancer de mama ya que facilita su detecci´on precoz, diagnosis, biopsias guiadas o seguimiento de la evoluci´on de las lesiones. Aunque la Mamograf´ıa Dig-ital (MD) sigue siendo la principal modalidad de imagen m´edica para la visualizaci´on de la mama, las imagenes de ultrasonido se han convertido en una valiosa modalidad de imagen para complementar dichas exploraciones m´edicas. Su principal valua es que las im´agenes de ultrasonido aportan informaci´on que permite determinar la benignidad o malignidad de las le-siones s´olidas, que no se puede determinar usando ´unicamente MD. Como consecuencia de complementar MD con im´agenes de ultrasonida, se estima que entre un 65% y un 85% de las biopsias prescritas se podr´ıan evitar, cam-biandolas por un seguimiento peri´odico basado en im´agenes de ultrasonido. A pesar de la valua m´edica de las im´agenes de ultrasonido, este tipo de imagenes padecen de mucho ruido y artefactos que comprometen las capacidades de diagn´ostico por parte de leso radiologos. Los errores de diagnosis debidos a una mala lectura de las im´agenes m´edicas son similares a los errores producidos en cualquier otra tarea que requiera inspecci´on visual. Dichos errores est´an sujetos a la calidad de las imagenes y a las habilidades de los radi´ologos en interpretarlas.
Por las razones mencionadas, en la comunidad que investiga la imagen m´edica de forma general, as´ı como para el caso particular del c´ancer de mama, intenta desarrollar maquinaria y/o procesos que mejoren la calidad de las imagenes, como metodolog´ıas para mejorar y sistematizar la lectura
reducir inconsistencias entre lecturas de radi´ologos. Est´a demostrado que la utilizaci´on de este tipo de herramientas, que consisten en un conjunto de atributos concretos (l´exico) que debe ser asignado a las imagenes a modo de descripci´on, mejora el porcentaje de lesiones correctamente diagnosticadas. Hecho que ha convertido estas herramientas en el procedimiento est´andar de lectura de las imagenes por parte de los radi´ologos.
La utilizaci´on de un l´exico com´un permite comparar las lecturas de varios radi´ologos permitiendo mejorar el diagnosis final. Aunque la pr´actica de lecturas m´ultiples es una pr´actica habitual, no deja de ser muy costosa, ya que varios especialistas deben analizar las imagenes. Por esta raz´on, se han introducido los sistemas de asistencia computarizada a la diagnosis (CAD) que facilitan una segunda opini´on al radi´ologo. Esta demostrado que el diagnosis final producido por un radi´ologo utilizando un sistema CAD es equiparable al diagnosis consensuando lecturas de m´ultiples radi´ologos, hecho que permite reducir la carga de trabajo de los radi´ologos. El principal problema al desarrollar sistemas CAD fiables radica en que dichos l´exicos dependen de una correcta delineaci´on de las lesiones. Un lector experto es capaz de visualizar dichas delineaciones de una forma natural e intuitiva, pero un sistema CAD necessita de procesos computarizados para realizar una delineaci´on acurada. De ah´ı la importancia de desarrollar sistemas fiables para la delineaci´on acurada de lesiones en imagenes ultrasonicas de mama.
En el trabajo aqu´ı presentado, se propone un sistema autom´atico para generar delineaciones acuradas de las lesiones de mama en im´agenes de ul-trasonido. El sistema propuesto plantea el problema de la delineaci´on como la minimizaci´on de un sistema probabil´ıstico multiclase mediante el corte de coste m´ınimo del graf representando la imagen. El sistema representa la imagen como un conjunto de regiones y infiere una clase para cada una de las regiones presentes en base a unos modelos estad´ısticos obtenidos durante un proceso de entrenamiento. La principal ventaja del sistema propuesto es que divide el problema en subtareas m´as f´aciles de solventar y finalmente soluciona la segmentaci´on de forma global.
est suivi par le cancer du colon, le cancer de l’estomac, celui de la prostate et le cancer du foie . Bien que parmi les cas mortels, le cancer du sein soi class´e cinqui`eme type de cancer le plus meurtrier, il reste n´eanmoins la cause principale de mortalit´e chez les femmes aussi bien dans les pays occidentaux que dans les pays en voie de d´eveloppement .
L’imagerie m´edicale joue un rˆole clef dans la r´eduction de la mortalit´e du cancer du sein, en facilitant sa premi`ere d´etection par le d´epistage, le diagnostic, la biopsie guid´ee par l’image et le suivi de traitement et des proc´edures de ce genre.
Bien que la Mammographie Num´erique (DM) reste la r´ef´erence pour les m´ethodes d’examen existantes, les ´echographies ont prouv´e leur place en tant que modalit´e complementaire. Les images de cette derni`ere fournissent des informations permettant de diff´erencier le carat`ere b´enin ou malin des l´esions solides, ce qui ne peut ˆetre d´etect´e par MD. On estime que 65 `a 85% des biopsies prescrites pourraient ˆetre ´evit´ees par la mise en place d’un suivi r´egulier bas´e sur des images ´echographiques. Malgr´e leur utilit´e clinique, ces images sont bruit´ees et la pr´esence d’artefacts compromet les diagnostiques des radiologues interpr`etant l’´etat de sant´e du patient `a partir de celles ci. Les erreurs de diagnostic bas´ees sur la lecture des images m´edicales sont sim-ilaires `a toute autre tˆache qui exige une inspection visuelle et sont soumises `a la qualit´e des images ainsi qu’aux comp´etences des radiologistes. C’est pourquoi un des objectifs premiers des chercheurs d’imagerie m´edicale a ´et´e de fournir une meilleure instrumentation dans le but d’am´eliorer la qualit´e d’image et des m´ethodologies permettant d’am´eliorer et de syst´ematiser la lecture et l’interpr´etation de ces images. Pour am´eliorer l’interpr´etation des images, la communaut´e m´edicale a mis au point un lexique commun r´eduisant les incoh´erences entre radiologues.
Il a ´et´e d´emontr´e que l’utilisation de ces outils, compos´e d’un ensem-xxvii
agnostiqu´ees [15], est devenu la norme lors de la lecture des images par les radiologues.
L’utilisation d’un lexique commun permet de comparer plusieurs lec-tures de diff´erents radiologues afin d’am´eliorer le diagnostic. Un telle pra-tique est ´enorm´ement couteuse en temps. Etant donn´e qu’il a ´et´e prouv´e que l’utilisation de Computer Aided Diagnosis CAD en tant que deuxi`eme observateur permet l’obtention de r´esultats comparables, ces syst`eme sont donc utilis´es pour am´eliorer l’exactitude des diagnostics.
Si pour un lecteur qualifi´e, la d´elineation fid`ele des l´esions peut ˆetre ´effectu´ee de mani`ere intuitive et naturelle, le CAD n´ecessite le d´eveloppement d’un syst`eme de d´elimitation pr´ecis pour l’utilisation du lexique.
Le probl`eme principal dans le d´eveloppement d’un CAD pr´ecis vient du fait que ce lexique d´epend d’une d´elineation fid`ele des l´esions qui, mˆeme si pour un lecteur qualifi´e peut ˆetre effectu´ee de mani`ere intuitive et naturelle. D’o`u l’importance du d´eveloppement de syst`emes de d´elimitation pr´ecise des l´esions dans les images de l’´echographie du sein.
La m´ethode propos´ee considere le processus de segmentation comme la minimisation d’une structure probabilistique multi-label utilisant un al-gorithme de minimisation du Max-Flow/Min-Cut pour associer le label ad´equat parmi un ensemble de labels figurant des types de tissus, et ce, pour tout les pixels de l’image. Cette derni`ere est divis´ee en r´egions adja-centes afin que tous les pixels d’une mˆeme r´egions soient labelis´es de la mˆeme mani`ere en fin du processus. Des mod`eles stochastiques pour la labellisa-tion sont cr´ees `a partir d’une base d’apprentissage de donn´ees. L’avantage principal de la m´ethodologie propos´ee est le d´ecoupage de l’op´eration de segmentation de tissu en sous tˆaches ind´ependentes les unes des autres.
The soul cannot think without a picture
Aristotle
1.1
Breast cancer
Breast cancer is the second most common cancer (1.4 million cases per year, 10.9% of diagnosed cancers), after lung cancer and followed by colorectal, stomach, prostate and liver cancers [1]. In terms of mortality, breast cancer is the fifth most common cause of cancer death. However, it is the lead-ing cause of cancer death among females both in western countries and in economically developing countries [2].
In general, breast cancer incidence rates are higher in western countries not only because of incidence factors like reproductive patterns, such as late age at first birth and hormone therapies, either contraceptives or pro-longed, but also, due to the aging of the population, which raises the overall incidence rates even if the age-specific rates remain constant [17], [18].
In contrast to the rising incidence rate of breast cancer over the last two decades in western countries, studies such as Autier et al [19] report that breast cancer mortality has been declining in many countries. This decrease is attributed to the combined effects of breast screening, which allows the detection of the cancer at its early stages, and to the improvements made in breast cancer treatment.
1.2
Image diagnostic techniques applied to breast
cancer
Medical imaging refers to the techniques and processes used to create im-ages depicting physical properties of the human body or animals (or parts thereof) in order to infer health state for clinical purposes or medical ther-apy. In an editorial by Angell et al. published in the New England Journal of
Medicine[20], the medical imagine discipline is qualified as one of the most
important medical developments of the past thousand years since medical imaging provides physicians with in vivo images describing physiology and functionality of organs.
Without exception, medical imaging plays the most important role in breast cancer mortality reduction, contributing to its early detection through screening, diagnosis, image-guided biopsy, treatment follow-up and suchlike procedures [3].
Digital Mammography (DM) is, and remains, the preferred screening technique for early detection and diagnosis of breast cancer [21]. It is esti-mated that a 15 to 35% reduction in mortality in breast cancer deaths is due to the wide implementation of screening mammography. However, almost 25% of cancers still go undetected under mammography screening [22], typ-ically in nonfatty breasts where the dense tissue shields the lesions. This is an important limitation in mammography screening, since about 40% of the female population have some dense breast tissue, and dense tissue is a risk factor for developing breast cancer. Patients with dense tissue in 75% or more of the breast have a four to six times higher probability of developing breast cancer compared to patients with dense tissue in 10% or less of the breast [23]. In addition, a large number of mammographic abnormalities (between 65 ∼ 85%) turn out to be benign after biopsy [6].
Therefore, it is recommended to use other image modalities like US and Magnetic Resonance Image (MRI) screening as complementary images since they are more sensitive than mammography in a dense breast scenario [4]. In some cases these techniques also offer higher specificity than mammography allowing doctors to distinguish benignant and malignant signs which can then be used to reduce the amount of unnecessary biopsies [3], [5], [24].
In spite of these mammography screening drawbacks, mammography remains the gold standard screening technique due to the greater ability mammography has over US or MRI imagery in depicting small non-palpable lesions (always in a non-dense breast scenario) [25]. Also, the fact that mi-crocalsifications, which are a clear sign of malignancy, are usually mistaken
(a) (b) (c)
Figure 1.1: Mammography Medio-Lateral Oblique (MLO) and Cranio-Caudal (CC) view points: (a) illustrates the projection of the two most used view points (image from [27]), which produces images like the Medio-Lateral Oblique (MLO) in (b) and the Cranio-Caudal (CC) in (c). Notice the presence of the pectoral muscle in the upper-left corner of the MLO example (b).
as artifacts in US or MRI imaginary [26]; or the fact that most ductal carcinoma in situ are missed under sonography [11] plays in favor of mam-mography screening.
However, combining clinical examination with multiple modality imaging is more sensitive than any individual image modality [4].
1.2.1 X-ray screening, Mammography and Tomosynthesis
Full-Field Digital Mammography and Screen-Film Mammography Mammography is a two-dimensional image modality that captures electro-magnetic waves of an X-ray band passing through a compressed breast. Depending on the compression deformation of the breast, the images are classified into different categories. Figure 1.1 shows the two most used view-points for extracting mammograms: the Medio-Lateral Oblique (MLO) view and Cranio-Caudal (CC) view. Figure 1.1(a) illustrates the projection of the breast into the views and fig. 1.1(b,c) show an example of each mammogra-phy view of the same breast with a visible mass.
4 CHAPTER 1. INTRODUCTION levels and subtracted from one another. The subtraction
increas-es visibility of the contrast agent.
In the temporal subtraction approach, a pre-injection mask image is taken, the contrast agent is administered, several post-contrast images are taken at specific intervals and subtraction images (post-contrast images minus the mask image) are processed and evaluated.
Clinical studies are underway in the U.S. to evaluate the effectiveness of contrast-enhanced mammography. Some researchers believe this modality may become an alternative to breast MRI in evaluating difficult-to-interpret mammograms or for high-risk screening. It may also be useful in evaluating multi-centric disease in newly diagnosed patients.
Full-Field Digital Tomosynthesis6
Tomosynthesis is a method of performing 3D x-ray mam-mography at doses similar to conventional 2D x-ray mammog-raphy. Tomosynthesis acquisition involves acquiring multiple images of a stationary compressed breast at different angles dur-ing a short scan. The individual images
are then reconstructed into a 3D series of thin high-resolution slices. The slices can be displayed individually or in a dynamic ciné mode. The individual slices reduce tissue overlap and structure noise relative to standard 2D projection mammography, with a total dose com-parable to that required for standard screening mammography.
The digital tomosynthesis device offers a number of exciting opportuni-ties, including the possibility of reduced breast compression, improved diagnos-tic and screening accuracy, 3D lesion localization, and contrast enhanced 3D imaging. Conventional x-ray mammog-raphy is a 2D imaging modality. The
signal detected receptor is dependent upon the total attenuation of all the tissues above the location. This is illustrated in Figure 3. The two objects (ellipse and star) individually attenuate x-rays passing through them on the way to the image receptor; howev-er, the signal detected represents a summation of their attenua-tion. In mammography, pathologies of interest are more difficult to visualize because of the clutter of signals from objects above and below. Tomosynthesis is a method of 3D imaging which can reduce this tissue overlap effect.
The basics of tomosynthesis acquisition theory are illustrat-ed schematically in Figure 4. While holding the breast station-ary, a number of images are acquired at different x-ray source angles. It can be seen from the figure that the objects at different heights in the substance being x-rayed project differently in the different projections. In this example, the two objects superim-pose when the x-rays are at 0º, but the ±15º acquisitions shift the
object’s shadows relative to one another in the images. The final step in the tomosynthesis procedure is recon-structing the data to get 3D information. This is illustrated in Figure 5. In the example on the right side of the figure, the pro-jection images are summed, shifting one relative to another in a specific way that reinforces the ellipsoidal object and reduces the contrast of the starred object by blurring it out. Similarly, in the example on the left side, the same set of acquired projection data can be reconstructed differently, using different shifts of the pro-jection data, to reinforce the star object and blur the ellipse. This method can be used to generate images that enhance objects from a given height by appropriate shifting of the projections relative to one another. Note that additional acquisitions are not required to achieve this; the single set of acquired data can be reprocessed to generate the entire 3D volume set.
Figure 4 . Tomosynthesis Imaging.
With tomosynthesis imaging, images acquired from different angles separate structures at differing heights. Conventional mammography would acquire only the central image.
Figure 3. Signal Detection.
With conventional mammography, the signal detected at the location on the image receptor is dependent upon the total attenuation of all the tissues above the location.
(a)
contrast images are taken at specific intervals and subtraction images (post-contrast images minus the mask image) are processed and evaluated.
Clinical studies are underway in the U.S. to evaluate the effectiveness of contrast-enhanced mammography. Some researchers believe this modality may become an alternative to breast MRI in evaluating difficult-to-interpret mammograms or for high-risk screening. It may also be useful in evaluating multi-centric disease in newly diagnosed patients.
Full-Field Digital Tomosynthesis6
Tomosynthesis is a method of performing 3D x-ray mam-mography at doses similar to conventional 2D x-ray mammog-raphy. Tomosynthesis acquisition involves acquiring multiple images of a stationary compressed breast at different angles dur-ing a short scan. The individual images
are then reconstructed into a 3D series of thin high-resolution slices. The slices can be displayed individually or in a dynamic ciné mode. The individual slices reduce tissue overlap and structure noise relative to standard 2D projection mammography, with a total dose com-parable to that required for standard screening mammography.
The digital tomosynthesis device offers a number of exciting opportuni-ties, including the possibility of reduced breast compression, improved diagnos-tic and screening accuracy, 3D lesion localization, and contrast enhanced 3D imaging. Conventional x-ray mammog-raphy is a 2D imaging modality. The
signal detected receptor is dependent upon the total attenuation of all the tissues above the location. This is illustrated in Figure 3. The two objects (ellipse and star) individually attenuate x-rays passing through them on the way to the image receptor; howev-er, the signal detected represents a summation of their attenua-tion. In mammography, pathologies of interest are more difficult to visualize because of the clutter of signals from objects above and below. Tomosynthesis is a method of 3D imaging which can reduce this tissue overlap effect.
The basics of tomosynthesis acquisition theory are illustrat-ed schematically in Figure 4. While holding the breast station-ary, a number of images are acquired at different x-ray source angles. It can be seen from the figure that the objects at different heights in the substance being x-rayed project differently in the different projections. In this example, the two objects superim-pose when the x-rays are at 0º, but the ±15º acquisitions shift the
object’s shadows relative to one another in the images. The final step in the tomosynthesis procedure is recon-structing the data to get 3D information. This is illustrated in Figure 5. In the example on the right side of the figure, the pro-jection images are summed, shifting one relative to another in a specific way that reinforces the ellipsoidal object and reduces the contrast of the starred object by blurring it out. Similarly, in the example on the left side, the same set of acquired projection data can be reconstructed differently, using different shifts of the pro-jection data, to reinforce the star object and blur the ellipse. This method can be used to generate images that enhance objects from a given height by appropriate shifting of the projections relative to one another. Note that additional acquisitions are not required to achieve this; the single set of acquired data can be reprocessed to generate the entire 3D volume set.
Figure 4 . Tomosynthesis Imaging.
With tomosynthesis imaging, images acquired from different angles separate structures at differing heights. Conventional mammography would acquire only the central image.
Figure 3. Signal Detection.
With conventional mammography, the signal detected at the location on the image receptor is dependent upon the total attenuation of all the tissues above the location.
(b)
Figure 1.2: Mammography and Tomosynthesis image takes. (a) A mammog-raphy single image take illustrating the tissue overlap problem that shows that breast cancer can be shielded by dense normal breast tissue. (b) A mul-tiple image take for tomosynthesis showing how the relative position between two targets vary depending on the X-ray’s illumination angle. The views in (b) can be used to unfold the tissue overlap by composing a 3D-volume from the multiple views. The images illustrating this figure are taken from Smith et al. [26].
become the image screening of reference when diagnosing breast cancer [21], [28]. DM can either be digitized Screen-Film Mammography (SFM) when the image is obtained as the digitization of an analogical film or Full-Field Digital Mammography (FFDM) when the image is directly generated in a digital sensor instead of a sensible film.
Although no difference in cancer detection rates between FFDM and SFM [29] have been yet observed, FFDM has become the standard mam-mography screening due to its obvious advantages in a digitized environ-ment.
Advances in X-ray screening of the breast, Breast Tomosynthesis This technique tries to overcome the effect of tissue overlap present in regular mammograms. The screening technique is similar to mammography, the breast is compressed between two plates and X-ray attenuation is measured. The difference is that instead of using a single viewpoint, multiple images of the breast are taken at different angles and further combined to reconstruct them into cross-sectional slices. Figure 1.2 illustrates the effect of taking images at different angles, and figure 1.3 shows an example of taking different images of the same breast (fig. 1.3(a-c)) and the resultant cross-sectional slices from synthesizing the 3D-volume (fig. 1.3(d-f)).
(a) (b) (c) (d) (e) (f) Figure 1.3: Tomosynthesis image acquisition and reconstruction example. Images (a-c) correspond to the X-ray images at different angles of the same take, and images (d-f) correspond to different cross-sectional slices of the reconstructed 3D-volume of the same breast. The images illustrating this figure are taken from A. Smith [30].
1.2.2 Sonography
Ultra-Sound (US) imaging uses high-frequency mechanical waves (sound waves typically within the 1 ∼ 20Mhz range) in order to insonify the area to inspect and capture the waves reflected at boundaries between tissues with
different acoustic properties [9]1. The most common sonography
screen-ing technique applied to breast cancer screenscreen-ing is the hand-held realtime B-mode US imaging system.
B-mode imaging equipment generates two-dimensional images by means of a beam that travels through the tissue. The amplitude of the reflection caused by tissue interfaces is represented as brightness. The depth of the depicted boundaries is proportional to the interval of the reflection arrivals. Despite the advantages that US screening offers, images lack in quality and suffer from severe artifacts. Another inconvenience of US screening is that regular equipment uses a hand-held probe run over the breast surface by the physician in order to take an arbitrary slice of the breast. This approach strongly relates the acquisition to the ability of the user. Further discussion of these topics can be found throughout Section 1.3 of this document.
1
We refer the reader to Ensminger and Stulen [9] for a deeper understanding of US physics and image formation.
Real time spatial compound imaging (or sonoCT )
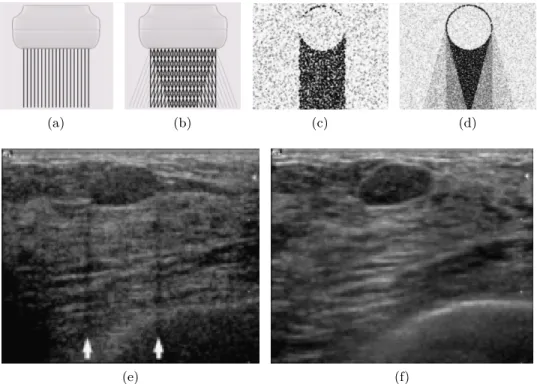
In order to improve the image quality, real time spatial compound imaging, or sonoCT, at every acquisition deflects the US beam and takes three to nine samples at different angles instead of a single take (see fig.1.4a,b) [31]. The sonoCT acquisition procedure of taking multiple views somehow recalls the acquisition process carried out in tomosynthesis. The difference is that sonoCT does not use the extra information to synthetise a 3D-volume, but uses the data redundancy for reducing the artifacts and noise, and to obtain an improved overall image, providing better tissue differentiation [32]. Its main drawback is the bluring effect caused by scene changes between takes. These scene changes can be caused by unintentional movements of the ac-quisition probe in a hand-held US device or due to movement by the patient. Figure 1.4 intuitively compares the sonoCT acquisition process with regular US imaging and also shows the outcome difference. For further details on this technology, the reader is referred to the works of Entrekin et al. [31], [33].
Automated whole Breast Ultra-Sound (ABUS)
Other advances in US acquisition address the dependency of the physician’s skills for taking proper images. In Automated whole Breast Ultra-Sound (ABUS) a much larger transducer is used for exhaustive-scanning of the breast in an automatic manner with no dependency on the user. Then all the acquired slices are combined to generate a three-dimensional volume of the breast, overcoming the limitation of scanning only the focal area of concern as happens in hand-held US screening [34]. Figure 1.5 illustrates both hand-held US and ABUS acquisition systems to intuitively understand the differences between both systems.
Doppler Imaging
Sonographic Doppler imaging or the M-mode sonogram uses the well known Doppler shift effect. When the radiating energy cuts through a moving object, the received signal shifts its frequency depending on the relative velocity between the moving object and the moving observer.
The frequency shift captured by the Doppler effect is displayed as a color overlay in a B-mode image. Doppler imaging supposes a functional image used to visualize the blood flow which is representative of the lesion’s metabolism.
(a) (b) (c) (d)
(e) (f)
Figure 1.4: Comparison between conventional B-mode US imaging and real time spatial compound US imaging (sonoCT). (a,b) linear transducer com-parison: in the conventional acquisition (illustrated in a) a single beam is used, whereas for compound imaging (b) several beams, at different angles, are used. (c,d) illustrates the insonifying advantages of conventional US (c) and sonoCT (d). Finally, (e) and (f) are examples of the same fibroadenoma using conventional screening and sonoCT. Notice that the lateral shadows caused by the fibroadenoma in (e) disappear in (f). Also, a proper hyper-echoic boundary in the fibroadenoma’s upper left hand corner appears in (f), depicting high reflection at the interface between the regular adipose tissue and the lesion which can not be appreciated in (e). The overall image quality of (f) is far superior to (e), supporting the foundings in [32]. All the images used in this figure are taken from Entrekin et al. [33]
(a) (b)
Figure 1.5: Conventional hand-held US and ABUS acquisition devices com-parison. (a) Conventional hand-held US imaging acquisition device. (b) ABUS acquisition device.
Sonoelastography
Sonoelastography can be seen as a highly sensitive ultrasonic palpation col-oring the stiffness of the tissues over B-Mode sonogram [9]. In order to generate the data, pressure is applied over the tissue through mechanical vi-brations (sound wave < 10Hz). Then the Doppler effect is used to measure the movement of the tissues. The stiffer the tissue, the lesser the vibration present compared to softer tissues.
1.2.3 Magnetic Resonance Image (MRI)
Although early efforts of using Magnetic Resonance Image (MRI) imaging to screen breasts were discouraging due to low spatial resolution [35], further studies combined with the use of contrast agents proved MRI to be an effective screening technique to assess breast lesions [4].
MRI screening technologies expose the tissue to a strong magnetic field to excite and align the nuclear particles within the tissue. Then the decay signal of the polarization state of each particle is recorded to generate a three-dimensional image. According to the tissue type, the decay signal shows different characteristics allowing technicians to distinguish the tissue type. Figure 1.6 exemplifies an MRI take of a patient.
The main advantage of using MRI is its capability of capturing functional behavior of the breast using a contrast agent to highlight areas containing a dense blood vessel network (known as angiogenesis areas), a typical char-acteristic of tumor structures.
1.2. BREAST IMAGING TECHNIQUES FOR DIAGNOSIS 9
(a)
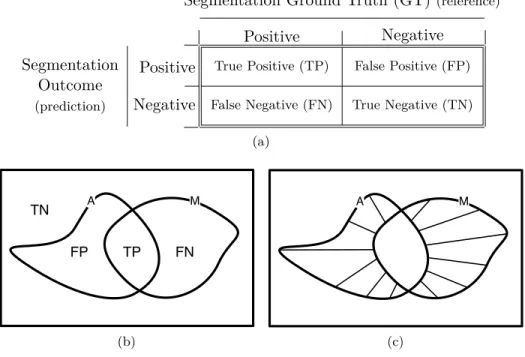
• Evaluation measure: Dice Similarity Coefficient (DSC)
(b)
Figure 1.6: Magnetic Resonance Image (MRI) example. (a) generic Gen-eral Electric healthcare resonance unit (image taken from their catalog) (b) transverse MRI image slice from a patient’s chest, in which the breast and its structures can be clearly identified.
1.2.4 Other breast imaging techniques
In spite of DM being the principal screening technique for breast cancer and both B-mode US imaging and MRI are considered a beneficial and comple-mentary adjunct to mammography, these modalities are far from perfect. Although the use of Full-Field DM has many advantages and commodi-ties [29], its functioning principles are the same as the first proposals of Screen-Film Mammography in the 1960s [36]. In addition, US and MRI have their own limitations, otherwise mammography wouldn’t remain the preferred breast screening modality.
Therefore, improving the current imaging technologies and exploring new imaging modalities is being investigated [21], [26]. Here, some of these modalities are named.
Bioelectric Imaging
This is based on the different electrical properties between normal and ma-lignant breast tissue. These differences are measured with a probe capturing the low level electricity patterns applied to the breast’s surface.
Breast Thermography
An infrared camera is used to identify areas of angiogenesis by tracking the temperature of the blood as it flows into the breast.
Near Infrared Optical Imaging
This technique measures the transmission of near infrared light through the breast so that areas of vascular development (angiogenesis) and/or areas saturated with hemoglobin and oxygen (hyper-metabolism) are highlighted. Contrasts Developing
Contrast agents are being developed to produce contrast-enhanced mam-mographies and functional MRI, where areas with a particular behavior are highlighted during the screening.
Positron Emission Tomography (PET)
This technique is a nuclear imaging technique in the same category as scin-timammography used to restating and evaluating recurrent breast cancer. In Position Emission Tomography (PET), a radioactive glucose, usually 18-fluoro-2deoxyglucose (FDG), is injected into the patient and areas of high tracer uptake are visualized with a gamma camera. A number of breast specific PET scanners are currently in development and being tested in clin-ical trails to demonstrate their efficiency. However, PET examinations are extremely expensive and are not widely available [26].
Scintimammoraphy
This technique is also a nuclear imaging technique which uses a gamma camera to visualize a radioactive tracer. Although recent advances have been made in high-resolution cameras designed specially for breast imaging, the resolution of scintimammography is still low compared to PET [26].
1.3
Ultra-Sound imaging and its role in Breast
Cancer
Although US applied to breast cancer screening was expected to surpass mammography since its initial studies in the early 50s carried out by Wild and Reid [37], and the variety of advances that sonography has under-gone [38], Digital Mammography (DM) is, and remains, the preferred screen-ing technique when diagnosscreen-ing breast lesions [21], [39]–[41]. However, it is widely accepted that extensive mammography density is strongly associ-ated with the risk of breast cancer and that mammographic scanning has
is great controversy in using alternatives to mammography as a primary screening tool since in retrospective review lesion signs can be found in the mammography screenings [39]; it is easily understood that multi-modality readings are more sensitive than any individual test alone [3], [4], [6].
Despite the fact that some studies report that other modalities, such as MRI, have higher sensitivity compared to US [4], sonography is the most common image modality adjunct to mammography because it is widely avail-able and inexpensive to perform [3], [34], [46]. Moreover, US, apart from its detection capabilities, has the ability to discern the typology of solid lesions [5], [11]–[13], [40], which can be used to reduce the number of unnec-essary biopsies prescribed by DM [7], [8], which are estimated to be between 65 ∼ 85% [6]. Eventhough data suggest unnecessary biopsies can be re-placed by short-term US screening follow-up, further studies are needed in order to determine whether this conclusion holds [47].
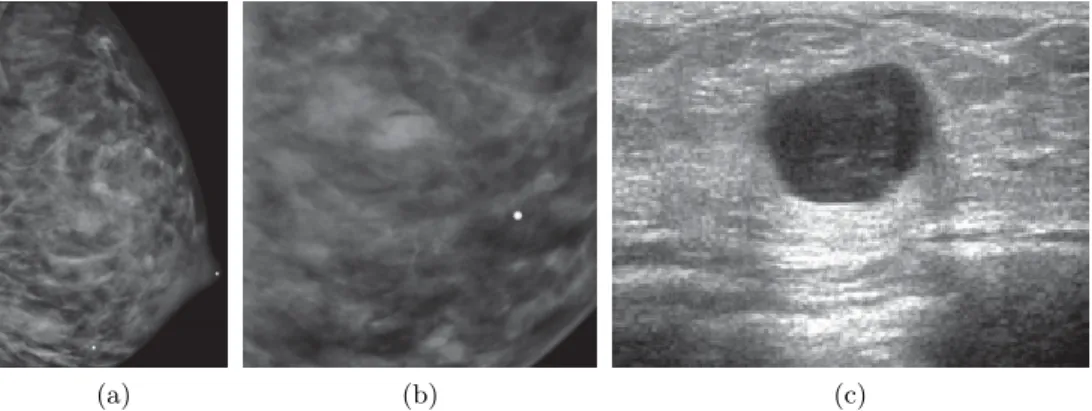
Figure 1.7 illustrates a case taken from Hines et al. [48] where DM and US images of a lactating patient who presented a palpable lesion were taken. In the MLO DM image (fig. 1.7a) and its magnified lateral view (fig. 1.7b), it is hard to spot the lesion, while the lesion is clearly visible when using US screening (fig. 1.7c). The findings in the US data reveal a complicated cyst, which is nothing more than a benign lesion. The patient was declined for aspiration.
1.3.1 Screening of the breast using Ultra-Sound images
The most common US screening technique used for depicting the breast is Hand-Held 2D B-Mode ultrasound imaging. A manually driven transducer (see fig:1.5a) emits high-frequency mechanical waves and captures the reflec-tion of the tissue interfaces to compose a 2D image where the brightness of each spot represents the amount of reflection for that particular position [9]. However, understanding such images is not easy. Therefore, operators and readers must have a thorough knowledge of normal breast anatomy and architecture, which has considerable variability, in order to perform an accurate diagnosis of abnormalities, since the appearance of the lesions are not specific [5], [40], [46].
Since the transducer is driven by the technician, any arbitrary slice plane of the breast can be screened. Figure 1.8 roughly illustrates the topology
(a) (b) (c)
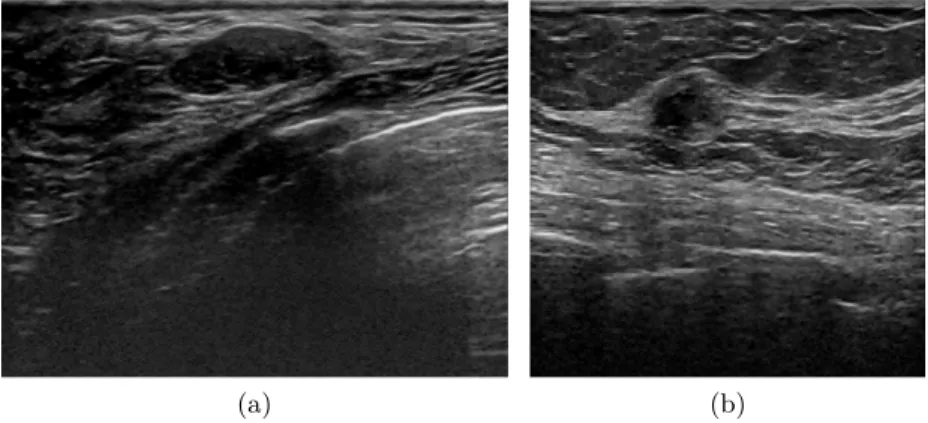
Figure 1.7: Example of lesion shield under DM screening and distinguishable under US screening taken from Hines et al. [48]. Image (a) corresponds to a Medio-Lateral Oblique (MLO) Digital Mammography (DM), (b) is a magnification and (c) corresponds to a Breast Ultra-Sound (BUS) image. of a breast, indicates a possible slice, and shows two US acquisitions of two healthy breasts to illustrate the structures present within the image. As can be observed in figure 1.8, several structures within the breast can be revealed when screening: skin layers, adipose tissue, fibro-glandular tissue, fibrous tissue, muscle tissue and the chest-wall to name the most important. The specific appearance of the breast structures depend on physiological particularities of the breast depicted, as well as the acquisition instrument and its configuration, which is readjusted for every patient/image to obtain a clear view in order to perform a diagnosis through visual assessment of the images [49]. With this pretext, US systems manufacturers incorporate image processing techniques to improve the visualization for better visual reading. However, such image modifications might compromise the comput-erized analysis, since the image modifications are unknown and some of the operations to improve human perception cannot be undone.
Despite the variability in the appearance of breasts, some relationship between tissues hold true, especially the structural ones.
Skin is the most anterior element therefore is depicted at the top of the image, appearing as a bright layer of approximately 3mm or less, often containing a dark central line [40]. The contour and thickness of the skin layer can vary due to inflammation or disease [49].
The chest-wall, when depicted, appears as bright (highly echogenic) arched blobs, which correspond to the anterior part of the ribs and pleura. The chest-wall is the bottom structure in the image, since it corresponds
Lungs (air) Pectoral muscle
Chest-wall
Fibro-glandular tissue
Skin layers Cooper’s ligament
Adipose tissue
fat lobe
(a) (b)
(c) (d)
Figure 1.8: Breast structure screening appearance when using ultrasound. The illustration in (a) gives an intuitive idea of the structures present in a breast and their disposition, while illustration (c) represents how those structures are screened by a US device. Images (b) and (d) are two US images taken from healthy breasts to illustrate how the structures present in a breast are seen under US screening.
to most posterior depicted structure when screening. Just above the lungs, which appear as a noisy black area with no structure, as if it were back-ground.
Just above the chest-wall, the pectoral muscle can easily be identified under sonography as bright elongated streams in the direction of the fibers over a dark background parallel to the skin [49].
The area compressed between the skin and the pectoral muscle corre-sponds to the breast structure, made up of fat lobes (along with the Cooper ligaments) and fibro-glandular tissue in a fairly variable relative amount. The normal appearance of the breast might vary from a completely fatty breast with only a few glandular structures, to a completely glandular breast with little or no fat. When a mixture of adipose and fibro-glandular tissue is present in a US screening, they normally appear in a layered fashion and adipose tissue can be found anterior (above) to fibro-glandular tissue (see fig. 1.8). It is also normal that the fibro-glandular tissue of the breast contains variable amounts of adipose infiltrations.
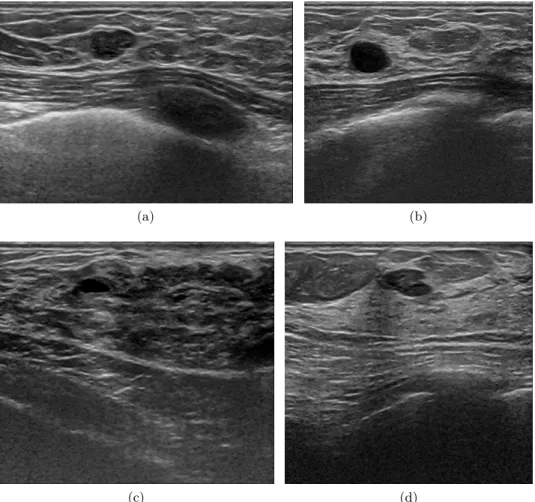
Figure 1.9 illustrates several breast topologies which are rated accord-ingly to the American College of Radiology (ACR) density rates from one to four; one being a completely fatty breast and four a completely dense breast.
When analyzing US images, the terms black, white, dark or bright are not used. Instead, terms like anechoic, hypo-echoic, iso-echoic, hyper-echoic or highly echoic are preferred. Anechoic areas are black areas with no tex-ture due to the lack of scatterers within the tissue. As example, cystic structures show anechoic appearance, since the presence of homogeneous liquid produces no scattering (see fig.. 1.8a,b). As echogenicity reference, adipose tissue (fat) is used so that the structures depicted are denominated hypo-, iso- or hyper-echoic according to their appearance relative to normal breast adipose tissue, since adipose tissue appears near to the middle of the echogenicity spectrum. Although there are other tissues in the middle of the echogenicity spectrum, like periductal elastic tissue or terminal ductal-lobular units, adipose tissue is chosen as a reference because fat lobes are uniformly present in the population and can clearly be identified.
It is worth mentioning here the recommendation of setting the acquisi-tion parameters of the sonographic devices so that adipose tissue appears gray rather than black. Otherwise there is not enough dynamic range to distinguish structures from tissues with a lower echoenicity response such as structures present within some solid nodules resulting in a cyst-like appear-ance [5].
(a) (b)
(c) (d)
Figure 1.9: Breast Ultra-Sound (BUS) image examples of different adipose and fibro-glandular topologies with the presence of lesions. Image (a) shows a fatty breast rated as class 1 where the fat lobes are present from the skin layer all the way down to the pectoral muscle. In this image, a carcinoma intra ductal is spotted as a hypo-echogenic breast region between the skin and the pectoral muscle. The oval shaped dark area below the pectoral muscle corresponds to a rib. Image (b) illustrates a breast rated as class 2. In the image, the subcutaneous fat and fibro-glandular area beneath it can be clearly identified. An anechoic mass can be found within the fibro-glandular tissue, consistent with a cyst. In image (c), the proportion of subcutaneous fat over fibro-glandular tissue is very little. However, the darkness and uneven aspect of the fibro-glandular tissue indicates infiltrated fat combined with the fibro-glandular tissue giving an overall class 3 of breast density. Notice that within the fibro-glandular tissue, there is a completely anechoic oval spot producing slightly posterior enhancement, corresponds to a cyst. Image (d), rated as a class 4, shows a dense and homogeneous fibro-glandular pattern despite the presence of subcutaneous fat. The hypo-echoic region, with an appearance similar to an isolated fat lobe, corresponds to a fibroadenoma.
![Figure 1.1: Mammography Medio-Lateral Oblique (MLO) and Cranio- Cranio-Caudal (CC) view points: (a) illustrates the projection of the two most used view points (image from [27]), which produces images like the Medio-Lateral Oblique (MLO) in (b) and the Cr](https://thumb-eu.123doks.com/thumbv2/123doknet/14545780.725341/36.918.168.677.188.452/mammography-lateral-oblique-illustrates-projection-produces-lateral-oblique.webp)