HAL Id: cea-03211757
https://hal-cea.archives-ouvertes.fr/cea-03211757
Submitted on 30 Apr 2021HAL is a multi-disciplinary open access
archive for the deposit and dissemination of sci-entific research documents, whether they are pub-lished or not. The documents may come from teaching and research institutions in France or abroad, or from public or private research centers.
L’archive ouverte pluridisciplinaire HAL, est destinée au dépôt et à la diffusion de documents scientifiques de niveau recherche, publiés ou non, émanant des établissements d’enseignement et de recherche français ou étrangers, des laboratoires publics ou privés.
Impact of magnesium on the structure of
aluminoborosilicate glasses: A solid-state NMR and
Raman spectroscopy study
Nicolas Bisbrouck, Marco Bertani, Frédéric Angeli, Thibault Charpentier,
Dominique de Ligny, Jean-marc Delaye, Stéphane Gin, Matthieu Micoulaut
To cite this version:
Nicolas Bisbrouck, Marco Bertani, Frédéric Angeli, Thibault Charpentier, Dominique de Ligny, et al.. Impact of magnesium on the structure of aluminoborosilicate glasses: A solid-state NMR and Raman spectroscopy study. Journal of the American Ceramic Society, Wiley, In press, �10.1111/jace.17876�. �cea-03211757�
DOI: xxx/xxxx ARTICLE TYPE
Impact of Magnesium on the Structure of Aluminoborosilicate
Glasses: A Solid-State NMR and Raman Spectroscopy Study
Nicolas Bisbrouck
1| Marco Bertani
2| Frédéric Angeli*
1| Thibault Charpentier*
2| Dominique de
Ligny
3| Jean-Marc Delaye
1| Stéphane Gin
1| Matthieu Micoulaut
41CEA, DES, ISEC, DE2D, Université de
Montpellier, Marcoule, France
2Université Paris-Saclay, CEA, CNRS,
NIMBE, 91191 Gif Sur Yvette, France.
3Department of Materials Science and
Engineering, University of
Erlangen-Nürnberg, DE91058 Erlangen, Germany
4Sorbonne Université, Laboratoire de
Physique Théorique de la Matière Condensée, CNRS UMR 7600, 4 Place Jussieu, 75252 Paris Cedex 05, France
Correspondence
Frédéric Angeli and Thibault Charpentier Email: frederic.angeli@ceaf.fr and thibault.charpentier@cea.fr
Present Address
Marco Bertani : Department of Chemical and Geological Sciences, University of Modena and Reggio Emilia, via G.Campi 103, 41125, Modena, Italy
Abstract
Seven magnesium-containing aluminoborosilicate glasses, with three to five oxides, have been studied through comprehensive multi-nuclear solid-state NMR (11B,27Al, 29Si,23Na,17O and25Mg) and Raman spectroscopy. The progressive addition of cations and the substitution of sodium and calcium by magnesium illuminate the impact of magnesium on the glass structure. The proportion of tri-coordinated boron drastically increased with magnesium addition, demonstrating the poor charge-compensating capabilities of magnesium in tetrahedral boron units. Oxygen-17 NMR showed the formation of mixing sites containing both Na and Mg near non-bridging oxygen sites. Furthermore, a high magnesium content appears to result in the for-mation of two sub-networks (boron and silicon rich) with different polymerisation degrees as well as to promote the formation of high-coordination aluminium sites (Al[V] and Al[VI]). Finally, magnesium coordination ranging from four to six, with a mean value shifting from five to six along the series, suggests that magnesium might endorse an intermediate role in these glasses.
KEYWORDS:
magnesium-25, structure, Raman spectroscopy, borosilicate glass, nuclear magnetic resonance, oxygen-17
1
INTRODUCTION
Magnesium oxide is a key component in geological sili-cate melts and can induce interesting properties in silisili-cate glasses with applications in various fields, from medicine
to technological systems1. As one of the most abundant
cations in magma, the study of magnesium-containing sili-cate glasses is fundamental to understanding magma trans-port2,3. In bioactive glasses used for bone repair, magnesium
appears to enhance crystallisation and apatite formation in the early stages, favouring contact with living tissues4–7. From
a technological point of view, adding magnesium to glasses intrinsically changes their properties such as viscosity8, glass
transition temperature4, mechanical properties8–12and
chem-ical durability13. Furthermore, some of the vitrified high-level
waste (HLW) from nuclear facilities in the UK (Magnox)14–16
and France (AVM)17,18 contains relatively high magnesium
proportions (around 5.90wt% and between 2.5 and 7.5wt% respectively17).
The role and impact of magnesium on the glass structure and its interactions with other cations are not yet fully under-stood; they can vary greatly with the chemical composition of the glass10,15. To understand the macroscopic properties
of glasses, specifically the impact of magnesium, we per-formed an in-depth and detailed structural analysis at the atomic scale of glasses with various compositions, from sim-ple to more comsim-plex ones. Generally considered as a network modifier and/or a charge compensator, several studies suggest that magnesium might exhibit an intermediate-to-network-forming role15,19–21. These assumptions are mainly based on
extracted from X-ray diffraction22–25, neutron scattering22,23
and Raman26,27spectroscopy measurements as well as using
molecular dynamic (MD) and reverse Monte-Carlo (RMC) simulations23–25.
Solid-state nuclear magnetic resonance (NMR) spec-troscopy has proven to be a useful and effective tool for probing the local environment of atoms in glasses, provid-ing insights into the intricacies of silicate oxide glassy sys-tems28–36. The network connectivity (Q
𝑛), non-bridging
oxy-gens (NBO), and coordination number (CN) can be precisely evaluated by investigating every NMR-active nucleus found in these glass systems, typically27Al,11B,29Si, 23Na,25Mg, 43Ca and 17O10,37–41. While each nucleus provides specific
information on its local chemical and geometric environment,
17O NMR spectra provide insight into the various possible
environments in oxide glasses. To that end, the best approach is to synthesise glasses using a sol–gel process to ensure a homogeneous distribution of17O in the network29.17O NMR
measurements allow the observation of peculiar phenomena, such as the presence of Ca–Na or La–Na mixing sites near NBO-rich regions42,43, which implies an extended structural
disorder due to the non-randomness of the alkali/alkali-earth distribution. Recent studies34showed that Mg–Na mixing sites
might also occurs. It is also implied that increasing the mag-nesium content leads to greater structural changes around the NBO in the glasses.
For nuclei such as29Si,27Al, or11B, a decrease in
chemi-cal shift typichemi-cally results from an increase in the coordination number. For25Mg, most studies on the subject have focused on
crystalline phases, meltsor very simple glasses19,20,30,44,44–49;
therefore, there is a lack of25Mg NMR data, particularly for
borosilicate glasses. Indeed measuring the NMR spectrum of 25Mg is difficult because of its low natural abundance
(10%) and low Larmor frequency. Moreover, 25Mg exhibits
high quadrupolar interactions which can severely broaden the NMR spectra, making it even harder to distinguish magnesium environments in terms of the coordination number. With a suf-ficiently high enrichment in25Mg and owing to the availability
of higher fields (in this work,17.6 T), it is possible to overcome
these difficulties. Magnesium coordination in glass spectra can be approximately determined from NMR shifts from a comparison with the NMR spectra of crystalline materials, such as spinel (MgAl2O4) and åkermanite (Ca2MgSi2O7) for
which the four-fold coordinated magnesium isotropic chemical shifts are 49 and 52 ppm19. In the boron-containing
min-eral grandidierite, the MgO5 bipyramid has been reported to
have an approximately 55 ppm isotropic chemical shift50. In
silicates containing magnesium, a six-fold coordinated mag-nesium contribution is visible in the range of 5 to 14 ppm19,51.
However, some parameters such as bond length52–54and bond
angle55 or the second-neighbours effect28,55 can affect the
isotropic chemical shift, making it difficult to clearly identify the coordination.
In addition to the complexity of the structural role of mag-nesium and its coordination number in glasses, its impact on other cations in the network has not yet been clearly explained. Several studies have demonstrated that increasing the mag-nesium content in glasses leads to a greater proportion of highly disrupted four-fold coordinated aluminium and the for-mation of five- and six-fold coordinated aluminium10,32,38,56.
Additionally, in borosilicate glasses, it appears that a relative increase in magnesium concentration compared to that of boron leads to an increase in three-fold coordinated boron that is greater than the effect of calcium14,15,56–58. It is
sug-gested that this effect can be attributed to the greater mean field strength (MFS), defined as the charge over the squared cation-oxygen distance, of magnesium compared to other network-modifying cations.
In this study, comprehensive structural characterisation using multinuclear magic-angle spinning (MAS) and multi-ple quantum magic-angle spinning (MQMAS) NMR (27Al, 11B,29Si,23Na,17O, and25Mg) of seven glasses (with three
to five oxides) was performed to clearly identify the effect of magnesium on the glass structure. Glasses enriched in
17O and25Mg were also synthesised. Heteronuclear11B–23Na
rotational-echo double-resonance (REDOR) experiments were conducted to investigate the impact of magnesium on the spatial proximity of sodium and boron. Additionally, Raman spectroscopy was performed on all the glasses.
Most glasses in this study had constant Si/Al and Si/B ratios (close to the industrial composition of AVM V417,18) with
a varying Mg/Na content, except when the Mg content was found experimentally to be too high to yield a homogeneous glass. In this case, Si/Al and Si/B were decreased by 30%. A simple three-oxide (SiO2, Na2O, MgO) glass was prepared to
confirm the specific contribution of Si–O–Mg to the17O MAS
NMR spectra owing to the strong overlap of Si–O–Al, Si–O– Na and Si–O–Mg sites34. In addition, a glass with magnesium
substituted for calcium was also examined for comparison.
2
MATERIALS AND METHODS
2.1
Glass synthesis and composition analysis
Twenty-four glasses, divided into four series, were synthe-sised using different melt-quench methods depending on their isotopic enrichment in 11B, 17O and 25Mg. The four series
are indexed as Nat (for natural/no enrichment),11B,17O, and 25Mg, corresponding to their respective isotopic enrichment. 17O glasses were prepared using a sol–gel process. The detailed
syntheses processes are provided for each series in the follow-ing sections.11B-enriched samples were prepared for neutron
analysis, which will be reported elsewhere.
Because we focused on the impact of magnesium on the structure of the studied aluminoborosilicate glasses, the Si/Al and Si/B ratios were maintained constant when possible to syn-thesise a homogeneous structure (crystallisation was observed in glasses with a high magnesium content). In four glasses (N26M0, N19M8, N13M13, and N8M19), magnesiumoxide
was progressively substituted for sodium oxide, as shown in
Table 1. N and M represent the nominal rounded concentra-tion (mol%) of Na2O and MgO, respectively. The amounts of
aluminium and boron had to be increased in the sodium-free composition (N0M12) to obtain a homogeneous glass. Mag-nesium was fully substituted for calcium in the N19C8 glass. A simple reference ternary glass A0B0 (SiO2–Na2O–MgO)
was also prepared for17O NMR spectroscopy. The
composi-tion of the glasses was analysed by inductively coupled plasma optical emission spectroscopy (ICP-OES) afteracid dissolu-tion (HCl + HNO3 + HF). Additionally, some glasses were
analysed using an electron probe micro-analyser at the Cam-paris Centre, which ensured the homogeneity of the glasses at the micrometre scale. Slight variation in composition between the series did not change the observed tendencies, as shown in Figure S1 and S2 in Supplementary Information. It can be seen that only one glass (N13M13) displayed more variation in boron coordination.The lower fraction of B[IV] in the17
O-enriched and25Mg-enriched samples can be explained by
a relative higher MgO content and lower Na2O content compared to the non-enriched glass. Indeed, as stated ear-lier in the manuscript, boron and sodium evaporation was more difficult to control due to the high temperature and low glass quantities. For the sake of simplicity, the discus-sion is based on the nominal composition, from which most of the glasses are close to.Transmission electron microscopy
(TEM) observations were also performed to ensure the absence of nanometre-scale crystallisation.
Nat and
11B-enriched glasses
The seven glasses were synthesised from analytical-grade oxideand carbonatepowders using a classical melt-quench
protocol,aiming for 180 g samples. The powders were mixed
with a Turbula® T2F to ensure homogeneity and poured into a Pt/Rh crucible, which was then placed in a Pyrox® RKA23 electric furnace equipped with a Eurotherm® 2416 regulator. Each increase in temperature occured at a rate of 300 °C.h−1,
while decarbonation dwell was performed at 850 °C for 1 h. The target temperature was then achieved and maintained for 3 h before quenching on a fall plate. The glasses were then crushed, and a second fusion was performed to ensure bet-ter homogeneity. These batches were then annealed (except
for two impacted by crystallisation issues, namely N8M19 and N0M12) for 1.5 h in a graphite crucible at a target tempera-ture of 𝑇𝑔 + 20 °C, determined with a SETARAM SETSYS
TMA S60/58507 operating in differential scanning calorime-try (DSC) mode under an argon atmosphere. Each temperature is given in Table 1 with the nominal compositions.
The 11B enriched glasses were synthesised following the
same protocol except for the boron precursor, which was replaced to achieve 99.62% enrichment (Euriso-top, aim-ing for 20 g samples . These glasses were prepared for a
forthcoming neutron diffraction study.
17
O-enriched glasses
To ensure enrichment of the entire network, seven 17
O-enriched glasses were synthesised using a sol–gel process. This was made possible through the use of alcoxide precursors and hydrolysis reactions following Equations 1 and 2, with M and M’ cations and R and R’ organic groups29.
𝑀(𝑂 − 𝑅)𝑛+ 𝐻217𝑂 →𝑀(𝑂 − 𝑅)𝑛−1−17𝑂𝐻+ 𝑅 − 𝑂𝐻 (1) 𝑀(𝑂 − 𝑅)𝑛−1−17𝑂𝐻+ 𝑀′(𝑂 − 𝑅) −17𝑂𝐻 →(𝑂 − 𝑅)𝑛−1𝑀−17𝑂− 𝑀′(𝑂 − 𝑅)𝑛−1+ 𝐻217𝑂 (2) The precursors were mixed with anhydrous absolute ethanol, and then with a stoichiometric amount of 90%-enriched H17
2 O(Cortecnet). After four–six weeks (to ensure
full hydrolysis), the gels were dried, mixed, poured into a Pt crucible, and left overnight under argon flux in a Nabertherm® P310 electric furnace. Equivalent non-enriched glasses for composition analysis were synthesised simultaneously under the same conditions. A dehydration dwell was performed at 160 °C for 0.5 h with the temperature increasing at 300 °C.h−1.
Once at the target temperature T (1060 °C < T < 1400 °C), the mixture was fused for 25 min and then quenched. Because of the small glass quantities (200 mg), the target temperatures
were reduced compared to those of the Nat glasses to min-imise boron and sodium evaporation.However, considering the small glass samples, this evaporation is more difficult to control.
25
Mg-enriched glasses
All glasses were synthesised by mixing analytical-grade oxide
and carbonatepowders with 99.2% enriched25MgO
(Cortec-net following the same route as the 17O-enriched glasses
except for the dwell, which was performed at 850 °C. The target temperature remained the same, i.e. 1060 °C < T < 1400 °C,and the targeted sample mass was 300 mg.
Glass ID Chemical composition (mol%) 𝑇𝑔(°C) 𝜌
SiO2 B2O3 Al2O3 Na2O MgO CaO
N26M0 51.3 14.9 7.7 26.1 - - 523 2.505 N19M8 51.2 14.9 7.7 18.7 7.5 - 573 2.45 N13M13 51.2 14.9 7.7 13.1 13.1 - 594 2.421 N8M19 51.2 14.9 7.7 7.5 18.7 - 642 2.412 N0M12 51.3 24.2 12.4 - 12.1 - 703 2.31 N19C8 51.2 14.9 7.7 18.7 - 7.5 573 2.511 A0B0 66.1 - - 24.2 9.7 - 495 2.486
TABLE 1Nominal targeted composition of the studied glasses, expressed in molar percent of oxide, alongside associated glass
transition temperature (𝑇𝑔) and measured density (𝜌). The analysed composition averaged over all series fell within a standard
deviation of ±2% between the series, ensuring valid comparisons. The standard deviation of the N0M12 glass reached 6% because of boron evaporation during synthesis caused by the high temperature and low mass of glass.
Sample preparation
Glass powder was obtained through grinding, sieving, and ultrasonic cleaning in both acetone and ethanol. Grinding was performed using a Retsch® MM400 with tungsten carbide balls. 20–40µm, 63–100 µm and 100–125µm powder frac-tions were selected for different experiments. The powders needed for TEM were obtained through sedimentation fol-lowing Stokes’ law. Square-shaped monoliths were cut and polished to achieve a surface roughness of a few nanometres.
2.2
Structural characterisation
Nuclear Magnetic Resonance (NMR)
11B,23Na,27Al,29Si, and17O MAS NMR spectra were
col-lected on an Avance II 500WB Bruker spectrometer operating at a magnetic field of 11.72 T using a Bruker WVT CPMAS 4 mm probe (with a MAS stator free of boron oxide to avoid a strong11B signal) at a spinning frequency of 12.5 or 14 kHz.
For 11B,23Na, and 27Al, MAS NMR spectra were acquired
using a single short pulse (≈ 𝜋∕12) to ensure the quanti-tativeness of the spectra, (because of the non homogeneous excitation of resonance of quadrupolar nuclei for long pulse) with recycle delays of 2 s, 1 s, and 1 s, respectively.29Si and 17O MAS NMR spectra were acquired using a Hahn echo
pulse sequence, 90°–𝜏𝐸–180°–𝜏𝐸–acquisition, with a
rotor-synchronised echo delay (𝜏𝐸) of one period of rotation (for
17O, soft pulses selective on the central transition were used).
MQMAS experiments were performed with a Z-filter pulse sequence for 27Al59, a shifted-echo pulse sequence for 17O
(with an echo delay of 2 ms)60, and a RIACT-II pulse sequence
for 11B and23Na28. For the11B–23Na REDOR experiments,
selective 90° and 180° pulses (at frequencies of 10 to 20 kHz and 180° pulse durations of 8 to 10 µs) were applied on the central transition (1/2↔1/2)61.
25Mg NMR data were collected on an Avance III 750 WB
Bruker spectrometer operating at a magnetic field of 17.6 T using a low-gamma 4 mm CPMAS Bruker Probe at a spin-ning frequency of 12.5 kHz. A Hahn spin–echo pulse sequence (with selective soft pulses on the central transition, 90° ≈ 10µs) was used with a rotor-synchronised echo delay of one rotation period and recycle delay of 0.5 s. Typically, 32768 scans were accumulated for each spectrum.
The 11B,23Na, 27Al, 29Si, 17O, and 25Mg chemical shifts
were referenced to external samples of a 1M boric acid solution (19.6 ppm), a 1M AlCl3aqueous solution (0 ppm), a 1M NaCl
aqueous solution (0 ppm), solid tetrakistrimethylsilane (TKS) (for which the highest intensity peak is situated at 9.9 ppm from that of tetramethylsilane, TMS),17O-enriched water (0 ppm),
and a 1M MgCl2aqueous solution (0 ppm).
All NMR data were processed and fitted using a custom-built code (T. Charpentier) that implements specific lineshapes for amorphous materials and accounts for the distribution of NMR parameters, as detailed in previous studies28,29,62–64.In
few words, the principles of our approach is to use a dis-tribution of the NMR parameters, namely the isotropic chemical shift 𝛿𝑖𝑠𝑜 and the quadrupolar parameters 𝐶𝑄 and 𝜂𝑄, induced by the structural disorder inherent to the vitreous state. In a simple case such as vitreous silica,
such NMR parameter distribution could be mapped into a distribution of geometrical parameters such as the Si–O and Si–O–Si distance65,66. The choice of the models were
based on previous works on various compositions, rang-ing from simple binary sodium silicate67and borosilicate68
to more complex borosilicate28, aluminoborosilicate57and
aluminosilicate glasses26. With this description of the NMR
lineshapes, the NMR parameter values which are reported are therefore the mean value (and standard deviations val-ues, i.e. the width) of the distribution (see Supplementary Information).
Raman Spectroscopy
Raman spectra were recorded using a custom-assembled system69 comprising a Horiba iHR320 spectrometer with
1800 g.mm−1 gratings powered by a blue ’Sapphire SF’
488 nm laser. Short laser wavelengths are favourable for recording backscattered signals because of the increased Rayleigh scattering. The laser was focused 10 mm below the surface of the optically polished samples, allowing quantitative evaluation of the intensity. The laser excitation was rejected using a volume Bragg grating. Data were collected from 20 to 1535 cm−1. The spectral window was chosen as a
compro-mise to observe both the maximum of the boson peak and the majority of the B–O stretching modes. For the glasses pre-senting relatively weak Raman activity, six accumulations of 30 min were obtained in the exact same condition and posi-tion in parallel VV and perpendicular VH polarisaposi-tions to be able to extract the polarisation coefficient with high precision. The spectra were corrected from the air contribution that was observed in the low-frequency region70. For samples
show-ing no luminescence, no further correction or baseline was needed, and they were normalised to the total area. Brillouin spectra were recorded using a JRS TFP 2 HC tandem multipass Fabry–Perot interferometer.
3
RESULTS
3.1
Solid-state NMR
3.1.1
29Si MAS NMR
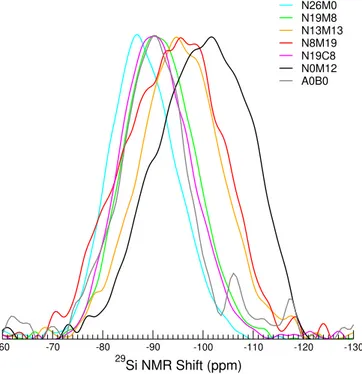
Forbinary alkali silicate glasses,29Si MAS NMR provides
insights into the polymerisation of the glass network through the determination of the Q𝑛populations33. However, in more
complex glasses, the isotropic chemical shift is also sensitive to second-neighbour atoms (their nature and amount), which makes interpreting the signal more difficult.At constant poly-merisation degree, i.e. for a given Q𝑛unit,network formers
(such as Al and Zr)28,55tend to shift the signal to higher
val-ues, while modifiers shift the signal towards lower (i.e. more
-130 -120 -110 -100 -90 -80 -70 -60 29 Si NMR Shift (ppm) N26M0 N19M8 N13M13 N8M19 N19C8 N0M12 A0B0
FIGURE 1(Colour online) 29Si MAS spectra for glasses in
the Nat series, normalised to the maximum peak height.
negative) values71,72. A broadening of the line is indicative of
a more distributed silicon environment, resulting from a larger Q𝑛 distribution or an increase in the number of Si–O–X (X
= B, Al) sites. For example, overlapping of Q3with Si as the
second neighbours and Q4with Al as a second neighbour has
been reported in the past73. Generally, a shift towards a lower
chemical shift value is indicative of a more polymerised net-work with higher Q𝑛species. Figure 1 shows the obtained29Si
MAS NMR spectra. There was a clear decrease in the NMR shift with increasing magnesium content, as well as a broaden-ing of the spectrum. The N8M19 glass, which had the highest magnesium content, displayed the broadest line, as did the N0M12 glass. Watts et al.21suggested that in bioactive glasses,
this type of broadening could also result from the formation of tetrahedral magnesium inside the silicate network. When substituting calcium with magnesium (i.e. comparing N19C8 with N19M8), the line became broader and shifted to a slightly lower value, which could suggest a higher degree of polymeri-sation. The clear shift in the spectra to lower frequencies is reflective of Q4 units connected to silicate units (in vitreous
silica, the 29Si MAS NMR spectrum is centred at
approxi-mately -110 ppm). These variations suggest the formation of a sub-network enriched in silica with increasing magnesium content. In contrast, for a low magnesium content (for example N26M0), the NMR shifts (Q2 and Q3) suggest a relatively
3.1.2
27Al MAS and MQMAS NMR
Figure 2 (a) shows the MAS NMR spectra obtained for the six aluminium-containing glasses in the Nat series. Except for the N0M12 glass, aluminium was predominantly found in tetrahedral units (Al[IV]). Increasing the magnesium con-tent at the expense of sodium concon-tent (i.e. from N26M0 to N8M19) induced a slight shift in the NMR shift values as well as a slight broadening of the lines. This was most prob-ably due to an increased distortion of the Al environment, which can be explained by the presence of Mg in the vicinity instead of Na10. Calculation of the full width at half
maxi-mum (FWHM) of the spectra reveals that when comparing Ca and Mg in the N19C8 and N19M8 glasses, respectively, N19C8 displays a slightly higher value. However, this might be due to small variations in the composition. For the specific case of N0M12 (no sodium), the line broadened and shifted substantially (as a result of the increase in the quadrupolar interactions, see below), and higher coordination states (Al[V] and Al[VI]) appeared. These environments were observed at approximately 30 and 3 ppm, respectively, which are typical values of such coordination10,32,38,56. The latter two were more
visible in the MQMAS spectra, as shown in Figure 2 (c). Anal-ysis of the MQMAS and MAS spectra yielded the population of each AlO𝑥species as follows: 78% Al[IV], 16% Al[V] and
6% Al[VI]. Variations in the NMR parameters are given in Table S1 and are displayed in Figure S2 in the Supplementary Information. The significant increase in the quadrupolar cou-pling constant for Al[IV] is clearly indicative of the impact of charge compensation by Mg cations on the local electric field gradient (EFG). Comparison with the other glass compositions suggests that Al[IV] is predominantly charge compensated by Na cations. The difference between N19M8 and N19C8 might be indicative of larger mixed charge compensation in N19C8: both Na+ and, to a lesser extent, Ca2+ are in the vicinity of
Al[IV], whereas in N19M8, it appears to be more difficult for Mg to contribute to the charge compensation shell.
3.1.3
11B MAS NMR
MQMAS spectra of all the glasses are displayed in Figure 3, from which the MAS spectra and isotropic projection are extracted. NMR parameters are given in the Supplementary Information in Table S1.The B[III] and B[IV] peaks were well resolved in the 11B MAS spectra, as shown in Figure 4 (a)–
(b). Tetrahedral B[IV] units were characterised by a narrow peak (because of a small quadrupolar coupling constant) at approximately 0 ppm, whereas the broad shape of the planar triangular B[III] unit peak, centred around 10 ppm, is reflec-tive of a large quadrupolar coupling constant, typically 2.4–27 MHz for B[III] units in borosilicate glasses. To quantify each unit population, it is generally found that at least two sites are
-40 -20 0 20 40 60 80 100 27 Al NMR Shift (ppm) Al[IV] Al[V] Al[VI] N26M0 N19M8 N13M13 N8M19 N19C8 N0M12
(a)
0 10 20 30 40 50 60 70 80 27 Al MAS NMR Shift (ppm) -50 -40 -30 -20 -10 0 27Al Isotropic NMR Shift (ppm) N26M0 (b) 0 10 20 30 40 50 60 70 80 27 Al MAS NMR Shift (ppm) -50 -40 -30 -20 -10 0 27Al Isotropic NMR Shift (ppm) N0M12 (c) Al[IV] Al[V] Al[VI] -40 -20 0 20 40 60 80 100 27Al NMR Shift (ppm) Experiment Simulation Al[IV] N26M0 (d) 100% -60 -40 -20 0 20 27Al Isotropic NMR Shift (ppm) Experiment Simulation (e) Al[IV] Al[V] Al[VI] N0M12 78% 16% 6%FIGURE 2 (Colour online) (a) 27Al MAS spectra for all
glasses in the Nat series, normalised to the maximum peak height. (b) 27Al MQMAS spectra of N26M0, fully
tetra-coordinated, and (c) N0M12, for which penta- and hexa-coordinated aluminium are visible. Comparison between experimental and simulated (d) NMR MAS spectra of N26M0 and (e) isotropic NMR shift of N0M12 for quantification purposes (±2%).
necessary for each coordination state. The isotropic projections of the MQMAS spectra shown in Figure 4 (c)–(d) highlight the two components for B[III] units (generally referred to as ring and non-rings units74) that are dependent on their
connectiv-ity to the silicate network (ring species are bonded to boron atoms). For B[IV], the asymmetric shape of the peak is also evident. A more detailed investigation of the MQMAS B[IV] peak (as well as its counterparts in the MAS spectrum) can be found elsewhere28,75,76. Similar to B[III], the two components
can be interpreted in terms of connectivity with the silicate net-work (i.e. B[IV] connected to 3 or 4 SiO2 units): an increase
of Si connectivity leads to more negative isotropic chemical shifts28,74,76. -10 0 10 20 30 40 50 N26M0 ring non-ring B[IV] B[III] * N19M8 -10 0 10 20 30 40 50 11 B Isotropic NMR Shift (ppm) N13M13 N8M19 -5 0 5 10 15 20 -10 0 10 20 30 40 50 N0M12 11 B NMR Shift (ppm) -10 -5 0 5 10 15 20 N19C8
FIGURE 3 (Colour online) 11B MQMAS spectra obtained
from 11B-enriched glasses, with the exception of N13M13
(for which the spectrum was acquired from the Nat series). Asterisks denote rotational band position for all spectra.
As shown in Figure 4 (a), progressively increasing the mag-nesium content at the expense of sodium resulted in an increase in B[III]. The N0M12 glass displayed the lowest B[IV] con-tent of all the glasses, with only 2%. This increase in B[III] was also observed when substitutingmagnesium for calcium
in the N19C8 and N19M8 glasses (from 54% to 63%, respec-tively), as shown in Figure 4 (b). Additionally, increasing the magnesium content along the series resulted in a higher con-tribution of B[III], associated in the literature to both non-ring and ring units, as well as when calcium was substituted by magnesium, as seen in Figure 4 (c)–(d). It appears that both sets of11B NMR data from the high-magnesium glasses show
some similarities with previous experiments on SBN (SiO2–
B2O3–Na2O) glasses in the immiscibility domain77and Pyrex
glass78, with a high B[III] ring component. These experiments
suggest that magnesium could impact the glass network in a similar manner, resulting in the formation of a demixed sili-ca/boron network at the nanoscale. When applying the Yun, Dell and Bray model, accounting for the preferential com-pensation of Al[IV] by sodium atoms, and considering Mg as a network modifier, modelling the %B[IV] from the glass composition shows that high magnesium glasses largely devi-ate from the predicted behaviour (inset in Figure 4 (a)). This indicates that the specific role of magnesium remains unclear.
3.1.4
23Na MAS NMR
As shown in Figure 5, the 23Na MAS peak moved to more
negative NMR shifts with a slightly decreasing width as the magnesium content increased. The latter effect is reflective of a decrease in the quadrupolar coupling constant. The decrease in the chemical shift is indicative of a change in the role of sodium in the glass structure, from a network modifier surrounded by NBOs to a charge compensator37. When
substi-tuting calcium with magnesium, both effects occurred, which is consistent with the poorer charge-compensating capabilities of magnesium compared to calcium (as noticed for Al[IV] and B[IV]). The fraction of charge-compensating sodium was cal-culated for each glass, accounting for the B[IV] and Al[IV] fractionsi.e. considering that sodium compensated for alu-minium first, then tetrahedral boron units (the remaining sodium generating NBOs) and performing the ratio of these charge-compensated units over the total number of sodium. The results are consistent with the observed shift,
ranging from 62% for N26M0 and increasing progressively to reach 100% charge-compensating sodium for N8M19. A rep-resentative MQMAS experiment is shown in Figure 5 (b): a single peak is confirmed. Variations in the NMR parameters extracted from MAS NMR are given in Table S1 and Figure S4 in the Supplementary Information. A clear increase in the isotropic chemical shift is observed, correlated to an increase in the quadrupolar coupling constant.
3.1.5
11B{
23Na} REDOR
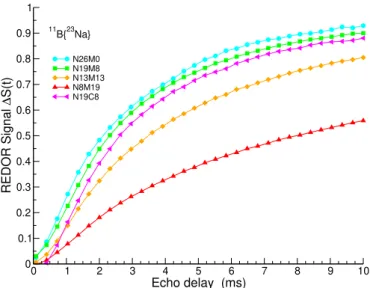
11B{23Na} REDOR experiments were performed to study the
variation in the sodium–boron spatial proximities with the glass composition. The results are shown in Figure 6. A weaker signal indicates that there were fewer sodium atoms in the vicinity of the boron atoms. The initial slope (from 0 to 2– 3 ms) reflects dipolar interactions, while the maximum value is representative of the total number of interacting atoms. The N26M0 signal was stronger with a maximum value of ≈0.9 (with a theoretical maximum of 1), indicating that 90%
-10 -5 0 5 10 15 20 25 11 B NMR Shift (ppm) N26M0 N19M8 N13M13 N8M19 N0M12 0 10 20 30 40 50 60 70 80 Measured B[IV] % 0 10 20 30 40 50 60 70 80
Dell & Bray B[IV] %
63% 43% 93% 98% 75% (a) -10 -5 0 5 10 15 20 25 11 B NMR Shift (ppm) N19M8 N19C8 63% 54% (b) -20 0 20 40 60 80 11 B Isotropic NMR Shift (ppm) N26M0 N19M8 N13M13 N8M19 B[III] B[IV] non-ring ring (c) -20 0 20 40 60 80 11 B Isotropic NMR Shift (ppm) N19M8 N19C8 non-ring ring B[III] B[IV] (d)
FIGURE 4(Colour online) Experimental11B MAS spectra (a) of magnesium-containing glasses in the Nat series with
calcu-lated B[III] percentages (inset displays the Yun, Dell, and Bray model B[IV] calculation as a function of measured B[IV]), and
(b)comparison between the impact of Ca and Mg on boron coordination with associated isotropic projects of11B MQMAS
spectra with ring and non-ring contribution for glasses (c) with increasing magnesium content and (d) comparison between Ca and Mg in glasses. Uncertainties are given at ±1%.
of the boron atoms had sodium atoms in their close vicin-ity. Taking this signal as a reference, it can be observed that the REDOR signals of N19C8 and N19M8 were very close, suggesting a similar sodium environment around the boron atoms. As expected, the signal decreased with increasing mag-nesium content. First, this decrease had a clear origin in the decrease in the B[IV] unit population in favour of the B[III] ring species: the latter are less likely to require sodium cations
in their surroundings (no B-NBO was detected in17O NMR,
see below). As a second origin, some magnesium cations could mix with sodium near NBOs34, most probably in a boron
envi-ronment. Unfortunately, this hypothesis could not be assessed with experiments such as 11B{25Mg} REDOR experiments
(which would have required non-standard NMR equipment). However, the17O NMR data shown below do not support this
-80 -60 -40 -20 0 20 40 23 Na NMR Shift (ppm) N26M0 N19M8 N13M13 N8M19 N19C8 (a) -50 -40 -30 -20 -10 0 10 20 23 Na MAS NMR Shift (ppm) -60 -40 -20 0 20 40 60 80 23Na Isotropic NMR Shift (ppm) CS QIS N19M8 (b)
FIGURE 5(Colour online) (a)23Na MAS spectra for all the
relevant glasses in the Nat series, normalised to the maxi-mum peak height and (b) associated MQMAS spectrum of the N19M8 glass. 0 1 2 3 4 5 6 7 8 9 10 Echo delay (ms) 0 0.1 0.2 0.3 0.4 0.5 0.6 0.7 0.8 0.9 1 REDOR Signal ∆ S(t) N26M0 N19M8 N13M13 N8M19 N19C8 11 B{23Na}
FIGURE 6(Colour online)11B{23Na} REDOR curves for the
relevant glasses in the11B series.
second mechanism. Finally, it is known that sodium preferen-tially compensates for aluminium at the expense of boron79,80,
which is more noticeable as the sodium content decreases.
3.1.6
17O MAS NMR
Because of the poor resolution of the 17O MAS spectra
(displayed in the Supplementary Information in Figure S5), triple-quantum MQMAS experiments were performed and are displayed in Figure 7. The resolution gained in the MQMAS experiments allowed for an in-depth description of the network structure. Contributions from different sites can be identified based on previously published work on
borosilicate glasses29,43,81, simpler glasses (such as
sodium-aluminosilicates31 and magnesium-aluminosilicates32), and
both in different proportions34.
For all studied compositions, Si–O–Al, Si–O–Na, and Si– O–Mg were hardly distinguishable, mostly because of the overlap between the resonances. The MQMAS spectra of the N19C8 and N26M0 glasses show that the Si–O–Al and Si– O–Na peaks were in the same region of isotropic NMR shifts (from –20 to –30 ppm). However, the difference in their respec-tive quadrupolar coupling constants (3–4 MHz and 2 MHz for Si–O–Al and Si–O–Na, respectively), resulted in substan-cial differences in their widths along the MAS NMR shift dimension, allowing both to be visually distinguished in the N26M0 and N19C8 systems: Si–O–Na yielded a sharper peak than that of Si–O–Al. In the case of N19C8, Na–Ca mixing regions were found, as previously reported for other borosili-cate glasses29,82. The latter was absent from all other glasses,
most probably because of the strong overlap between the Si– O–Na and Si–O–Mg peaks (see A0B0). Consequently, quan-titative analysis of these three peaks could not be performed using the present data. However, the similarity of the Si–O– Mg and Si–O–Al peak features (see N0M12) clearly suggests an intermediate role for Mg. For all glass compositions with Na2O, Si–O–Na was present, suggesting the presence of NBO
sites.
Regarding the borosilicate network, the isotropic projec-tions showed that the Si–O–Si contribution (which was present for all glass compositions) shifted towards higher values with increasing magnesium content relative to the reference value of amorphous silica (–38 ppm). The intensity of the B–O–B contribution, as seen around –50 ppm, increased with the same trend, confirming the increase in ringed boron; in contrast, the Si–O–B intensity decreased. These variations are consistent with the previous suggestion that Si/B phase separation at the nanoscale was induced by the magnesium.
In addition, the percentage of NBOs, which are summarised in Table 2, can be calculated from the glass composition using Equation 3, with values given in molar atomic percent.
%𝑁𝐵𝑂 = 100×
2 × ([𝑁𝑎2𝑂] + [𝑀𝑔𝑂] − [𝐴𝑙2𝑂3] − [(𝐵[𝐼𝑉 ])𝐵2𝑂3]) 2 × [𝑆𝑖𝑂2] + [𝑁𝑎2𝑂] + [𝑀𝑔𝑂] + 3 × ([𝐴𝑙2𝑂3] + [𝐵2𝑂3])
(3)
Here, considering that Al[V] is only present in one glass in minor quantities, the assumption was made that all alu-minium units are coordinated by BOs.It can be seen that the
NBO percentage increased with increasing magnesium content in the series, with only slight differences when calcium was substituted by magnesium.
-90 -60 -30 0 30 60 90 17 O MAS NMR Shift (ppm) -80 -70 -60 -50 -40 -30 -20 -10 0 17O Isotropic NMR Shift (ppm) N26M0 Si-O-Na Si-O-Al Si-O-Si Si-O-B -90 -60 -30 0 30 60 90 17 O MAS NMR Shift (ppm) -80 -70 -60 -50 -40 -30 -20 -10 0 17O Isotropic NMR Shift (ppm) N19M8 B-O-B Si-O-B Si-O-Si Si-O-Mg Si-O-Al Si-O-Na -90 -60 -30 0 30 60 90 17 O MAS NMR Shift (ppm) -80 -70 -60 -50 -40 -30 -20 -10 0 17O Isotropic NMR Shift (ppm) N13M13 Si-O-Na Si-O-Mg Si-O-Al Si-O-Si Si-O-B B-O-B -90 -60 -30 0 30 60 90 17 O MAS NMR Shift (ppm) -80 -70 -60 -50 -40 -30 -20 -10 0 17O Isotropic NMR Shift (ppm) N8M19 Si-O-Si Si-O-Na Si-O-Mg Si-O-Al Si-O-B B-O-B -90 -60 -30 0 30 60 90 17 O MAS NMR Shift (ppm) -80 -70 -60 -50 -40 -30 -20 -10 0 17 O Isotropic NMR Shift (ppm) N0M12 B-O-B Si-O-B Si-O-Si Si-O-Mg Si-O-Al -90 -60 -30 0 30 60 90 17 O MAS NMR Shift (ppm) -80 -70 -60 -50 -40 -30 -20 -10 0 17 O Isotropic NMR Shift (ppm) N19C8 Si-O-Ca Si-O-(Ca,Na) Si-O-B B-O-B Si-O-Na Si-O-Al Si-O-Si -90 -60 -30 0 30 60 90 17 O MAS NMR Shift (ppm) -80 -70 -60 -50 -40 -30 -20 -10 0 17 O Isotropic NMR Shift (ppm) A0B0 Si-O-(Na,Mg) Si-O-Si -90 -80 -70 -60 -50 -40 -30 -20 -10 0 17 O Isotropic NMR Shift (ppm) Si-O-Si Si-O-B B-O-B Si-O-(Al/Mg/Na) N26M0 N19M8 N13M13 N8M19
FIGURE 7(Colour online)17O MQMAS spectra of all the studied glasses alongside17O isotropic projections of the four glasses
with increasing magnesium content.
N26M0 N19M8 N13M13 N8M19 N0M12 N19C8 A0B0 B[IV]NMR(%) 57 37 24 7 2 46
-Al[IV]NMR(%) 100 100 100 100 78 100
-NBO (%) 10 13 15 18 5 12 41
TABLE 2B[IV] and Al[IV] percentages evaluated from NMR measurements with calculated total NBO% for all the glasses,
following Equation 3 with compositions from Table 1.
3.1.7
25Mg MAS NMR
Figure 8(a) shows the MAS NMR spectra obtained at a very high field (17.6 T) for the five magnesium-containing glasses. A similar strong spinning-sideband pattern was observed for all compositions. The latter suggests a high quadrupolar cou-pling constant that can be efficiently averaged out by the high magnetic fields and the moderate spinning frequency used (12.5 kHz). Note that for the A0B0 glass, the spinning side-bands were weaker, reflecting the more symmetrical MgO𝑥
sites in this simple glass. The centrebands are shown in the inset of Figure 8. The observed lineshapes were close to those of27Al. A clear variation in the peak maximum was observed:
it decreased with decreasing sodium content. This corrobo-rates that the MgO𝑥 units were less distorted in the A0B0
glass. NMR parameters were extracted by fitting the data using the same lineshapes employed for the27Al NMR spectra: a
gaussian isotropic model (GIM) for the distribution of the quadrupolar parameters coupled to a Gaussian distribution of the isotropic chemical shift62. An example of the fitted
spec-tra is given in the Supplementary Information in Figure S6. Mean values of the quadrupolar coupling constant 𝐶𝑄
(rang-ing from 6.5 to 8.5 MHz)e and isotropic chemical shift 𝛿𝑖𝑠𝑜
(ranging from 5 to 35 ppm) are displayed in Figure 8 (b). A decrease in 𝐶𝑄 was accompanied by a decrease in 𝛿𝑖𝑠𝑜 with
increasing magnesium content for the three five-oxide glasses. N0M12 displayed the lowest 𝛿𝑖𝑠𝑜and highest 𝐶𝑄as opposed
to A0B0, which showed the highest 𝛿𝑖𝑠𝑜and lowest 𝐶𝑄. To the
in borosilicate glasses. The impact of sodium was clearly evi-denced y the decrease in the mean 𝐶𝑄. This supports the idea
that the MgO𝑥coordination sphere is stabilised by Na cations
(Mg–Na mixing), resulting in less distorted (first coordina-tion) oxygen polyhedra around Mg. Regarding the variation in the isotropic chemical shift, using trends observed for other alkali-earth cations (such as calcium)62,83, the observed
vari-ations (increase in 𝛿𝑖𝑠𝑜) could be ascribed to a decrease of
the mean Mg–O distances. Considering that Mg–NBO dis-tances are shorter than Mg–BO (bridging oxygen) disdis-tances, the observed variation between the three groups (N0M12; N8M19, N13M13,N19M8; and A0B0) is consistent with the global increase in %NBO with increasing magnesium con-tent (see Table 2). Slight differences between the N8M19, N13M13, and N19M8 glasses might be the results of finer effects and/or slight variations in the compositions.
3.2
Raman spectroscopy
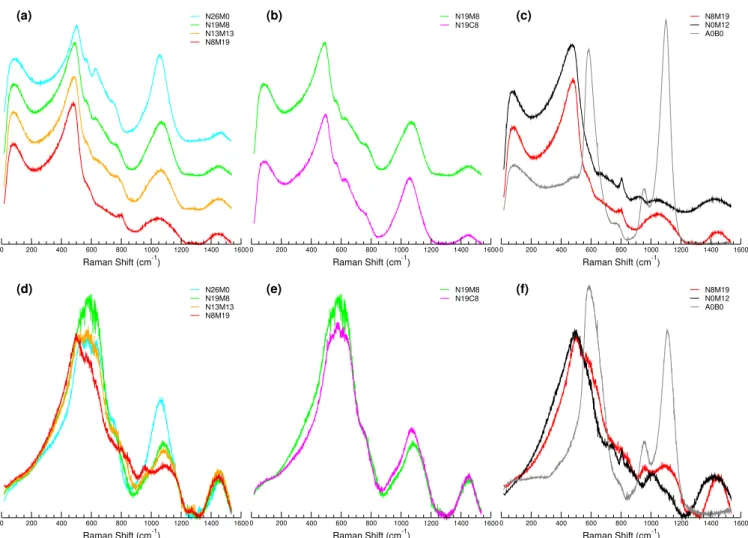
Raman spectroscopy was performed on all the glasses, both with vertical parallel (VV) and horizontal (VH) cross-polarisation, implying that spectra were acquired with both vertical and horizontal polarisation to see the polarisation of the vibrations more precisely. Additionally, different contribu-tions or small variacontribu-tions in the spectra can be highlighted by studying the polarisation ratio of the VV to VH spectra. All the VV spectra and the polarisation ratio VV/VH are displayed in Figure 9. The VH spectra are given in the Supplementary Information in Figure S7, S8 and S9. From the VV spectra, information on the different vibrational contributions and the evolution of their concentration can be deduced directly. Only the totally symmetric vibrational modes were not acting on the polarisation. Therefore the VV/VH provides a complemen-tary information, independent of species abundance, on the local symmetry of the atoms involved in the vibration. In gen-eral the VV spectra and the VV/VH ratio were very similar, which is normal because the symmetric vibration has a higher polarisability and is responsible for the Raman scattering84.
Nevertheless, strong differences can be observed in Figure 9. The contribution at low Raman shifts (below 200 cm−1, also
called boson peak) which is related to the mid-range order of the glass, appears to be insensitive to the collection condi-tions, with a VV/VH ratio close to 1;this is in good agreement with the disordered state of the glass at this length scale. The position of the boson peak in the VV spectra only slightly decreased from 90 to 80 cm−1with the substitution of Na by
Mg. Its intensity increased, and its width narrowed slightly. The main band between 250 and 600 cm−1 is commonly
attributed to the bending modes of T–O–T bonds, where T denotes for tetrahedra85. Figure 9 (a) shows that increasing the
magnesium content at the expense of sodium induced both a
-4000 -3000 -2000 -1000 0 1000 2000 3000 4000 25 Mg NMR Shift (ppm) (a) * * * * * N19M8 N13M13 N8M19 N0M12 A0B0 -250 -200 -150 -100 -50 0 50 100 25 Mg NMR Shift (ppm) 0 5 10 15 20 25 30 35 40 25 Mg δiso (ppm) 6 7 8 9 25 Mg C Q (MHz) N19M8 N13M13 N8M19 N0M12 A0B0 (b)
FIGURE 8(Colour online) (a) Full25Mg MAS spectra, with
the inset magnifying on the –250 – 100 ppm region. Aster-isks are used to denote spinning sidebands. (b) Calculated quadrupolar coupling constant versus isotropic chemical dis-placement of the five25Mg-enriched glasses.
shift to lower frequencies, indicative of an opening of the Si– O–Si angle linked to a higher degree of polymerisation, and an increase in the intensity of this band at the expense of the Q𝑛
band, between 850 and 1275 cm−186–88. This shift also occured
to a lesser extent when calcium was substituted with magne-sium, as shown in Figure 9 (b). The D2 band at 600 cm−1,
assigned to three-membered T rings, tended to merge with the main band with increasing Mg content. The VV/VH ratio over the full main band region remained unchanged. The sec-ond part of the Raman spectra linked with tetrahedra is the Q𝑛 region between 850 and 1200 cm−1. In this region, the
0 200 400 600 800 1000 1200 1400 1600 Raman Shift (cm-1) N26M0 N19M8 N13M13 N8M19 (a) 0 200 400 600 800 1000 1200 1400 1600 Raman Shift (cm-1) N19M8 N19C8 (b) 0 200 400 600 800 1000 1200 1400 1600 Raman Shift (cm-1) N8M19 N0M12 A0B0 (c) 0 200 400 600 800 1000 1200 1400 1600 Raman Shift (cm-1) N26M0 N19M8 N13M13 N8M19 (d) 0 200 400 600 800 1000 1200 1400 1600 Raman Shift (cm-1) N19M8 N19C8 (e) 0 200 400 600 800 1000 1200 1400 1600 Raman Shift (cm-1) N8M19 N0M12 A0B0 (f)
FIGURE 9(Colour online) Peak-area-only normalised Raman spectra obtained with VV polarisation (a) for the glasses with
increasing magnesium content, (b) comparison between the calcium and magnesium containing glasses and (c) comparison between the highest magnesium-containing glass with the two simplest glasses as reference. (d), (e), and (f) shown their respective VV/VH ratios.
a higher distribution of the environment. While compositions differs significantly among the three glasses in Figure 9 (c), it is important to note the apparent separation between Q4
and Q3 units (found around 1150 and 1100 cm−1,
respec-tively) to Q2and potentially Q1units (found around 955 and
890 cm−1, respectively) for both N0M12 and A0B0, which
were not clearly distinguishable for the N8M19 glass. The results obtained for A0B0 are consistent with those observed for similar compositions by Trcera et al.89 and Hehlen and
Neuville90. The ratio between the signals obtained with VV
and VH polarisations, as displayed in Figure 9 (d)–(f) allows clearer visualisation of Q2 for the N8M19 glass as well as
the decrease in shift values for the N0M12, indicative of a higher presence of Q2compared to Q3in this glass. The strong
decrease in VV/VH in all Q𝑛regions with the substitution of
Na by Mg indicates that the apparent decrease in the inten-sity of the Q3 in the VV spectra is associated with a strong
symmetry lowering with the introduction of Mg. As shown Figure 9 (e), a similar but slightly weaker effect was observed with Ca. This symmetry loss can be attributed to the dou-ble charge of both Ca and Mg, which compensate for the NBO in a less homogeneous manner. The breathing modes of borate/borosilicate rings are typically found in the range of 550 to 850 cm−185,91,92, in which danburite-type B
2O7-Si2O7ring
contributions ascribed to 630 cm−1can be isolated85. The latter
contribution disappeared completely at high magnesium con-tents. Parallel vibrational contributions of pentaborate and/or boroxol units around 780–800 cm−1 appeared with
increas-ing magnesium content in the glass series. It can be assumed that the disappearance of the danburite units led to the forma-tion of pentaborate and/or boroxol units. No clear contribuforma-tion of these borate units can be seen in the VV/VH ratio, sug-gesting that they have poor symmetry; therefore, they are bent
or deformed. Only slight variations were observed when cal-cium was substituted with magnesium, making a comparison between the two non-conclusive. At the end of the spectra (1300–1500 cm−1), there were contributions arising from B–
O stretching vibrations linked to B[III] units, consisting of different Gaussian components, 1320 cm−1 for loose B[III]
units, 1410 cm−1 for B[III] units linked to B[IV], 1480 cm−1
for B[III] linked to B[III], and 1515 cm−1 for B[III] linked
to boroxol units87,93–97. N0M12 is the only glass presenting a
strong contribution at 1320 cm−1in Figure 9 (f). The presence
of loose B[III] units can be explained by the high quantity of B atoms. In this condition, isolated B[III] units can be hypoth-esised within the silica network. For all the other glasses, only the contributions at 1410 and 1480 cm−1 were observed. A
small broadening of the low-frequency band was observed with increasing magnesium content in the series; it indicated a higher proportion of tri-coordinated boron. This is consistent with the11B NMR results. However the magnitude of this
mod-ification was significantly lower what was expected, suggesting the B units lowering their coordination preferentially vibrated within ring structures in the 800 cm−1 region. No broadening
was observed when calcium was substituted with magnesium.
4
DISCUSSION
4.1
Impact of magnesium on the structure
The most salient effect of magnesium incorporation on the vit-reous network is an increase in the B[III] population. In this work, the increase in magnesium was made at the expense of sodium, but this effect has also been reported with a constant sodium content10,14to a lesser extent. As expected, the highest
B[IV] content was reached for the N26M0 glass, with a value of 57%. Based on the composition, calculations from the Yun, Dell and Bray98–100 (YDB) model predicted a much larger
value, 72% B[IV], which considers that the sodium compen-sating for aluminium cannot compensate for boron and based is on the target compositions given in Table 1. Among all the glasses, only N26M0 possessed excess sodium to form NBOs with up to 3.5% Na2O available even if boron was 100%
tetra-coordinated. This behaviour was evident in the 23Na NMR
spectrum as a shift towards higher isotropic chemical shift val-ues37, and the appearance of a contribution at 1320 cm−1 in
the Raman spectra.
When 7.5% sodium was substituted with calcium (N19C8), the B[IV] fraction decreases by 11%, reaching 46%. The YDB model once again gave a much higher value (71%). This signif-icant decrease can be ascribed to the formation of Ca–Na mix-ing sites near NBO-rich regions in the glass, which has been previously observed42,43and was also visible in the17O
spec-trum. Such sites prevent sodium from charge-compensating
tetrahedral boron, in addition to calcium, which does not com-pensate for boron. Another 9% decrease in the B[IV] propor-tion was observed when 7.5% of the calcium was substituted by magnesium in the same proportion (N19M8). This has also been seen in different compositions by Backhouse et al.14 or
Logrado et al.12. Quintas et al.101,102 noticed that the cation
mean field strength (MFS, see Equation 4) affects its ability to charge-compensate for boron atoms. A higher MFS induces a decrease in the charge-compensating abilities56,58,79,103.
𝑀 𝐹 𝑆= 𝑧
𝑟2 (4)
z: cation charge, r: mean distance between the cation and an oxygen.
Calculation thus gives an estimated MFS of 0.45 Å−2 for
magnesium and 0.35 Å−2 for calcium, which could be a first
explanation to the decrease in%B[IV] with increasing magne-sium content. However, int the17O NMR spectra of this glass,
Mg–Na mixing sites near NBOs could not be distinguished as clearly as Ca–Na mixing sites in the calcium-containing glass due to the considerable overlap of contributions aris-ing from Si–O–Al, Si–O–Na, and Si–O–Mg, as seen in the simplest glass (A0B0). Simulations of NMR spectra using density functional theory (DFT) calculations combined with MD simulations will be performed in the future to attempt to more precisely ascribe such sites104. Furthermore, the
sub-stitution of calcium (and sodium) by magnesium generate a B[III] contribution arising from the boron rings. This result was more striking in the MQMAS isotropic projections, as shown in Figure 4 (c)–(d), than in the Raman spectra, even though there appeared to be a slight increase in the peak in the 780 to 800 cm−1 range. The29Si NMR spectra for both
N19C8 and N19M8 shifted to lower values, accompanied by a slight broadening, which could be attributed to the formation of more polymerised silica domains compared to those in the glass without sodium. This result is supported by the Raman spectra, which displayed what is typically ascribed to an aper-ture of the Si–O–Si angle, as well as the isotropic projections of the17O glasses, which displayed variations in the Si–O–Si
isotropic shift.
A further increase in magnesium content to 13.1% at the expense of sodium resulted in lower B[IV] fractions, reach-ing 25%, accompanied by a higher contribution of B[III] rreach-ing units. This is confirmed by the Raman spectra where a new peak emerges at 750 and 800 cm−1 (contribution better seen
in the VV/VH ratio). The slight variation of the B[III] vibra-tional contribution at 1400 cm−1and above could confirm the
ring nature of the newly formed B[III] units. The 29Si
spec-tra displayed an even larger shift towards lower values as well as a significant broadening of the line. This indicates the pro-gressive formation of more polymerised Q𝑛 units but also a
larger distribution of silicon environments, which is supported by the Raman spectrum with a slight shift towards higher wavenumber. Additionally, the17O spectrum showed a slight
broadening in the Si–O–Si contribution. Finally, a slight broad-ening occured in the27Al spectrum, which could indicate a
small proportion of magnesium in the vicinity of aluminium, distorting the tetrahedra.
When sodium is available in a similar proportion to that of aluminium (e.g. N8M19), it appears that magnesium also com-pensates for aluminium (fully tetra-coordinated) to a greater extent than in N13M13. This results in a larger broadening of the27Al NMR spectrum, similar to what has already been
observed for calcium67. Moreover, magnesium could
partic-ipate in the compensation of a small amount of boron (7% B[IV]). REDOR11B–23Na NMR experiments showed a high
decrease in boron–sodium proximity, indicating that part of the boron could be compensated by magnesium. This could also be ascribed to the fact that when aluminium is compensated by magnesium in this glass, a small proportion of sodium is available to compensate for B[IV] units. This is supported by the 23Na spectra obtained on for all the glasses in the series,
for which the chemical shift evolved in the same manner as the change in the proportion of sodium behaving as a modi-fier to a full charge compensator. For this glass, the29Si NMR
spectrum displayed an even larger broadening, which could indicate a separation in several Q𝑛 units. The Raman
spec-tra VV/VH ratio revealed two distinct bands in the Q𝑛region,
which supports this hypothesis. A comparison between the spectra obtained in this region on this glass and those of the ternary A0B0 (similar to the NMS3 and NMS4 studied by Trcera et al.89) suggests that this separation could be attributed
to some extent to the formation of Q4units, with a decrease in
Q3and an increase in Q2units. Q2- and Q4-rich regions could
thus originate from magnesium in the glass in a similar way to calcium105. This effect could also be intensified by a higher
MFS106, which, in some ternary glasses, also tends to
gener-ate more Q4. It is interesting to note that when the magnesium
content in the series increased, there was a significant increase in the ringed boron contribution. This could also imply the for-mation of a boron-rich sub-network, which is further supported by the increase in Si–O–B and B–O–B contributions observed in the17O spectra as well as the increase in intensity observed
in the 750–800 cm−1region in the Raman spectrum.
Finally, when no sodium was available to compensate for boron, as in the N0M12 glass, the B[IV] population dra-matically decreased, reaching a value as low as 2%. This demonstrates that only a small fraction of boron can be com-pensated by magnesium, thus corroborating that magnesium is most probably not involved in charge compensation in the other studied glasses. Additionally, ≈78% of aluminium was compensated by magnesium in tetrahedral units while 96%
compensation was possible based on the magnesium content. The roles of the higher-coordination states Al[V] and Al[VI] remain unclear. In the same way as for boron, magnesium can only partly compensate for aluminium. Based on previous work performed by Allwardt and Stebbins on K–Mg and Ca–Mg silicates107, our data may also suggest a
preferen-tial association of Mg to NBOs rather than BOs, resulting in the observed poor ability to act as a charge compensator. Indeed, considering the small radius and high charge of Mg2+compared to Na+, Mg2+can be expected to be found
mostly near concentrated negative charges, i.e. NBOs, thus less eager to associate with more diluted charge distri-bution, i.e. B[IV] and Al[IV]. Consequently, the29Si NMR
spectra displayed a large broadening, indicative of highly dis-tributed Q𝑛species, from slightly polymerised to highly
poly-merised units. The high boron content in this glass could partly explain this phenomenon: second-neighbour boron tends to shift29Si spectra in the same manner as a decrease in the
poly-merisation degree73. Raman spectra displayed a shift of the
Q𝑛 band towards lower units and a separate contribution at
925 cm−1 too low to be assigned to regular Q
2 units. This
could result in the formation of a Si–O–Si-rich sub-network as well as a Si–O–B-rich sub-network. Finally, it has also been suggested that, in bioactive glasses, an increase in higher Q𝑛
species or a shift towards lower chemical shift values with increasing magnesium content could result from the forma-tion of tetrahedral MgO4 entering the silicate network as an
intermediate oxide21.
4.2
Magnesium environment in the studied
glasses
Some studies suggest that magnesium can be found in both tetrahedral and octahedral forms in glasses, even if the calcula-tion gives a mean coordinacalcula-tion number value of approximately five20,46. The presence of tetrahedral magnesium indicates that
it could behave similar to an intermediate cation: between a network former and modifier12,15,21,24,108. Watts et al.21
sug-gested that this behaviour is more often seen in a highly dis-rupted glass. Additionally, competition with aluminium in the attraction of neighbouring oxygen by magnesium could occur because of the rather short Mg–O bond length. In pyroxene-like glasses, the coordination of magnesium remains uncertain because there were four short 2.08 Å and two long 2.5 Å bonds, thus raising the question of whether the latter two should be considered to be part of the coordination sphere15,109 in this
type of glass.
It is difficult to determine the coordination number of mag-nesium in glassesusing NMR. Most data available on 25Mg
NMR were obtained in crystalline materials, with only few on silicates. The studied systems are typically less complex than
those in the present study48, apart from very recent ones15.
The X-ray absorption near edge structure (XANES) study performed on NMS3 and NMS4 by Trcera et al.89, with
com-positions relatively close to A0B0 in the study, suggests that magnesium coordination is between five and six in this glass and that no change is observed in magnesium coordination with increasing or decreasing degree of polymerisation. The calculated 𝛿𝑖𝑠𝑜extracted from the25Mg NMR spectrum for this
glass gives a value of 35 ppm, which falls within the range of penta-coordinated magnesium when compared to data for both glasses and crystalline materials19,48,50,51. When the
mag-nesium content increase in the glass series, the value of 𝛿𝑖𝑠𝑜
decreased. The progressive decrease in 𝛿𝑖𝑠𝑜implies that
mag-nesium mean coordination progressively shifts from five to six. This is also suggested by the width of the chemical shift in all these glasses, as suggested by Shimoda et al. for several simple glasses46, but does not exclude the presence of
tetrahe-dral units. Conversely, the 𝐶𝑄values increased with increasing
magnesium content in the series. Th highest 𝐶𝑄 and
low-est 𝛿𝑖𝑠𝑜values were obtained for the four-oxide N0M12 with
no sodium. In this glass, magnesium should be found in the octahedral coordination. Future calculation of Mg–O bond dis-tances (Mg–BO and Mg–NBO) and coordination numbers by classical MD as well as values extracted from neutron diffrac-tion spectra of these glasses might allow a more precise and comprehensive analysis of their magnesium environments.
5
CONCLUSION
Four magnesium-containing aluminoborosilicate glasses, a complementary calcium-containing glass, a sodoalumi-noborosilicate glass, and a simple reference silicate glass were studied through extensive structural characterisation by mult-inuclear NMR analysis and Raman spectroscopy. The impact of the progressive incorporation of magnesium (at the expense of sodium) on the structure of these glasses was investigated.
The most prominent effect of magnesium is a dramatic decrease in the mean boron coordination number. This can be ascribed to the poor charge-compensating capability of magnesium of B[IV] units, which is linked to a relatively high MFS, coupled with the consumption of sodium atoms in magnesium–sodium mixing domains. In return, boron tends to reorganise and partly form boroxol rings, reducing Si/B mixing.
Similarly, magnesium appears to be less able to compensate for tetrahedral aluminium when sodium is present. When less sodium is available in the vicinity of aluminium, a progressive distortion of aluminium tetrahedra appears, yielding a higher quadrupolar coupling constant. When no sodium is available,
the formation of pentahedral and octahedral units (≈25%) is observed.
These structural modifications promote an overall reorgan-isation of the silicon network which appears to induce the formation of a highly polymerised sub-network as well as less-polymerised mixed magnesium–sodium regions when the magnesium content increases. Finally, the mean coordination of magnesium in these glasses shift progressively from most likely five to six as the proportion of magnesium increases, but
25Mg MAS NMR at a high field (17.6 T) could not resolve
these coordination numbers.
ACKNOWLEDGEMENTS
This study was supported by the French Alternative Energies and Atomic Energy Commission (CEA) and Electricité de France (EDF). Financial support from the IR-RMN-THC FR 3050 CNRS for conducting the research (25Mg MAS NMR) is
gratefully acknowledged.
BIBLIOGRAPHY
References
[1] D. L. Morse and J. W. Evenson. Welcome to the Glass Age. International Journal of Applied Glass Science, 7(4):409–412, 2016.
[2] Bijaya B. Karki and Lars P. Stixrude. Viscos-ity of MgSiO3; Liquid at Earth’s Mantle Conditions: Implications for an Early Magma Ocean. Science, 328(5979):740, 2010.
[3] Lars Stixrude and Bijaya Karki. Structure and Freezing of MgSiO3; Liquid in Earth’s Lower Mantle. Science, 310(5746):297, 2005.
[4] J. M. Oliveira, R. N. Correia, M. H. Fernandez, and J. Rocha. Influence of the CaO/MgO ratio on the struc-ture of phase-separated glasses: a solid state Si-29 and P-31 MAS NMR study. Journal of Non-Crystalline Solids, 265(3):221–229, 2000.
[5] T. Kokubo, H. Kushitani, C. Ohtsuki, S. Sakka, and T. Yamamuro. Chemical reaction of bioactive glass and glass-ceramics with a simulated body fluid. Journal of Materials Science: Materials in Medicine, 3(2):79–83, 1992.

![FIGURE 4 (Colour online) Experimental 11 B MAS spectra (a) of magnesium-containing glasses in the Nat series with calcu- calcu-lated B[III] percentages (inset displays the Yun, Dell, and Bray model B[IV] calculation as a function of measured B[IV]), and (b](https://thumb-eu.123doks.com/thumbv2/123doknet/12991149.379303/9.892.112.779.94.769/experimental-magnesium-containing-percentages-displays-calculation-function-measured.webp)