Publisher’s version / Version de l'éditeur:
Canadian Geotechnical Journal, 10, 4, pp. 592-606, 1973-11
READ THESE TERMS AND CONDITIONS CAREFULLY BEFORE USING THIS WEBSITE. https://nrc-publications.canada.ca/eng/copyright
Vous avez des questions? Nous pouvons vous aider. Pour communiquer directement avec un auteur, consultez la première page de la revue dans laquelle son article a été publié afin de trouver ses coordonnées. Si vous n’arrivez pas à les repérer, communiquez avec nous à PublicationsArchive-ArchivesPublications@nrc-cnrc.gc.ca.
Questions? Contact the NRC Publications Archive team at
PublicationsArchive-ArchivesPublications@nrc-cnrc.gc.ca. If you wish to email the authors directly, please see the first page of the publication for their contact information.
NRC Publications Archive
Archives des publications du CNRC
This publication could be one of several versions: author’s original, accepted manuscript or the publisher’s version. / La version de cette publication peut être l’une des suivantes : la version prépublication de l’auteur, la version acceptée du manuscrit ou la version de l’éditeur.
Access and use of this website and the material on it are subject to the Terms and Conditions set forth at
Determination of some frozen and thawed properties of permafrost
soils
Watson, G. H.; Slusarchuk, W. A.; Rowley, R. K.
https://publications-cnrc.canada.ca/fra/droits
L’accès à ce site Web et l’utilisation de son contenu sont assujettis aux conditions présentées dans le site LISEZ CES CONDITIONS ATTENTIVEMENT AVANT D’UTILISER CE SITE WEB.
NRC Publications Record / Notice d'Archives des publications de CNRC:
https://nrc-publications.canada.ca/eng/view/object/?id=fa7622dd-c71b-4ab2-8a22-81592e854efc https://publications-cnrc.canada.ca/fra/voir/objet/?id=fa7622dd-c71b-4ab2-8a22-81592e854efcDetermination of Some Frozen and Thawed Properties of Permafrost
Soils
G. H. WATSON=
Mackenzie Valley Pipe Line Research Limited, No. 410 639-5th Aue. S. W., Calgary, Alberta T2P OM9
W. A. SLUSARCHUK~
Divisior~ of Buildit~g Research, National Research Coutlcil o f Canada, Ottawa, Canada K I A OR7
AND
R. K. R O W L E Y ~
Mackenzie Valley Pipe Line Researclr Limited, No. 410 639-5tl1 Aue. S. W., Calgary, Alberta T2P OM9
Received February 8, 1973 Accepted May 23, 1973
Mackenzie Valley Pipe Line Research Limited has undertaken a significant amount of full-scale testing at its test site near Inuvik, N.W.T. Large diameter high ice content permafrost core samples were taken from this site to controlled laboratory conditions, and tested in both frozen and thawed states so that proposed predictive methods for pipeline performance could be evaluated.
This paper describes procedures for sampling, sample transportation at controlled temperatures, and sample preparation in the laboratory. Methods for thaw-settlement and thaw-strength are also described. The results of these tests are presented and analyzed.
La Mackenzie Valley Pipe Line Research Limited a entrepris un important programme d'essais en vrai grandeur a sa station d'essais pres d'lnuvik, T.N.O. Des carottes de grand diametre de permafrost a forte teneur en glace ont e t t prtlevkes sur ce site, et dans des conditions contr81Ces de laboratoire, ont ete soumises h des essais aussi bien 1'Ctat gel6 qu'apres degel dans le but d'tvaluer les mkthodes de prevision du comportement du pipeline.
L'article prtsente les procedures utilisees pour I'Cchantillonnage, la manutention des echantillons h temperature contr81ee et la preparation des echantillons en laboratoire. Les rntthodes d'analyse des relations dtgel-tassement et degel-resistance sont dCcrites et les rtsultats des essais sont presentis et
analysts. [Traduit par le journal]
Introduction
In conjunction with the various research pro- jects undertaken by Mackenzie Valley Pipe Line Research Limited (M.V.P.L.) at their test facility site near Inuvik, N.W.T., a series of large diameter permafrost samples was obtained for laboratory testing. The principal objectives of this program were:
(a) T o develop practical methods for coring, handling, transportation, and storage of frozen cores.
( b ) T o develop laboratory procedures for thaw-settlement and strength tests of permafrost subjected to temperatures above 32 O F (0 OC).
( c ) T o determine thaw-settlement and shear
'Currently with Acres Consulting Services Limited, 990-125-9th Ave. S.E., Calgary, Alberta T 2 G 0P6. 'Currently with R. M. Hardy and Associates Limited, 218-18th St. S.E., Calgary, Alberta T 2 E 6J5. "Currently with Standard Oil Company of Cali- fornia, 225 Bush St., San Francisco, California 94104.
strength values (both frozen and thawed), for the Inuvik ice-rich silt.
(d) T o obtain permeability and thermal con- ductivity values for correlation with existing
in s i t u measurements. -
Results of both the field and laboratory work are presented and discussed in this paper.
Sampling, Transportation, and Storage
Coring the permafrost was done during the summer months of 1971. Ambient air temperatures were as high as 80 "F (26 " C ) . T h e majority of the samples had a very high ice content and were thus susceptible to melting. Portable freezers, maintained at tempera- tures close to the it1 situ ground temperatures, were used to protect the samples.
Large-diameter frozen cores were required for the proposed laboratory testing program as this would minimize the effects of sample surface disturbance during coring and handling. T o obtain these cores, three borings were made using a specially fabricated 5-ft (1.5-m)-long, single-wall core barrel having out- side and inside diameters of 15 in. (38 c m ) and 13 in. (33 c m ) , respectively (Fig. 1 ) . T h e barrel was ad-
WATSON ET AL.: PROPER'T 'IES OF PERMAFROST SOILS 593
FIG. 1. Barrel used for obtaining large diameter cores.
vanced by slowly rotating it under constant pressure using a Nodwell mounted Mayhew rig. After pene- trating the desired amount, the barrel was extracted and the core rapidly freed and placed in the portable freezer. The diameter of the core recovered was approximately 11 to 12 in. (28 to 30.5 c m ) .
The portable freezer loaded with samples, was transported by plane to Norman Wells where a large walk-in freezer was available. The temperature inside the walk-in freezer was maintained at an average of 24 " F (-4.5 " C ) . There the cores were weighed, measured, and photographed. They were then wrapped in plastic sheeting and packed in canvas bags to facilitate handling. Samples were replaced in the portable freezer and transported by aircraft to Ed- monton and then by truck to the permafrost labora- tory, of the Division of Building Research, National Research Council of Canada, in Ottawa. The plane's electric system was used to supply power to the portable freezer using voltage and frequency con- verters to interface between the systems. A portable gasoline generator was used to provide power for the freezer while on the truck.
At the Division of Building Research, the perma- frost cores were stored and prepared for testing in a large, walk-in, cold room having dimensions of approximately 15 X 22 X 9 ft high (4.6 X 6.7 X
2.7 m high).
Initial Sample Inspection and Measurement
After a photographic record of the samples had been made, frozen bulk densities were determined. Volumes were measured by placing the sample in a metal container of known volume, filling the con- tainer with Ottawa sand and measuring the volume of sand in the box. (The difference between the container volume and the volume of sand being the sample volume.)
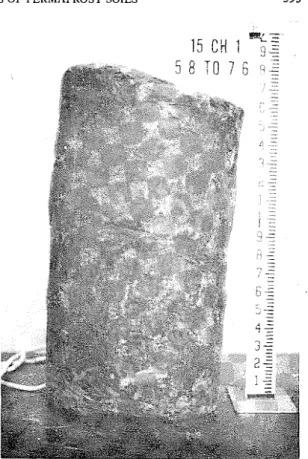
It became apparent, after a preliminary examination of the 12-in. (0.3-m) diameter cores, that a visual examination from the outside would be of little value in determining the form and amount of ice present due to the smearing and thermal disturbance of the surface (Fig. 2 shows a typical core as received in Ottawa). Each of the samples was cut longitudinally
FIG. 2. Large diameter sample (15-CH-1, 5'8"- 7'6") as received at the laboratory.
along the center line with a band saw to: ( a ) obtain a better appreciation of ice content and its distribu- tion, and ( b ) assist in the selection of samples for testing. After the loose shavings had been scraped off the cut face, the relative distribution of the ice and soil was clearly visible (Fig. 3 ) .
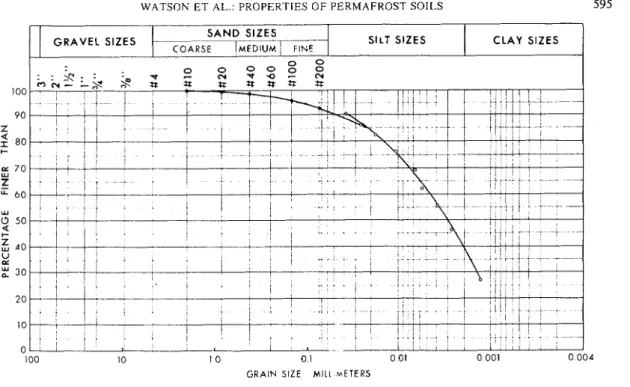
Basic classification tests were then made on repre- sentative samples including frozen bulk unit weight, Atterberg limits, specific gravity, and grain size dis- tribution. The values obtained are given in Table 1. Figure 4 shows a typical grain size distribution curve of the soil.
Sample Preparation and Preservation
T o assess methods of preparing frozen specimens from large samples, a number of techniques such as hand trimming, forcing a cutting edge into the frozen soil, band sawing, and lathing were investi- gated. Hand trimming quickly proved to be inadequate due to slow progress and poor geometric control. Forcing a sharp cutting edge into the permafrost also proved to be unsatisfactory as the ice in front of the cutting edge would chip leaving voids in the sample. The use of a band saw and lathe proved very satisfactory for the silt and clay permafrost.
CAN. GEOTECH. J. VOL. 10, 1973
FIG. 3. Sample 15-CH-1 (5'8"-7'6")-split core.
TABLE 1. Unit weight, Atterberg limits, water contents, and specific gravity values Frozen bulk Water
unit weight Liquid Plastic Specific content N.R.C. Hole No. Depth (p.c.f.) limit limit gravity (%) classification 15-CH-1 4'0C5'8 " 65.3 - - - 244 v r
15-CH-1 5'8"-7'6" 75.0 55.2 30.2 2.66 134
v,
15-CH-1 7 ' 6 ~ 8 ' 3 I' 88.5 63.0 28.8 2.66 76v,
15-CH-2 4'6"-6'0" 81.2 50.4 32.3 2.67 89 Vr15-CH-3 5'6"-6'6" 72 Core not tested due to disturbance 149 v.
NOTE: A gravel pad extended from ground surface to a depth o f approximately 4 ft (1.2 m).
the large permafrost cores or blocks, and gave a fairly smooth surface. A 1/4 in. (0.64 cm) blade with 4 teeth/in. (1.6 teeth/cm) was used initially but this narrow blade tended to wander when cutting specimens that were 4-8 in. thick. A 1/2 in. (1.27 cm) blade with 2 teeth/in. (0.8 teeth/cm) was ulti- mately used. It gave a straighter surface but cut more slowly and dulled rapidly.
Cylindrical samples were turned on a metal working lathe. The sample was initially cut to rough dimen- sions on the band saw prior to mounting in the lathe. Good results were obtained on the lathe when the specimen was turned at 690 r.p.m. and with the carriage feed of the cutting tool set at 1 in. (2.54
cm)/36 revolutions. The sides and ends of the sample were trimmed on the lathe. The maximum depth of cut was limited to 0.015 in. (0.038 cm). For clean cuts the cutting tool had to be sharpened often as the abrasive action of the soil quickly dulled the edge. A sharp tool decreased the chipping of the ice in the sample. Long work samples had to be supported with the tailstock. The lathe produced a well finished sample which was ready for testing.
For rectangular specimens, a crosscut saw was used with a specially built miter box to give a relatively smooth and even surface. The crosscut saw produced a more regular surface than the band saw. If either the crosscut saw or band saw was used, however, the
WATSON E T AL.: PROPERTIES O F PERMAFROST SOILS 595
S A N D S I Z E S -
SILT S I Z E S C L A Y S I Z E S
100 10 10 0 1 0 01 0 001 0 004
GRAIN SIZE MILL;HETERS FIG. 4. Typical grain size curve.
surf;~cc was finished by hand shaving using a large, sharp, straight culting etlge with a guide.
T h e rcl:~tivc hurniclity in the cold room was low so the ice c l ~ ~ i c k l y sublimated at the edges of the s:~rnple when left exposetl. Generally, the s n n ~ p l e s \vel-e prep:rretl in~n~ctli:rtely prior to testing, thus
voiding s;rniple PI-cservation problems. If it was not possible to test the samples inimetlintely after prepam- tion, they were placetl in n plastic bag and a vacuum pump was used to tleair the bag. This caused the pli~slic to clinz to the perniz~frost, minimizing the air gaps between the sample and the plastic. Where air gaps reniainetl, ice crystals formed within a few hours on the insitle surface of the plastic.
D i ~ r i n g handling and preparation of the frozen core samples, i t was necessary to wear gloves to prevent loc;rlizetl melting. Also all equipment and tools used in s:rniple preparation were cooled to the temperature of the coltl room prior to use.
Laboratory Testing and Results
It was desired to conduct a series of tests to determine total one-dimensional settlement of icc-rich permafrost when thawed under load. Although some work has been done in this field in North America (Crory 19644; Luscher and Afifi 1970; Morgenstern and Nixon 1971; Shuster 1971 ; Smith 1972), and in the U.S.S.R.
(Aberkov 1970; Shusherina 1954; Tsytovich
'Also personal c o r n n i ~ ~ n i c a t i o n , 1971.
and Sumgin 1937), a standard procedure for haw-~cttlcmcnt tcsts had not becn established. Thc sclcction of size of sample (length, diame- tcr, length-diameter ratio), method of thawing (i~nidircctional, all around, rate), and method of load application (before or after thawing, number of load increments) are still somewhat arbitrary. All of the effects of these arbitrary sclcctions on the rcsults are not known.
For the thaw-scttlemcnt tests reported in this papcr thc sample holder was made from a n acrylic cylinder, 3.5 in. (8.9 cm) I.D. with a 1/4 in. (0.64 c m ) wall 4 in. (10.16 cm) high (Fig. 5 ) . The bottom of the cell consisted of a porous stone sitting on an acrylic plate which was glucd to the plastic cylinder. The plastic bottom plate bad cross grooves in its top surfacc and these grooves were connected to a hole drilled in the platc through which the sample could drain. A valve was tapped into this hole. An overflow tube was connected to a hole drilled in the side of the cell approximately 31'4 in. ( 1.94 cm) from the top.
The samples were loaded by means of a ccnter lever system. The load was placed at the end of a metal strap which was secured to the top of a small arc at the end of a lever a m . This permitted the arm to travel several inches
596 CAN. GEOTECH. 3. VOL. 10, 1973
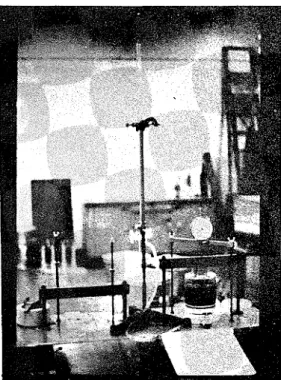
FIG. 5 . Thaw-settlement and permeability cell.
without changing the load applied to the sample. The load was transferred to the perma- frost sample from the loading bar through a loading cap and a porous stone.
Initial tests were conducted with unrestrained movement of the loading cap and porous stone ( a steel ball coupled the loading bar to the loading cap). The loading cap tilted by as much as 15-20' during a test which resulted in the loading cap and porous stone binding against the sides of the cell. T o overcome this p;oblem, a loading cap was machined to fit over the existing cap to limit tilting to a maxi- mum of 4'. In addition, the sides of the porous stone were tapered so that some tilting could occur without binding. 0
The porous stones were vacuum saturated in placc before a test commenced. The valve at the base was shut and surface water was re- moved from the top of the porous stone in the base. A prepared sample was placed in the cell, the saturated porous stone and loading cap were placed on top of the sample, and the assembly was positioned on the loading frame and loaded. The dial gauge was quickly zeroed and the sample was thawed at room tempera- ture (70 OF, 21 OC). Melting of the perma-
frost sample occurred from all directions as no attempt was made to have unidirectional thaw- ing. Because the valve at the base of the con- tainer was closed, only upward drainage took place.
The load on the samples during thawing varied from 22 to 800 p.s.f. (107 to 3905 kg/ m'). The low thawing pressures were used to simulate a no-load condition and the higher thawing pressures represented different over- burden loads. After thawing was completed under the initial load additional loads were placed on the samples. For the samples thawed at low pressures, five incremental loads were applied while only two incremental loads were applied to the samples thawed at pressures of 400 p.s.f. (1955 kg/m" or greater. The results of these tests are shown in Figs. 6 and 7.
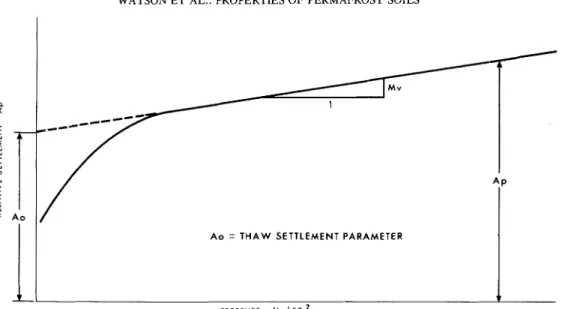
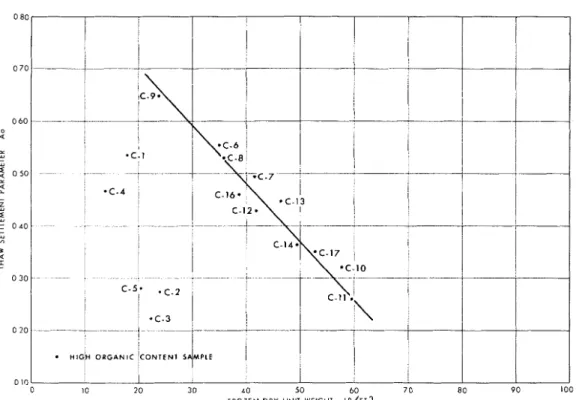
Figures 6 and 7 show that for these soils, the curves of relative settlement ( A p ) , (i.e. ratio of change in height of sample to height of original frozen sample) versus applied load are relatively straight for the range of pres- sures greater than 400 p.s.f. (1953 kg/m2). Below this value the slope of the curve is con- stantly changing. When the straight line portion of the curve is extended back to meet the ordinate, a value for relative settlement is ob- tained and this value has been termed the "thaw-settlement parameter", (Fig. 8 ) i.e. the relative settlement of a permafrost sample upon thawing at the so called no-load condition. Values for the thaw-settlement parameter ( A , )
and the slope of the straight line portion of the curve (nz,.) are given in Table 2.
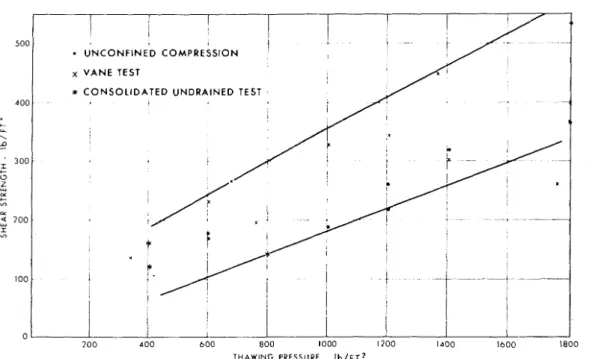
Thawed Strength
Several of the tests were conducted to obtain shear strength values of thawed samples. La- boratory vane tests were performed on material that had been consolidated to various pressures in the consolidated cell. Different areas of the sample were tested after the sample had con- solidated under each load. Sample heights during these tests were between 1 and 1.5 in.
(2.5 and 3.8 cm).
Unconfined compression tests were run on samples which had been thawed in a three- piece split mold under consolidation pressures of 400 and 900 p.s.f. (0.2 and 0.45 kg/cm2). The mold was made in such a way as to allow both base and top movement during thawing
WATSON E T AL.: PROPERTIES O F PERMAFROST SOILS 597
PRESSURE ON S A M P L E L B / F T 2
FIG. 6. Relative settlement versus pressure on sample (Tests C-6-C-13).
0 200 400 600 BOO 1000 I200 1400 I600 1800 2000
PRESSURE O N S A M P L E L B / F T ~
FIG. 7. Relative settlement versus pressure on sample (Tests C-1-C-5, C-14, C-16, and
WATSON ET AL.: PROPERTIES O F PERMAFROST SOILS
PRESSURE
-
l b / F TFIG. 8. Generalized thaw-settlement curve.
FIG. 9. Split mold used in forming samples.
(Fig. 9 ) . An attempt to reduce side friction was made by lubricating the inside of the mold with silicone grease. The sample was thawed under water, allowing both top and bottom drainage. Prior to testing, the sample height was measured to 1/100 in. Samples
consolidated at pressures less than 400 p.s.f. (0.2 kg/cm2) exhibited a very low strength. A summary of the results is shown in Fig. 10.
Two series of consolidated undrained triaxial tests were conducted on samples which had been thawed under loads of 400 and 800 p.s.f. (0.2 and 0.4 kg/cm" with the following results :
Consolidating pressure C' 4'
(kg/cm2) (kg/cm2) (degrees)
Frozen Strength
A series of unconfined compression tests was run of frozen core specimens 1.5 in. (3.8 cm) in diameter and approximately 3 in. (7.6 cm) in height. Failure occurred at relatively low axial strain (approximately 2% )
.
Tests were run with a strain rate of 0.5-1 % per minute. The strength built up rapidly to a maximum, leading to a 'plastic' type failure with substan- tial residual strength.Unconfined compression strengths varied from 317 to 418 p.s.i. (22.19 to 29.26 kg/ cm2), the low value, being obtained on a sample with a high organic content and a dry density of 9.9. p.c.f. (0.16 g/cm3). Excluding this result, the average strength was 393 p.s.i.
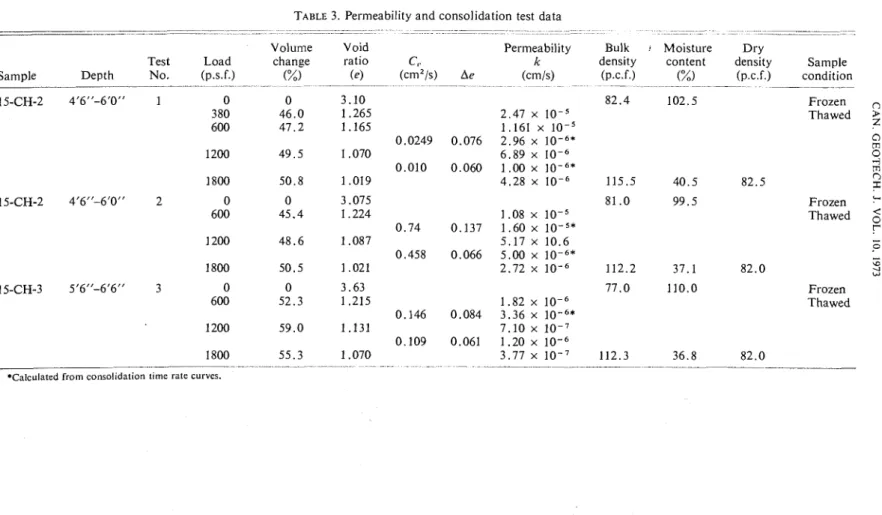
TABLE 3. Permeability and consolidation test data
--
Sample Depth No. (p.c.f.) condition
- - - - - 15-CH-2 4'6"-6'0" 1 0 0 3.10 82.4 102.5 Frozen 380 46.0 1.265 2.47 x Thawed 600 47.2 1.165 1.161 x lo-'
*
0.0249 0.076 2.96 x 0 m 1200 49.5 1.070 6.89 x o 0.010 0.060 1 .OO x -i m 1800 50.8 1.019 4.28 x 115.5 40.5 82.5 0=
15-CH-2 4'6"-6'0" 2 0 0 3.075 81 .O 99.5 Frozen 600 45.4 1 ,224 1 .08 x I O - ~ Thawed2
0.74 0.137 1.60 x !- 1 200 48.6 1.087 5.17 x 10.6-
o 0.458 0.066 5.00 x-
1800 50.5 1.021 2.72 x 112.2 37.1 82.0 \O 4 W 15-CH-3 5'6"-6'6" 3 0 0 3.63 77.0 110.0 Frozen 600 52.3 1.215 1.82 x Thawed 0.146 0.084 3.36 x 1200 59.0 1.131 7.10 x 0.109 0.061 1.20 x 55.3 1.070 1800 3.77 x l o - 7 112.3 36.8 82.0 . . .. .... - - .- .-. . . - . . - . ..WA'IXON E T AL.: PROPERTIES O F PERMAFROST SOILS 60 1
FIG. 10. Laboratory strength test results
500 400
-
L \ -D 300-
0 z u m-
Y) '200 I Y) 100 0 Pert?ieabilityPermeability tcsts wcre conducted on thawed samplcs during thc consolidation phase of the thaw-settlement apparatus. Permeability co- efficicnts wcre also calculated from the slope of the consolidation curves.
Figure 4 shows a typical grain size curve for thc claycy silt. Falling head results gave values bctwccn 2 x lo--' and 2 x lo-: cm/s rather than the 10-"-1
-'
that would be anticipated from thc grain sizc curve.Table 3 shows thc results of some of the pcrmeability tcsts performed in the thaw- scttlemcnt apparatus under various loads. A relationship betwecn pcrmeability and dry dcnsity is shown in Figure 1 1.
I I
.
UNCONFINED C O M P R E ~ S I O x V A N E TEST * C O N S O L I D A T E D U N D R A I N E D TEST t 200 400 boo 800 1000 1200 la00 1600 1800Thernlal Cot~cluctivity of Frozetz Soil
Thermal conductivity tests were run on some large diameter cores and on some block samples taken from the same area. The samples were taken near the surface and contained considerable organic material. In total, two thermal conductivity probe tests, eight heat flow meter tests, and one guarded hot plate test were run. Probe tests (Slusarchuk 1972) were run on the samples before they were cut into rectangular slabs for heat flow meter and guarded hot plate tests. Heat flow meter tests
T H A W I N G P R E S S U R E I ~ / F T ~
were pcrformed according to A.S.T.M. test method C518-67 and the guarded hot plate test followcd A.S.T.M. test method C177-63. Heat flow meter and guarded hot plate samples had dimensions of 11 x 1 1 x 1
+
in. (28 x 28 x 3.8 cm).The thermal conductivity values for the eight heat flow meter tests varied from 10.0 to 10.4 B.t.u.-in./ft"h-OF (1.44 to 1 .SO W/m-OC). All samples had a frozen bulk unit weight of approximately 67 Ib/ft:{, (1073 kg/m"), a dry unit wcight of 31 Ib/ftC3 (497 kg/m" and a water content of about 200%. The samples testcd in the guarded hot plate gave a conduc- tivity of 9.4 B.t.u.-in./ft"h-OF (1.35 W/m- OC). The two probe tests gave values of and lo-" B.t.u.-in./ft2-h-OF (1.50 and 1.55 W/m-OC). Interprctation of the differences between these results is difficult at this time due to the limited amount of knowledge in determining thermal conductivity of ice-rich soil.
Thaw-settlement Analysis
In thaw-settlement analysis, when the A , and
nz, values for a permafrost soil have been deter- mined and if the depth of thaw and loading conditions are known, total settlement can be calculated by the following equation (assuming
602 CAN. GEOTECH. J. VOL. 10, 1973
FIG. 11. Relationship between permeability and dry density.
100 90 L' 2 a0 > t "7 5 n >- , 7 0 n 60 50
that the water table in the thawed material is at the surface).
where:
S = total settlement (ft),
A , = thaw-settlement parameter,
X = depth t o thaw front from original surface (ft),
m, = coefficient of volume compressibility (ftZ/lb),
P = surcharge load (1b/ft2), and
-y = submerged unit weight of thawed soil (lb/ft 3).
-
For the cases where several layers of soil are present, the settlement of each layer can be calculated separately and summed to obtain the total settlement. For these situations, in Eq. [2], X becomes the depth of thaw in any layer and P is the effective overburden pressure at the top of that layer.
As shown by Eq. [2], total settlement is affected by three terms; a thaw-settlement term and two volume compressibility terms (one
FALLING HEAD PERMEABILITY
X CALCULATED PERMEABILITY --
due to a surcharge load and the other to self weight). For the ice-rich permafrost samples tested, the thaw-settlement term was dominant. For example, soils similar to those in tests C-6, C-12, and C-11 (relatively high, medium, and low settlement characteristics) were assumed to thaw to a depth of 2 0 ft (6.1 m ) with an 800 p.s.f. (3905 kg/m2) surcharge at the surface and the settlements were calculated. C-6, C-12, and C-11 type permafrost soils would settle 11.6, 9.4, and 6.4 ft, respectively, with 94, 91, and 81 % of the settlement being derived from the thaw-settlement term.
The thaw-settlement parameter is plotted as a function of frozen dry unit weight in Fig. 1 2 and as a function of frozen bulk unit weight in Fig. 13. Excluding the results from tests C-1 through C-5 which contained considerable organic ma- terial, Figs. 1 2 and 1 3 show that a relationship appears to exist between the thaw-settlement parameter and both frozen bulk unit weight and frozen dry unit weight. T o expand the range of this relationship, additional thaw- settlement data were obtained from tests by Speer et al. 1973 on soils with higher frozen bulk densities. Most of these data points fall within the band drawn in Fig. 1 4 with the value of the thaw-settlement parameter tending
>\
X- _ _ _ _ I
WATSON ET AL.: PROPERTIES O F PERMAFROST SOILS 603
FIG. 13. Relationship between thaw-settlement parameter and frozen bulk unit weight (Results from Inuvik thaw-settlement tests).
CAN. GEOTECH. J . VOL. 10, 1973
FIG. 14. Relationship between thaw-settlement parameter and frozen bulk unit weight (Results from all available data).
toward zero at 120-130 p.c.f. (1922-2082 kg/m".
Relative settlements ( A , ) were calculated by two methods and the values obtained were compared with those measured in the thaw- settlement tests. T h e results are given in Table 4.
I n Method 1 (Crory 1 9 6 4 ) , relative settle- ment was calculated by the following equation
where:
A,, = relative settlement a t some pressure,
y d f = dry unit weight of frozen material, and
y d , = dry unit weight of unfrozen material. As shown in Table 4, the measured values of settlement and those calculated by this method
are in good agreement. These values in fact should be exactly equal to each other as it can be shown that the term 1 - (ydf/ydu) is iden- tically equal to the relative settlement. T h e dif- ference between the values therefore is an indication of the error associated with the weights and measures in the thaw-settlement test.
A second method was developed for calcu- lating relative settlement from thaw-settlement tests. In this method, the difference in volume between the frozen and thawed state was equated to the change in volume associated with melting the ice plus the volume of water expelled from the sample. This relationship can b e expressed as
r41 A p 2 = w r d f -2l.- + Wf -
w,,
WATSON ET AL.: PROPERTIES OF PERMAFROST SOILS 605
TABLE 4. Comparison of measured and calculated settlements after thawing for final load condition Relative
settlement Relative Relative
Thaw Relative calculated settlement Relative Settlement Expulsion settlement settlement Method 1 calculated settlement expelled ratio Final
value measured (Crory 1964) Method 2 ice change water Test No. ( A , ) (A ,) (Apt) to water
where: Luscher and Afifi ( 1 9 7 0 ) . Values for this
A,, = relative settlement at some pressure, parameter are shown in Table 4.
w , = percentage frozen water content,
= unit weight of water,
WJ = weight of frozen sample,
Wu = weight of unfrozen drained sample, and V = volume of frozen sample.
If the sample is saturated or the volume of air voids does not change during thawing then the relative settlement calculated by this method should equal that determined by measurement or as calculated by method 1,
i.e. A, = A,, =Apa. The results of calculations using Eq. [4] are given in Table 4. The relative settlement due to both volume change of melt- ing the ice and expelling thc water is also given in Table 4.
In order to get an indication of the amount of water expelled from the soil as it thaws, in relation to the amount of settlement, an expres- sion has been derived for a parameter E, the expulsion ratio. This term is defined by taking the final term in
Eq.
[4] and dividing it by the thaw settlement parameter, A,.This is similar to the concept proposed by
Conclusions
1. Based on the results of the thaw-settle- ment tests undertaken during this program, a correlation between frozen bulk density and thaw-settlement parameter for mineral soils was shown to exist.
2. Figure 10 summarizes the results of the shear strength tests conducted on the thawed samples assuming that drainage occurred under overburden pressures.
+'
and C' values of 28" and 0.06 kg/cm" respectively, were deter- mined for these soils.3. Permeability tests showed that samples
thawed under low overburden pressures had a relatively high coefficient of permeability ( k =
1 x 10-'-1 x lo-" cm/s for loads up to 500 p.s.f.). Small increases in overburden pressure resulted in a rapid decrease in permeability
( k = 1 x 10-I cm/s for loads of approxi-
mately 2000 p.s.f. )
.
4. Thermal conductivity tests conducted on frozen samples from within the ice-rich organic clayey silt layer, using the cylindrical probe, guarded hot plate, and flow meter techniques, gave values for the coefficient of thermal con-
606 CAN. GEOTECH. J . VOL. 10. 1973
ductivity ranging from 9.4 to 10.7 B.t.u.-in./ investigation of soil consolidation and strength
ft2-h-OF (1.35 to 1.55 W/m-OC). behaviour. Trans-Alaska pipeline system. Re- sponse to U.S. Geol. Surv. questions.
Acknowledgments MORGENSTERN, dimensional consolidation of thawing soils. Can. N. R., and N I ~ O N , J. F. 1971. One-
The authors wish to acknowledge the interest Geotech. J. 8 ( 4 ) , pp. 558-565.
and assistance of their colleagues in this study. S H u S H E R I N A j YE. P. 1954. the settling of
In particular J. Angemeer and R. H. Winn frozen ground on thawing. Cold Reg. Res. Eng. Lab., Hanover, N.H. Draft Transl. 336. (field work) and R. Cooper and R. A. Parent SHUSTER, J. A. 1971. Laboratory testing and charac-
(laboratory work). terization of permafrost for foundation uses.
This paper is a joint contribution of Proc. Symp. Cold Reg. Eng., Univ. Alaska, Fair- banks, Alaska. I, pp. 73-1 18.
Mackenzie Valley Pipe Line Research Limited
S L ~ ~ A R ~ H ~ K , W, A. 1972, Thermal conductivity
and the Division of Building Research, Na- probes. Proc. Semin. Therm. Regime Meas. tional Research Council of Canada and is Permafrost. Perniafrost Subconini.. N.R.C.C.
published with the approval of the Research Coordinator of Mackeilzie Valley Pipeline Re- search Limited and the Director of the Division of Building Research.
ABERKOV, T . U. 1970. Device for studying stresses and deformation of thawing ground. Cold Reg. Res. Eng. Lab., Hanover, N.H. Draft Transl. 271. CRORY, F. E. 1964. Estimating subsidence caused by the thawing of permafrost. Cold Reg. Res. Eng. Lab., Hanover, N.H. Unpubl. Tech. Note. LUSCHER, U., and AFIFI, S. A. 1970. Laboratory
Assoc. Comni. Geotech. Res. ( I t 1 prc,.rs). SMITH, L. B. 1972. Thaw consolidation tests on re-
moulded clays. Unpt~bl. M.Sc. thesis, Dep. Civ. Eng., Univ. Alberta, Calgary, Alberta.
SPEER, T . L., WATSON, G . H.. and ROWLEY, R. K.
1973. Effects of ground-ice variability and re- sulting thaw settlement on buried warm oil pipelines. Proc. 2nd Int. Perniafrost Conf., Yakutsk, U.S.S.R.
TSYTOVICH, N. A,, and SUMCIN, M. I. 1937. Principles of mechanics of frozen ground. Cold Reg. Res. Eng. Lab., Hanover, N.H. Transl. 19, pp. 151- 161.