HAL Id: hal-00378462
https://hal.archives-ouvertes.fr/hal-00378462
Submitted on 24 Apr 2009
HAL is a multi-disciplinary open access
archive for the deposit and dissemination of
sci-entific research documents, whether they are
pub-lished or not. The documents may come from
teaching and research institutions in France or
abroad, or from public or private research centers.
L’archive ouverte pluridisciplinaire HAL, est
destinée au dépôt et à la diffusion de documents
scientifiques de niveau recherche, publiés ou non,
émanant des établissements d’enseignement et de
recherche français ou étrangers, des laboratoires
publics ou privés.
FOR RAINFALL ESTIMATION
Jean Claude Bergès, Franck Chopin, Frédéric Bessat
To cite this version:
Jean Claude Bergès, Franck Chopin, Frédéric Bessat. SATELLITE BASED DOWNSCALING
AL-GORITHM FOR RAINFALL ESTIMATION. IV Colóquio Brasileiro de Ciências Geodésicas - IV
CBCG, May 2005, Curitiba, Brazil. �hal-00378462�
SATELLITE BASED DOWNSCALING ALGORITHM FOR RAINFALL
ESTIMATION
Bergès, J.C.1, Chopin, F.2 and Bessat, F.1
1- PRODIG, Université Paris 1, Paris 75005 France,[email protected], [email protected] 2- LMD, IPSL/CNRS , Ecole Polytechnique, Palaiseau 91128 France, [email protected]
RESUME – Bien que les champs de pluie estimés soient un paramètre environnemental clé, ils ne sont pas toujours disponibles à une échelle appropriée et avec la précision requise. Les méthodes d'estimation des pluies basées sur les satellites sont une source utile d'information et leur amélioration est un problème important. Dans ce texte nous décrivons une mèthode d'estimation des pluies basée sur MSG, le nouveau satellite météorologique Européen. Les tests ont été réalisés sur une zone d'Afrique de l'Ouest au cours de la saison des pluies 2004. Notre algorithme est composé de deux parties: une évaluation des probabilités de pluie et l'estimation des quantités précipitées. L'estimation de la probabilité de pluie est réalisée en comparant les indicateurs dérivés de MSG avec la détection de pluie TRMM/PR. Après la sélection des noeuds d'entrée, un perceptron multicouche est entrainé et, les coefficients du réseau évaluès, les durées de pluie peuvent être calculées. La seconde partie de l'algorithme réalise une fusion des probabilités de pluie et des mesures réelles de précipitation. Cette partie dépend étroitement des données disponibles. Si les précipitations sont fournies sur une grille, une intensité potentielle est tout d'abord calculé puis les précipitations sont ramenées à l'échelle du satellite. Sur l'an 2000, les champs résultants ont été testés face au GPCP sur un réseau de pluviomètres dense et ont montré un meilleur comportement.
ABSTRACT - Although rainfall estimates are a key environmental parameter, they are not always available at an appropriate scale and with a sufficient accuracy. Satellite based rainfall estimation methods supply valuable information and their enhancement is a key issue. In this paper we describe a rainfall estimation method based on MSG, the new European meteorological geostationary satellite. Computations have been carried out on West-Africa during 2004 rainy seasons. Our algorithm is composed of two parts: assessment of rainfall probability and actual rainfall estimation. Rainfall probability is computed by comparing MSG derived indicators with TRMM/PR rain detection. After the selection of input nodes, a feed forward neural network is trained. The network coefficients being assessed, rainfall durations can be computed. The second part of the algorithm merge rain probability data with actual rainfall measurement. This part is highly dependent of available rainfall data. If precipitations are supplied as gridded data, a potential intensity is first computed and then precipitations are downscaled at intitial satellite resolution. On 2000 data, resulting rainfall estimates have been tested against GPCP on a dense raingauges network and have demonstrated better performances.
PALAVRAS-CHAVE: Neural-network, Rainfall-estimation, Geostationary-satellite, TRMM 1 INTRODUCTION AND BACKGROUND
1.1 Indirect estimation methods
Accurate rainfall estimates at various scales are needed both by modelisation process and environmental monitoring. Unfortunately the ground collect network (rain gauges and radar) is not everywhere sufficient for a proper retrieval. In semi-arid area as West-African Sahel, this is an important issue as the operationnal network is
scarcely distributed and most of human activities are dependent of the rainy season quality. In this context, the satellite based rainfall estimation methods could bring valuable informations.
A well known global rainfall climatologic product is the GPI developed by Arkin (1987). GPI is based on a simple estimation method from GOES satellite data and provides estimates on a coarse grid (monthly 2.5°x2.5°). Several methods have been directly derived from GPI to
produce estimates at different scales. These methods improved climatological parameters or integrated other parameters: coincident rain gauges measurements or aerological data. But, at this time, no one appeared significantly better than the others.
Recently, the climate observation system has experimented noticeable changes: new active or passive microwave sensors, launching of a new generation geostationary satellite. These changes associated with extended facilities in storage and data processing could permit to significantly enhance rainfall estimation methods.
This paper describes a rainfall estimation method based on MSG, the new European geostationary satellite. It focuses on design issues and discusses implementation on other satellite. This work is integrated into AMMA (African Monsoon Multidisciplinary Analysis) satellite component.
1.2 Dataset description
Our study has been carried out on West-Africa on 2004 rainy season. On this period our dataset include a full coverage of geostationary data from MSG. Informations used for model training are based on TRMM precipitation radar and are extracted from 3G68-Land database (Iguchi, 2000). Rainfall amount is supplied by GPCP daily estimate. Validation data will be provided by a dense raingauges network managed by IRD (Ali, 2003).
2 RAINFALL PROBABILITY ESTIMATION 2.1 Rainfall probability and intensity
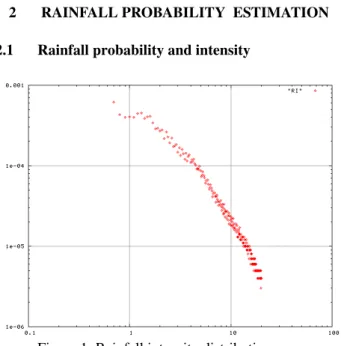
Figure 1: Rainfall intensity distribution
The relation between rainfall intensity and cloud top temperature is recognized as highly variable both in time and space (Todd, 2001). This variability explains difficulties encountered when directly downscaling GPI-like estimators, as the grid size is the key smoothing element to reduces the relation unstability.
A factor related to this variability is the
distribution of rainfall intensity. The figure 1 histogram has been computed from one month of 3G68 database on our study area. Both axis are in logarithmic scale. It can be quoted that this curve look close from a Zipf law. This feature suggest that, for sample size considerations, etablishing the statistical relation estimation of higher intensity will be difficult. Another factor is that, whereas geostationary satellite can provide valuable information for nephanalysis, there is no physical relation with intensity of convection. As far as the satellite is able to properly identify active cells in convective clouds, it can be used for quantitative rainfall estimation because of the obvious statistical relation between rainfall duration and rainfall amount. However the weak character of this relation make it very unstable.
In a first step we will focus on estimating rainfall area. Our learning dataset will be constituted by
combining 3G68 grid values with coincident MSG (or Météosat) channels. TRMM rainfall intensity will not be be considered but only detection or not detection of rainfall. The resulting file will contain around 800000 records for one month of data. Instead of operating a two classes partition, we wil produce a fuzzy classification and interpret the result as a rainfall probability estimation. 2.2 Infrared multichannel capacities
The MSG radiometer has been designed to enhance cloud classification and these new facilities should improve rainfall estimations. In tropical area, the estimations efficiency is highly dependent of their capacities to discriminate between convective clouds and other formations. Due to their low temperature, cirrus screening is a sensitive part of these methods and a method based on only one infrared channel could not operate a proper discrimination.
In order to assess relative efficiency of MSG thermal channel for cirrus screening we have simulated their spectral response on an ice cloud of various thickness. The radiative transfert model has been initialized with a standard tropical atmosphere, a 15 km top cloud altitude and a water content of 0.05 g/m3.
Computations have been carried out by Streamer (Key, 1998).
Figure 2: Streamer simulation
For each MSG channel, the difference of radiatiave temperature with 10.8 µm channel has been plotted (figure 2). The 3.9 µm channel has been ommitted as to noisy at low temperatures.
The two split-window channel (8.7 µm and 12.0 µm) perform well, their difference with 10.8 µm quickly increasing with cloud thickness, reaching a maximum around 100 m and then decreasing until 0. The other channels behavior looks as more complex but except CO2 channel (13.4 µm) they converge to 0 for a thick cloud.
Actual channel satistics are represented in figure 3. The whole learning dataset has been partitioned according to 10.8 µm channel with a 1K step. On each slot the means has been computed separately for rainy and non rainy pixels and their difference has been plotted.
Figure 3: Channels discrimination efficiency Every channel has a rather regular curve and no one presents a significant sign inversion. This should
indicate that they yet could be efficient in a two channel screening method. Furthermore this figure looks similar to the theoretical one (figure 2) both by the shape of the curves and their relative positions. A feature suggesting that thin cirrus detection explains partly the efficiency of multichannel classification.
2.3 Variation indicators
CST method (Adler, 1988) was designed to discriminate between stratiform and convective rainfall. This classification is based on a infrared spatial variation indicator. Underlying hypothesis is that top of clouds limited by an inversion layer would look as flat whereas deep convection should be associated with a non-uniform top cloud temperature. A local variance or a slope are currently used as an input for rainfall estimation model, but the actual efficiency of this parameter class is at most moderate (Ba, 2000).
Figure 4: Higher values of local variance
Limitation of local variation indicator appears in figure 4. We have computed 3x3 variance on a MSG thermal infrared image (8.7 µm) of Senegal during the rainy season. The 5% of higher variance pixels have marked in red in this image. It can be quoted that high variance value are mainly associated with cloud boudaries. In some extent, this feature is related to rainfall as the more active cells are generated in front of convective systems, but the relation is still very indirect.
In order to partially overcome this effect, we compute local variance not only on thermal infrared but also on water vapor channel. As ground and atmosphere lower layer are fully absorbed in this wavelenght, the boundary effect is decreased. We have also selected as input parameter the maximum temperature value on the computation window.
The maximum rainfall intensity occurs during cells growing phase. We use difference of pixel
temperature in 10.8 µm with the previous slot as an input parameter. Obviously more sophisticated indicators could be designed but concerns of computation time make us select the simplest.
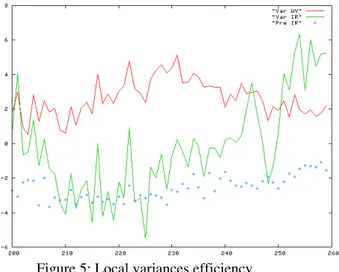
Figure 5: Local variances efficiency
The efficiency of these three parameters is summarized in figure 5. For each 1K slot, the mean value of the parameter has been computed both for rainy and non rainy pixels and their difference plotted. Curves are less regular than in figure 3. Nevertheless the water vapor variance and the temperature of previous slot show a constant behavior in accordance with our intuitive cloud model. As suggested by figure 4, the thermal infrared variance does not perform so well in relation with 10.8 µm channel.
2.4 Statistical method
From the previous step we selected 13 input parameters for MSG estimates:
- 7 infrared channel from 6.3 µm to 13.4 µm - 6.3 µm variance on a 3x3 window
- maximun 6.3 µm on a 3x3 window - 10.8 µm variance on a 3x3 window - maximum 10.8 µm on a 3x3 window - point altitude
After the selection of this set of input parameters a statistical method has to be selected in order to actually estimate rainfall probabilities. The histogram matching technique is efficient as far as the number of input nodes is low. This technique could be extended to two input parameters, but it is not applicable in a full multispectral model as the required learning set size should be too large.
Tree classifiers and neural networks have been compared on a rainfall probability estimation (Bergès, 2003). It appears that neural networks are much more stable than tree classifiers. Integrating bagging (Breiman, 1994) enhances tree classifiers stabilty at the expense of an higher computing time. After this this modification, the results obtained by the two methods are roughly similar but the bias analysis shows still a better performance of neural networks.
Neural networks are now widely used as non linear regression method (Funahashi, 1989). To actually implement a neural estimator the first step is to design a network architecture. Then the model coefficients are assessed by comparing estimated with reference values and by backpropagating estimation error to correct the coefficients. This operation is done for each element of the learning dataset and the estimation of these coefficients requires multiple iterations of this procees. The computation is stopped on matching a mean error criterium. A direct retrieval of rainfall intensity from geostationary satellite data is in many way difficult. Hsu (1996) uses a complex model integrating a Kohonen map with a multilayer feed forward network. The probability rainfall estimation is much more simpler as it can be efficiently performed by a feed forward network with one hidden layer. In this class of networks the only parameter is the number of hidden layer nodes. Usually it is a tradeoff between estimator accuracy and stability. With only one hidden node, the neural network is equivalent to a linear regression which is stable but presenting high estimation bias. Too much hidden node would overtrain the network, a situation where resulting estimator would be highly dependent on small perturbation of learning dataset. As our learning base is much more greater than the input node number, overtraining is not a real issue and we have set the number of hidden nodes to twice the input node number.
The only significant modification to standard algorithm is the prior introduction of data scrambling. As images are spatially coherent, following records are usually highly correlated. This feature slowdowns the convergence of the error backpropagation algorithm. So the learning base records are reordered by a random algorithm to eliminate this effect.
After completion of the training phase, an estimation can be computed for each available slot. These instantaneous probability images match properly with TRMM/PR data. In figure 6 an estimated probability field is superposed with coincident TRMM/PR track. Rainy pixels are plotted in red and non rainy in green. On this figure, the active cells appear as clearly delineated.
3 RAINFALL INTENSITY ESTIMATION 3.1 Downscaling formula
The estimated rainfall intensity will be computed by the product of the rainfall probability and the potential intensity. The determination of this potential intensity will be highly dependent of the nature of rainfall data. If actual data are not available potential intensity will be a constant or a continuous field extracted from climatology. Should we get actual rainfall data in gridded form, the downscaling formula (1) should be applicable: ∫∫ ΑΤIr(a,t) da dt = Ip(cA,cT) ∫∫AT Pr(a,t) da dt (1)
where: A (resp. T) is the spatial (resp. temporal) integration area
cA (resp. cT) is the center of A (resp. T) Ir is the actual rainfall intensity
Ip is the potential intensity Pr is the probability of rainfall
When computing Ip from formula 1 it is important to define the size of the sliding windows A and T as greater than a grid cell. A is usually selected defined by a circle whose radius is twice a grid cell size. After this operation a potential intensity field is defined and the estimated rainfall intensity Ie will be obtained by:
Ie(a,t) = Ip(a,t) Pr(a,t) (2) Formula 1 states that, when integrating estimated rainfall intensity on a grid cell area resulting value will be close from actual gridded data. A consequence of this formula, is that rainfall information can be supplier at a much coarser scale than the resulting product and the fine
structures are extracted from rainfall probability estimates.
3.2 Validation
Due to a lag in 2004 ground data transmission we have not yet a validation database. But in a previous experiment we have tested this method on a similar algorithm based on Météosat 7 (Chopin, 2004).
Comparison demonstrated a clear advantage of downscaled data when compared with initial gridded data. As Meteosat statiscal model was simpler than MSG one we can expect to get at least similar results when running this algorithm on the new satellite.
4 CONCLUSION AND PERSPECTIVES 4.1 Immediate method enhancements
To get this method fully operational several improvements have to be integratted.
First of all, the exploitation of TRMM satellite will be stopped in a next future and there is no replacement planned for the precipitation radar. So we are constituting a TRMM/MSG database as large as possible to avoid the requirement of network training on coincident data. For the same reason we are investigating the use of aerological data as model input.
Obviously, much more informations could be extracted from variation features. More sophisticated indicators have to be elaborated for a proper retrieval of clouds morphologic and dynamic properties.
4.2 Rainfall estimation on South America
As a great part of South America is inside of MSG scanning area, it should be theoritecaly possible to use the same algorithms for Brazil than for West-Africa. But for geometric considerations GOES-E will perform much more better than MSG on this area. Using MSG should require a correction scan angle algorithm. First experiments have indicated than MSG IR/probality relation computed on W-Africa is closer from GOES IR/Probability on S-America than from uncorrected MSG IR:Probability on the same area. Moreover it is not sure that, to identify deep convection kernels, MSG radiometer would more efficient than GOES one.
The main adjustments in transferring our rainfall estimation method will be likely more related to
specificities of physical environment than to differences in satellite observation systems. A specific issue should the integration of slope and low level winds for a better modeling of orographic phenomena.
4.3 A class of methods
As both environmental features and data collect system are varying, we don't believe a unique optimal rainfall estimation method can be defined but rather a general frame of algorithm design. Our present work can be considered as a first element of this specification system.
5 REFERENCES
Adler, R.F. and Negri, A.J. A satellite infrared technique to estimate tropical and stratiform rainfall. Journal of applied meteorology, 27:30-51, 1988.
Ali, A., Lebel, T. and Amani, A. Invariance in the spatial structure of Sahelian rain fields at climatologic scales. Journal of hydrometeorology, 4(6):996-1011, 2003. Arkin, P.A. and Meisner, B.N. The relationship between large-scale convective rainfall and cold cloud over the western hemisphere during 1982-84. Monthly weather review, 115:51-74, 1987.
Ba, M.B. and Gruber, A. GOES Multispectral Rainfall Algorithm (GMRA). Journal of applied meteorology, 40:1500-1514, 2000.
Bergès, J.C. Neural networks and tree classifiers: an application to rainfall estimation. Proceedings of the
2003 IEEE International Geoscience And Remote Sensing Symposium, Toulouse, July 2003.
Breiman, L., 1994. Bagging predictors. Technical report 421, Departement of statistics, University of California, Berkeley.
Chopin, F., Bergès, J.C., Desbois, M., Jobard, I. and Lebel, T. Multi-scale precipitation retrieval and validation in African monsoon systems. Proceedings of the 2004 European Geoscience Union, Nice, April 2004.
Funahasi, K.I. On the approximate realisation of continuous mapping by neural networks, Neural networks, 2:182-192, 1989.
Hsu, K., Gao, X., Sorooshian, S. and Gupta, V. Precipitation estimation from remotely sensed information using artificial neural networks. Journal of applied meteorology, 36:1176-1190, 1996.
Iguchi, T., Kozu, T., Meneghine, R., Awaka, J. and Okamoto, K. Rain-profiling algorithm for the TRMM precipitation radar. Journal of applied meteorology, 39:2038-2052, 2000.
Key, J. and Schweiger, A.J. Tools for atmospheric radiative transfer: Streamer and FluxNet. Computers & Geosciences, 24(5), 443-451, 1998.
Todd, M.C., Kidd, C., Kniveton, D. and Bellerby, T.J. A combined satellite infrared and passive microwave technique for estimation of small-scale rainfall. Journal of atmospheric and oceanic technology, 18:742-755, 2001.