HAL Id: halshs-00384496
https://halshs.archives-ouvertes.fr/halshs-00384496
Submitted on 15 May 2009
HAL is a multi-disciplinary open access
archive for the deposit and dissemination of
sci-entific research documents, whether they are
pub-lished or not. The documents may come from
teaching and research institutions in France or
abroad, or from public or private research centers.
L’archive ouverte pluridisciplinaire HAL, est
destinée au dépôt et à la diffusion de documents
scientifiques de niveau recherche, publiés ou non,
émanant des établissements d’enseignement et de
recherche français ou étrangers, des laboratoires
publics ou privés.
The impact of the European Union Emission Trading
Scheme on electricity generation sectors
Djamel Kirat, Ibrahim Ahamada
To cite this version:
Djamel Kirat, Ibrahim Ahamada. The impact of the European Union Emission Trading Scheme on
electricity generation sectors. 2009. �halshs-00384496�
Documents de Travail du
Centre d’Economie de la Sorbonne
The impact of the European Union Emission Trading
Scheme on electricity generation sectors
Djamel K
IRAT,Ibrahim A
HAMADAThe impact of the European Union Emission Trading
Scheme on electricity generation sectors
Djamel KIRAT and Ibrahim AHAMADA
y zApril, 2009
Centre d’Economie de la Sorbonne, Paris school of Economics, University Paris1 Pantheon-Sorbonne. Ad-dress: 106-112 boulevard de l’hôpital 75013 Paris, France. Phone : 33 1 44 07 82 13. Email: djamel.kirat@univ-paris1.fr.
yCentre d’Economie de la Sorbonne, Paris school of Economics, University Paris1 Pantheon-Sorbonne.
Address: 106-112 boulevard de l’hôpital 75013 Paris, France. Phone : 33 1 44 07 82 08. Email: ahamada@univ-paris1.fr.
zThe authors would like to thank Katheline Schubert and participants of the meeting ”Environmental economics" held in
Abstract
In order to comply with their commitments under the Kyoto Protocol, France and Germany participate to the European Union Emission Trading Scheme (EU ETS) which concerns predominantly electricity gen-eration sectors. In this paper we seek to know if the EU ETS gives appropriate economic incentives for an e¢ cient and strong system in line with Kyoto commitments. Because if so electricity producers in these coun-tries should include the price of carbon in their costs functions. After identifying the di¤erent sub periods of the EU ETS during its pilot phase (2005-2007), we model the prices of various electricity contracts and look at their volatilities around their fundamentals while evaluating the correlation between the electricity prices in the two countries. We …nd that electricity producers in both countries were constrained to include the carbon price in their cost functions during the …rst two years of operation of the EU ETS. During this period, German electricity producers were more constrained than their French counterparts and the inclusion of the carbon price in the cost function of electricity generation has been so much more stable in Germany than in France. Furthermore, the European market for emission allowances has increased the market power of the historical French electricity producer and has greatly contributed to the partial alignment of the wholesale price of electricity in France with those of Germany.
Résumé
A…n d’être en conformité avec leurs engagements pris dans le cadre du protocole de Kyoto, la France et l’Allemagne participent au marché européen des permis d’émission de carbone qui concerne majoritairement les producteurs d’électricité. Dans cet article nous cherchons à savoir si ce marché est un outil économique incitatif en ligne avec les engagements de Kyoto et bien conçu pour être économiquement performant. Car si tel est le cas les producteurs d’électricité de ces pays devraient intégrer le prix du carbone dans leurs fonctions de coût. Après identi…cation des di¤érentes sous périodes qu’a connu le marché européen des permis d’émission durant sa phase pilote (2005-2007), nous modélisons les prix de di¤érents contrats d’électricité et étudions leurs volatilités autour des fondamentaux tout en évaluant la corrélation entre les marché électriques des deux pays. Nous trouvons que les producteurs d’électricité des deux pays ont été contraint d’intégrer le prix du carbone dans leurs fonctions de coûts durant les deux premières années de fonctionnement du marché européen des quotas d’émission. Durant cette période, les producteurs allemands étaient plus contraints que leurs homologues français et la prise en compte de la contrainte carbone par les producteurs d’électricité s’est faite de manière beaucoup plus stable en Allemagne qu’en France. De plus, le marché européen des quotas d’émission a augmenté le pouvoir de marché de l’opérateur historique français et a grandement contribué à l’alignement partiel des prix de gros de l’électricité en France sur ceux de l’Allemagne.
Keywords: Carbon Emission Trading, Multivariate GARCH models, Structural break, Non Parametric Ap-proach, Energy prices.
1
Introduction
For the implementation of the Kyoto Protocol whose objectives are in force since January 2008, the European authorities have organized a European market for CO2 permits in January, 2005. It’s the European Union Emissions Trading Scheme (EU ETS). It concerns mainly the energy1 and industrial sectors major emitters. The market is based on a mechanism of “cap and trade” where the actors are free receivers of annual emission permits of CO2 at the beginning of the year. They have to achieve their commitment by providing so many permits as tons of emitted CO2 at the end of the year. Those that have emitted more CO2 than their allocation have to comply buying permits on the market. The energy sector and mainly the sector of electricity generation is by far, the most CO2 emitter. Hence it has been the largest share of the Community allocation for the period 2005-2007. What so lets glimpse narrow relations between the electricity market, the markets of the fossil fuels used in the electricity generation and the European market for CO2 permits. The main objective of the EU ETS is to encourage the industry’s most emitters to reduce their carbon emissions and invest in clean technologies. So achieving this objective is conditioned by the emergence of a real carbon price signal. The latter would require electricity producers to make long-term choices to produce electricity with fewer emissions. In this context, the ex-post empirical analysis of the impact of the introduction of the European market for CO2 permits on energy markets and, particularly that of electricity, is essential to assessing the e¢ ciency and the consequences of the introduction of EU ETS.
The electricity price is determined by the costs of fossil fuels, the impact of environmental policies and measures and climatic factors such as temperature and raining. In Europe, it is widely agreed that gas and coal prices account for the variations of the electricity price. Besides, economic theory teaches us that carbon price is a marginal cost and that the carbon permit has an opportunity cost equal to its market price. It suggests that carbon price should be included in the price of electricity. Empirically, the rough fall in the price of CO2 of about 10 e / ton in April, 2006 which was followed at once by a movement of 5 to 10 e / MWh on the electricity market (Reinaud, 2007) and the English company British Energy which lost 5 % of its market capitalization in three days during the same period (Bunn and Fezzi, 2007) are all evidence of the in‡uence of the carbon market in the electricity market. Many studies have dealt with the impact of carbon price on electricity prices of various European markets for the last three years. So Sijm et al. (2005, 2006) have studied the case of Dutch and German electricity markets to determine the share of carbon price which is re‡ected in the price of electricity. Their study was based on an Ordinary Least Squares (OLS) estimate of a basic linear model. Honkatukia et al. (2006) have studied the long-run and short-run dynamics of electricity prices, gas and coal prices and the permit of carbon in the Finnish market, based on a VAR analysis. Bunn and Fezzi (2007) adopted a similar approach to analyze the English electricity market excluding the price of coal and including the temperature and dummies as exogenous variables. They realized a structural analysis of the relations between energy prices and carbon price through short-run restrictions. The results of these studies are all the more contrasting that approaches are di¤erent and the countries surveyed are of great
diversity in their energy mixes. So, the absence of unanimous response to the problem of the e¤ect of the EU ETS on the price of electricity (Reinaud, 2007) is mainly due to the coexistence of various electricity markets in Europe and the heterogeneity of energy mixes of the European Union countries. Furthermore, these studies have covered, at most, the period from January 2005 to May 2006.
This article aims at providing a clear answer about the impact of the introduction of the EU ETS on the electricity generation sector by taking into account this heterogeneity. It deals with the volatility of electricity price around its fundamentals and compare two European countries with very di¤erent energy mixes that are France and Germany. It estimates a model based on the cost function of electricity generation, which includes the cost of carbon, and measures the instantaneous correlation between the wholesale electricity prices in both countries. It covers all the pilot phase of the EU ETS (2005-2007) and takes into account its di¤erent sub periods. It is organized as follows: Section 2 presents the organization and functioning of the sector of electricity ; Section 3 is devoted to the presentation of the mechanism of the price formation of emission permit and its impact on the sector of electricity ; section 4 presents a descriptive analysis of relations between the electricity markets on the one hand, the primary energy markets and the market for emissions on the other hand, and the steps of the econometric modelling ; Section 5 presents the results and their interpretation ; Section 6 concludes this article.
2
The sector of electricity generation
The electricity sector has received nearly 55 % of the Community allocation of the pilot phase of the European market for C02 permits. Before analyzing the impact of the introduction of carbon constraint on this sector, it is advisable to present its organization and functioning. This sector is organized around four main areas : production, transport, distribution and marketing. Purely …nancial activities such as brokerage and trading over the counter or on power exchanges are added to these four market segments. Electricity generation is the main polluting activity in this sector, it has been put in competition in the process of liberalizing the electricity market in Europe from 1998. Electricity is produced from various primary energy sources such as nuclear power, coal, oil, gas, hydropower, biomass, wind, solar and geothermal. The proportions of the use of these di¤erent primary energy sources in electricity generation in a country determines its energy mix. The latter is very di¤erent from an European country to another because of di¤erences in energy policies and speci…c geographical and geological features of each country. Besides, electricity is not a good as another because it is not storable, what confers on its generation sector particular characteristics which we detail in the following.
2.1
The
merit order between electricity generation technologies and the
adap-tation of supply to demand
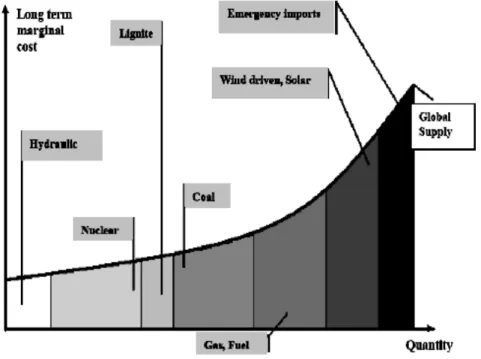
Electricity demand is characterized by important ‡uctuations. It shows variations from one hour to another, day to the next in the week and season to another during the year. These changes require the need for an instantaneous equilibrium between supply and demand, resulting in a continuous adaptation of electricity supply to changes in demand. As electricity production presents very di¤erent costs according to the used technology, pro…tability is di¤erent depending on the choice of the primary energy used in electricity pro-duction. Therefore, electricity production is subject to a sequential use of production technologies which depends on their production costs. The producers should rather start up power plants to meet the demand, in increasing order of variable marginal costs of production. That is the concept of “merit order ” between the various technologies which integrate di¤erent sources of primary energy in electricity production. The merit order is determined by the variable marginal cost of production which takes into account only the variable costs (the costs of fuels and operational costs). It re‡ects an order of pro…tability so that production units with the lowest marginal costs are held …rst and foremost in plans for electricity generation. The merit order between technologies is not …xed. The inclusion of the price of carbon allowances in cost functions of the most polluting technologies can have an impact on the merit order among the primary energy used to produce electricity and thus reverse the order of pro…tability. So, we determine the Switching price (Sijm et al., 2005) which is the price of carbon for which it becomes more interesting for a producer to use gas power plant rather than coal plant.
2.2
The pro…tability of electricity production: trade o¤ between short-run and
long-run strategies
It is now clear that the choice of power production plan will depend on the merit order, but this is not the only determiner of the choice of production plan. In fact, the producer will take into account the number of hours of functioning necessary for the pro…tability of a given type of power plant. At this end, the producer integrates into these choices of production the following criteria:
The depreciation of …xed capital invested in the various types of power plants
It takes into account the facilities life duration, environmental costs of CO2 emissions and the energy e¢ ciency of each fuel.
The "availability" of kwh produced
A kwh which can be produced on demand (gas, oil and coal) allows full adaptation of supply to demand, while a random kwh depending on the weather (solar, wind), does not satisfy the customer’s demand at the right time. We must make use of complementary production means to respond customer demand, which induces an additional cost.
The number of hours of annual operation of each type of power station
The pro…tability of a type of power plant depends on the number of annual hours of its operation. While nuclear power stations are pro…table when they run all year (this type of technology is not pro…table to use less than 1500 hours per year), a gas plant is pro…table for a period of annual functioning from 1000 to 1500 hours.
So electricity producers make delicate calculations and are very sensitive assessment of the production costs of di¤erent technologies while ensuring production following the demand curve in real time. In peak periods, a number of production units are used. As demand decreases, the number of production units decreases. This means stop and restart units depending on the level of demand. The operational features of the production units (including start-up time, the levels of maximum and minimum production, energy e¢ ciency) predestine power plants to a mode of continuous or discontinuous production. This justi…es the presence of units of production of various types in the same park production. Logically, we can say that during peak periods it’s best to mobilize units which have low …xed costs and high variable costs. In contrast, outside peak periods, it’s preferable to use units that have low variable costs and high …xed costs to be spread over a longer use. Figure 1 illustrates the supply curve of electricity resulting from the choice between technologies of electricity generation using di¤erent sources of primary energy and re‡ecting a long term marginal cost in the absence of any carbon constraint.
2.3
Energy mixes and relations between the prices of primary energies and
electricity prices
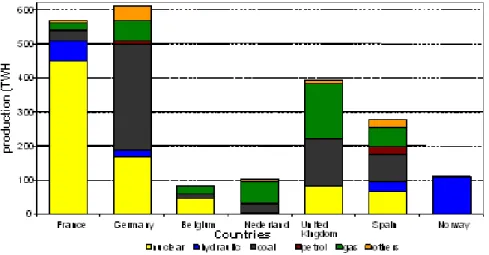
In order to show the link between the carbon market, the electricity market and markets of primary energies, it seems important to analyze the nature of energy mixes of European countries. This analysis justi…es, among others, the choice of European countries to be included in the comparative analysis. We identify the countries in which the links between the carbon and energy markets would be most likely to be strong and choose among them countries with diverse energy mixes. Figure 2 represents the energy mixes of some the major European countries in 2004. Countries with predominantly gas or coal power plants are more likely to be a¤ected by variations in the price of carbon, because power plants using coal or gas are emitting more CO2. We then focus special attention to countries with energy mixes dominated by gas and coal. In the case of Germany, more than half of the electricity is generated using coal and lignite, while France produces almost 80 % of its electricity from nuclear energy. Thus, the importance of coal and gas in power generation and the concern to take into account the di¤erences between the energy mixes of the European Union countries lead us to retain Germany and France for the comparative study.
Figure 2: Annual electricity production in Europe by country and type of primary energy (2004)
3
The Emissions Trading Scheme and its impact on electricity
producers
The emission permit of CO2 is a free traded good. Its price is determined by the meeting of supply and
demand on the market. But in the case of emission permits, it is necessary to make the distinction between the short-term daily market and the long-term annual compliance for which market participants have committed themselves. Thus, the di¤erences in horizons between the daily emissions market and the annual commitment
suggest phenomena of persistent shocks. Indeed, while agents record instantly shocks on a daily basis, it remains that they can react more downstream to collected information by incorporating carbon into their long term strategies. This can cause phenomena of persistent shocks.
Initially, the allowance market was scheduled to run in two phases (Phase 1: 2005-2007; Phase 2: 2008-2012). On each of these two phases, each member of the European Union must accept a national allocation plan to an annual reduction of CO2 emissions while retaining the prerogatives relating to the de…nition of major variables such ceiling of the emissions attributed to the device, the list of plants that will be concerned and the rules for allocating quotas to existing and new facilities. The plan is based on a percentage of emission reductions for each installation of a country from the principle of "grandfathering". Therefore, there is an obligation to reduce annual emissions of CO2, which is uncertain because of this very principle. Then, through the European Union, there is a supply function of reduction of CO2 emissions (Bunn & Fezzi, 2007) re‡ecting increasing marginal costs of reducing emissions over a year. At the sector of electricity, this supply function re‡ects the changes that occur in the merit order curve between the primary energies used in electricity generation. These changes depending on the energy mixes and installed productive parks in each country, the supply function of reduction of CO2 emissions re‡ects, for low costs of reducing CO2 emissions, the substitution of lignite by coal in electricity production in Germany, and for higher abatement costs, the more expensive alternative of substituting gas for coal in electricity production in the United Kingdom or Germany. The response of the sector of electricity to the obligation to reduce annual emissions of CO2 is di¤erent from one EU country to another. It depends on the country’s energy mix and therefore the prices of primary energies and the price reached by the quota of carbon. Hence, the supply function of reduction of carbon emissions is convex, discontinuous, uncertain and variable through the year re‡ecting the costs of switching between technologies of power generation.
The agents are involved in the daily market for allowances by buying and selling permits for CO2 emissions. They make their decisions based on their forecasts Et[f (Dj)], where f is the function of emission
reduction supply and Dj the required emission reduction during phase j. These forecasts, which focus on
the annual equilibrium price of CO2, evolve continually during the year (Bunn & Fezzi, 2007). Therefore, the fact that electricity producers that emit more CO2 than their allowances are starting to buy allowances on the market to be in compliance, it is reasonable to predict that the price of carbon is added to fuel costs and operational costs of electricity generation. On the other hand, due to free allocation of CO2 emission allowances to participants at the beginning of the period and the emergence of a carbon price from the daily market, these permits are a new liquid assets available to participants, swinging an opportunity cost of emission permit equal to its market price (Sijm & al., 2006). Critics on the e¢ ciency of the EU ETS as a means to reduce emissions using this argument to show that in the short term polluters are making windfall pro…ts. If the European market for emissions proved to be long position, which was the case during its pilot phase, and face the uncertainty inherent in the emission reduction supply function, participants able to anticipate such a market development would make many windfall pro…ts.
4
Electricity price formation, database and econometric modelling
4.1
From stylized facts to the econometric model
Electricity wholesale markets in France and Germany are of oligopolistic market design. The price of electric-ity results from the market clearing of supply and demand on power exchanges and is equal to the marginal cost of electricity generation plus a mark-up. Due to the fact that electricity demand is inelastic, the relative di¤erence between the price of electricity and its marginal cost of production remains constant. Thus, with a constant mark-up rate, changes in electricity prices will re‡ect the changes in cost of electricity generation and the prices of electricity will depend directly on the marginal cost of producing electricity. Electricity de-mand ‡uctuates continuously within a certain interval. Its curve meets the supply curve of electricity at one point of this interval and achieves the electricity market equilibrium, thus determining the wholesale price of electricity. The range within the demand ‡uctuate corresponds to minimum and maximum quantities of electricity consumed at any time during the year. This interval coincides with the quantity of electricity produced to meet demand from primary energy sources that may di¤er between countries with regard to their diverse energy mixes and their levels of electricity demand. The marginal cost of electricity is equal to the cost of primary energy used to produce the last unit of electricity, operating costs thereon, plus any inclusion of carbon cost of production of that unit. The price of primary energy used to produce the last unit of electricity is a major determinant of electricity prices. For these two countries, the primary energy can be either gas or coal. More, depending on whether the cost of carbon is included or not in the electricity generation function, the price of emissions of carbon dioxide will be a determinant of electricity price or on the contrary it will have no in‡uence on it.
Climatic variables such as temperature, rainfall or brightness may also be important determinants of the price of electricity in a country. Indeed, the temperature and lighting can in‡uence the demand for electricity while rainfall may have an impact on the supply of electricity in a country for which the share of hydropower in the energy mix is important. The importance of any of these variables is then dependent on the location and composition of the country’s energy mix. In the two countries covered by our study the temperature variable is crucial in electricity prices. The temperature exerts a dual e¤ect on energy demand in general and that of electricity in particular. The relationship between electricity demand and the temperature is non-linear « V » shaped function, as electricity demand increases for both low temperatures and high temperatures (Engle et al., 1986). To take into account the nonlinearity of the relation between electricity price and the temperature, we estimate this function, in the cases of both countries, by the second order local polynomials method, in order to determine the threshold for which the electricity price-temperature gradient is reversed. From there, we de…ne two variables of temperature for each country: the change in temperature above the threshold (Thot) and temperature variation below the threshold (Tcod)2.
2To linearise the "V " shaped function, one has to consider that if during the intra-period variation the temperature crosses
the threshold the relationship is reversed. To overcome this problem Thot
t is de…ned as all the variation of the temperature that
occurs above the threshold and Tcod
From these stylized facts concerning the electricity price formation process, we estimate an empirical time series econometric model. The econometric speci…cation of the relation between the price of electricity and its determinants expressed above will be done using a dynamic modelling because price variables in general are functions of expectations formed by agents from their past experiences and new information they have, in other words, past and contemporary prices. So one can write expectation expressed in contemporaneous period of the value of future electricity prices as follows:
Ptelect= Et Ptelec jZt; Pt 1elec; Pt 2elec; ::: = g Zt; Pt 1elec; Pt 2elec; ::: (1)
Where Zt represents the new information available to agents in the current period, such energy prices
entering the electricity generation process, and Pelec
t i the past values of electricity price. Then, we opt
for an econometric model where the price of electricity is based on its past values, the prices of gas, coal and emissions of carbon dioxide and temperature variables Thotand Tcod presented previously. Let be the
following equation (2):
Ptelec = 0+ p
X
i=1
iPt ielec+ Ptgas+ Ptcoal+ Ptcarbon (2)
+ 1Ttcod+ 2Tthot+ "t
Where Pty the logarithm of the price of the commodity y at the period t. The price variables taken into logarithm have the double advantage of reducing the variance and allow reasoning in terms of elasticity. The number of lags p of the dependent variable to take as a regressor will be determined for each country, minimizing the Akaike (AIC) or the Bayesian (BIC) information criterion.
4.2
Data and descriptive analysis
Our study aiming at identifying the responses of the sector of electricity to the introduction of the EU ETS, we’ll use electricity prices from di¤erent contracts on the electricity stock exchanges3 of both countries in
e / MWh. As the market segment of intra-day contracts lacks liquidity and is only intended to answer unforeseen punctual physical needs during the day, we will use the day-ahead and the month-ahead base load4 electricity prices of the French and German electricity stock exchanges. These data sets and all those
used in this study are weekdays frequency and run from July 4th, 2005 to June 29th, 2007. Due to its
one is above the threshold for which the relationship between the price of electricity and the temperature is reversed and the other below, then Thot
t = T hreshold temperature(t)and Ttcod= temperature(t + 1) T hreshold. See the appendices for
more details about determining the threshold.
3It is Powernext in France and EEX in Germany.
4The base load price of electricity is the price on the block for 24 hours. It is an arithmetic average price of 24 hours of the
liquidity, the carbon spot price of the Powernext stock exchange expressed in e per ton will be used. On the markets of the primary energies, the following price series expressed in e per MWh will be used. It is the gas price of the month-ahead future contract traded on the Zeebrugge hub and the coal price of the month-ahead future contract Coal CIF ARA. The variables of temperature Thot and Tcod were built from
the Powernext daily index of temperature (expressed in degrees Celsius) for the two countries. These index are calculated from a weighted average, by regional population, of temperatures recorded at representative regional weather stations of each country. Finally, we have all of a sample of 520 observations for each series of data and we will now present their main characteristics.
Figures 3 to 5 present the evolution of prices of various electricity contracts proposed on the French and German electricity stock exchanges, as well as the evolution in the prices of gas, coal and carbon.
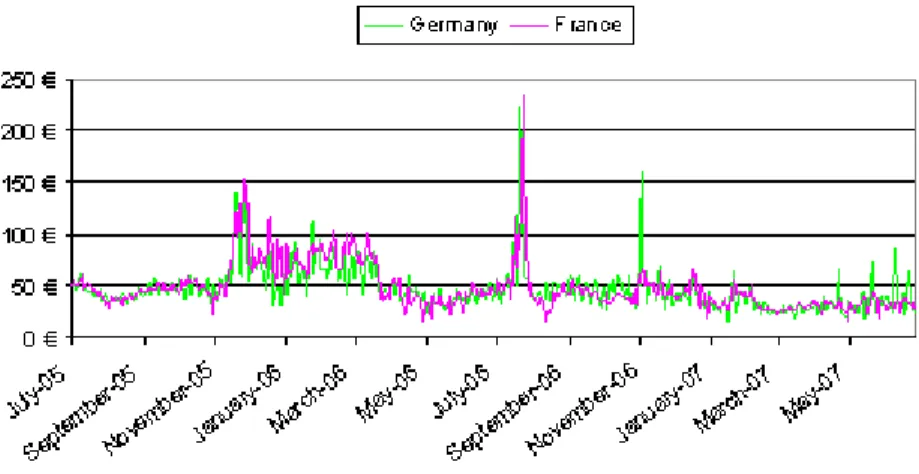
Figure 3: Month-ahead contract electricity price in France and Germany.
These …gures show that the prices of various electricity contracts have varying volatilities. Prices of day-ahead contracts are of an extreme volatility compared to those of month-ahead contracts. The price of coal shows no major changes and remained relatively stable within a range from 6 to 8 e /ton during the period from July, 2005 till June, 2007 with a trend towards the upper bound of the range at the end of the period. During the same period the price of gas shows a decreasing general trend marred by large ‡uctuations, including a signi…cant increase during the winter of 2005 when gas prices rose from just under 20 e / MWh in October to over 50 e / MWh in December. The spot price of carbon has ‡uctuated in a range from 20 to 30 e per ton from the launch of Powernext5 until April, 2006 when the price of emissions
of carbon dioxide fell to nearly 15 e in only 3 days. This sudden collapse of the carbon price followed the
Figure 4: Day-ahead contract electricity price in France and Germany.
disclosure of the 2005 veri…ed emissions by the European authorities. The results revealed a net long position of the carbon market with more allowances than actual emissions.
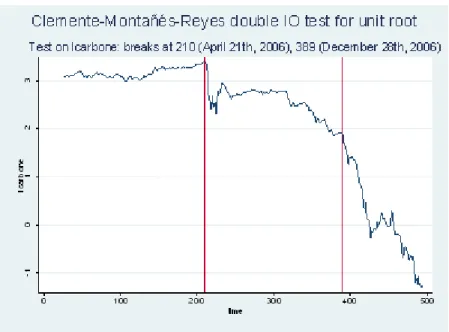
It was a carbon market correction which induced a signi…cant break in the series of carbon spot price. It was likened to a structural break (Alberola et al., 2008) in the sense that, the pace of the series of carbon spot price has completely changed after the shock. Then, with the approach of the end of the pilot phase of the EU ETS, the carbon spot price continued to decline and converge towards zero con…rming the long position of the carbon market not only for the …rst two years of its operation but over the whole pilot phase. In addition, the youth of the market for emission permits, source of instability of this market because players are in learning period, suggests the presence of other structural breaks in the series of spot price of carbon. Moreover, Alberola et al. (2008) have identi…ed two structural breaks in this series. The …rst matches in April 2006 commented above and the other occurred on October 26, 2006 following the announcement of a nearly 15% reduction in allowances for the second phase of the EU ETS (2008-2012). Hence, as done by Alberola et al. (2008), we apply a unit root test with two structural breaks to detect dates of breaks occurred on the series of carbon spot price. We choose the unit root test with double change in the mean by Clemente Montanès and Reyes6(1998). This test make the dates of breaks endogenous. It includes two test procedures
each depending on detrending or not the series before performing the unit root test. Thus, the procedure applying a …lter before the test is called AO (Additive Outlier) and serves to capture sudden changes in the series. The one which detrend and performs the test at the same time is called IO (Innovational Outlier) and serves to capture incremental changes in the mean of the series. The test …ndings concerning dates of breaks are summarized in …gure 6.
The results of the test run on the logarithm spot price series of emission allowances suggest two structural
Figure 5: Carbon, gaz and coal prices
breaks. Indeed, if we retain the results of the test by Clemente Montanès and Reyes based on the IO procedure, we note that it detects two structural breaks that occurred on April 21, 2006 and December 28, 2006. The …rst date corresponds to a sharp drop in the price of carbon due to a market correction following the publication by the European authorities of the results of 2005 veri…ed emissions. The second date correspond to the beginning of the convergence towards zero of the carbon spot price following a change in agent’s decisions on the carbon market. Indeed, due to the mild winter in 2006 which ensured a weak electricity demand than in winter of 2005, agents have revised downward their forecasts concerning the equilibrium price of carbon. The long position of the carbon market in 2005, despite a cold winter, has prompted agents to anticipate a long position in the market in 2006 due to new information which they have concerning the mild winter of 2006. Thus, from December 2006, the participants to the carbon market have anticipated an exceeding in the allowances for 2006 and for the whole pilot phase of the EU ETS, including therefore the year 2007. This induced an excess of allowance supply on the market which led to a fall in the carbon price initiating a convergence towards zero on January 2007. These changes in agent’s expectations have been largely in‡uenced by the Stern7 review on the economics of climate change and the United Nations
conference on climate change of Nairobi, which began recalling the excess supply of allowances on European carbon market during its …rst period of operation. Then the carbon spot price was lower than 1e per ton in February 2007. The two structural breaks occurred on the series of carbon spot price and its convergence
7The Stern Review on the Economics of Climate Change is a report released on October 30, 2006 by economist Lord Stern
for the British government, which discusses the e¤ect of climate change on the world economy. It was heavily discussed and it predict that the total allowances in …rst period of the EU ETS will be only 1% below projected “business as usual” emissions.
Figure 6: Detection of dates of structural breaks occured on log carbon Spot price series with the Clementes Montanes Reyes test using IO procedure.
towards zero in the …rst period of the EU ETS were the consequences of an excess of allowances at the beginning of period compared to actual emissions and of the lack of allowance banking from one year to another and especially from the …rst period of the EU ETS to the second one.
4.3
Estimation of the models
In order to select the most appropriate representation to the modelling of each electricity price series, we estimate model (2) by Feasible least squares (F GLS) for each of them. We shall retain the most relevant models regarding the Akaike (AIC) and the Schwarz (BIC) information criterion, criteria M SE and R2
which are indicators of the explanatory power of a model. However, despite having used a robust estimate method to Heteroskedasticity, we focus special attention to the structure of the regression’s residuals to ensure their good properties all the more so the price series we have are of high frequency. Concerning this last point, since Engle (1982) we know that in the context of time series models for macroeconomic and …nancial data, variances of the disturbances were less stable than it is generally assumed and they often varied over time. We will then test the presence of ARCH e¤ects, a very common form of Heteroskedasticity in the time series of high frequency. We call models (a), (b), (c) and (d) models from the equation (2) when the series of electricity prices taken into account are respectively those of the French month-ahead contract, the French day-ahead contract, the German month ahead contract and the German day-ahead contract. ARCH tests applied to regression’s residuals of models (a) and (c) concerning the month-ahead electricity contracts do not reject the null hypothesis of no ARCH e¤ects, while the regression’s residuals of models (b) and (d) concerning day-ahead electricity contracts reject the null hypothesis of no ARCH e¤ects. These
last two models present an ARCH heteroskedasticity in the residuals. The presence of ARCH e¤ects in the residuals of models (b) and (d) requires their modelling alongside the mean equations. In addition, studying the stability of residuals is supplemented by the analysis of correlograms and partial correlograms of the disturbances. This analysis con…rms the stability of residuals of the model (a) while correlograms of the residuals of models (c) and (d) show the presence of a seasonality of order 5 in the prices of German electricity contracts. This seasonality is daily during the week, because the data are often weekdays frequency. At to capture the seasonality we build …ve dummies seasoni; i = 1; 2; 3; 4; 5, each corresponding to one business
day of the week j, j = Monday, ... Friday. This gives the variable season1which is such that:
season1=
1 if j = monday
0 otherwise and so on for every business day
Once the remaining seasonal variables are built, we re-estimate models (c) and (d) with including variables seasoni for i = 1; 2; ::; 5, then we check the stability of new estimated residuals. We call respectively models
(c’) and (d’) these two new models. The results show that the explanatory powers of both models were signi…cantly improved and all the selection criteria of models. In addition, ARCH tests concludes to the presence of ARCH e¤ects in the residuals of model (d’) but not in those of model (c’).
The presence of ARCH e¤ects in the models (b) and (d’) requires their inclusion in modelling. For this reason, models of di¤erent series of electricity prices may vary depending on the modelling of ARCH or GARCH e¤ects detected in the disturbances of preliminary regressions or although we take into account the existence of a seasonality as in the cases of models (c) and (d). These many considerations justify the selection of following models for modelling each electricity price series. In the case of month-ahead contracts, the prior model (a) will be used for the …nal modelling of the French electricity price with its high explanatory power, led by both an R2 of 97% and root mean squared error (RM SE) of only 4%, and the stability of
its residuals. Besides, due to its good statistical properties, we retain the model (c’) for the …nal modelling of the price of German month-ahead electricity contract. Indeed, the analysis of correlogram and partial correlogram of the residuals of this model suggests that the disturbances has a white noise structure. In addition, this model presents an R2 of 85; 7% and a root mean squared error of only 11%. Concerning the price series of day-ahead contracts, the concern to take into account any interdependence8 of the French and the German electricity markets leads us to retain the following model with Dynamic Conditional Correlation (Engle, 2002; Engle and Sheppard, 2001) DCCE(1,1) errors:
8The estimate results of models of the prices of month-ahead electricity contracts in both countries using SUR method are
8 > > > > > > > > > > > > > > > < > > > > > > > > > > > > > > > :
Ptelec=f ra= 0+P2i=1 iPt ielec=f ra+ P gas
t + Ptcoal+ Ptcarbon
+ 1Ttcod=f ra+ 2Tthot=f ra+ " f ra t
Ptelec=ger= 0+P2i=1 iPt ielec=ger+ P gas t + Ptcoal+ Ptcarbon + 1Ttcod=ger+ 2Tthot=ger+ P5 j=2 jseasonj+ "gert ("f rat ; "gert ) N(0; Ht)
The model DCCE(1; 1) is de…ned as:
8 > > > < > > > : Ht= DtRtDt Dt= diag(ph11t;ph22t) Rt= (diag Qt)1=2Qt (diag Qt) 1=2
Where the 2 2 symmetric positive de…nite matrix Qtis given by:
Qt= (1 1 2)Q + 1ut 1uTt 1+ 2Qt 1
With u the matrix of standardized residuals. Q is the 2 2 unconditional variance matrix of ut, and 1 and 2 are non-negative parameters satisfying 1+ 2 < 1. The approach to estimate the DCC(1; 1)
model includes two steps9. First, the conditional variance of the price of day-ahead electricity contract
in each country is estimated from a GARCH(1; 1) speci…cation at the same time as the conditional mean equation. Thereafter, the standardized residuals of regressions performed in the …rst step are used to model the correlation in an autoregressive way to obtain the conditional correlation matrix varying over time. The conditional variance-covariance matrix Ht is the product of the diagonal matrix of conditional standard
deviation Dt with the conditional correlation matrix Rt and the diagonal matrix of conditional standard
deviation Dt. The Rt=
0
@ 1 12t 21t 1
1
A matrix measures the instantaneous conditional correlation between electricity prices of day-ahead contracts on German and French power exchanges. The results of estimates of these models are reported in Table 1 and …gure 7.
However, structural breaks in the carbon spot price series, occurred on April 21, 2006 and December 28, 2006 detected with the Clemente Montanès Reyes test using the IO10 procedure, seemed likely to have an
impact on long-run relationship between the price of carbon and those of electricity and its fundamentals. Indeed, we have identi…ed a long-run relationship between the price of electricity and its fundamentals based on the average correlations between these variables over the whole period from July 4, 2005 to June 29, 2007. However, the correction occurred on the carbon market after the announcement of the 2005’s
9See the annex for more details about estimating this model.
1 0The dates of structural breaks of the carbon Spot price series detected with the AO procedure are close to the dates detected
compliance results and especially the convergence towards zero of spot carbon price started on December 28, 2006 could alter this relationship by drastically reducing the weight of carbon cost in the cost function of electricity generation. This fall in the cost of carbon, which could bring about changes in the merit order between technologies of electricity generation, are likely to alter the long run relationship between the price of electricity, the prices of fossil fuels and the price of carbon. To evaluate the potential impact of the structural break of carbon spot price on the long-run equilibrium relationship between the prices of di¤erent electricity contracts and their fundamentals we proceed to test the stability of estimated coe¢ cients of the variables carbon price, gas price and coal price. We assume that all the other estimated coe¢ cients are stable. So we test the equality of these coe¢ cients for the periods before and after the carbon spot price structural breaks. In practice, we test …rst the equality of these coe¢ cients for the periods before and after December 28, 2006. Then we test the equality of coe¢ cients for the periods before and after April 21, 2006 but with restricting the total sample to the period from July 4, 2005 to December 27, 2006 in order to purge our estimates of the weight of any changes occurring after December 28, 2006. The results of these stability tests suggest that the long-run relationship between the price of electricity, the fossil fuels prices and the carbon spot price is unstable over the whole period and that it has changed from December 28, 2006 in the cases of the German electricity contracts and the French day-ahead one. Furthermore, these results support that, for all electricity contracts, the correction occurred on the carbon market in April 2006 did not a¤ect the long-term relationships.
The carbon spot price structural break occurred on December 28, 2006 therefore a¤ected the long-run equilibrium relationship between the price of electricity and its fundamentals in the cases of German electricity contracts and the French day-ahead one. This justi…es the estimation of models of these electricity contracts over two sub-periods: the period from July 04, 2005 to December 27, 2006 and the period from December 28, 2006 to June 29, 2007 for the purpose comparisons. Then, the next section is devoted to interpret the estimation results.
5
Results and interpretation
Table 1 presents the estimation results of the models used for modelling the prices of various French and German electricity contracts over the whole period from July 4, 2005 to June 29, 2007 and by sub-periods. We focus …rst on full period results and, in a second step, we comment the results by sub periods.
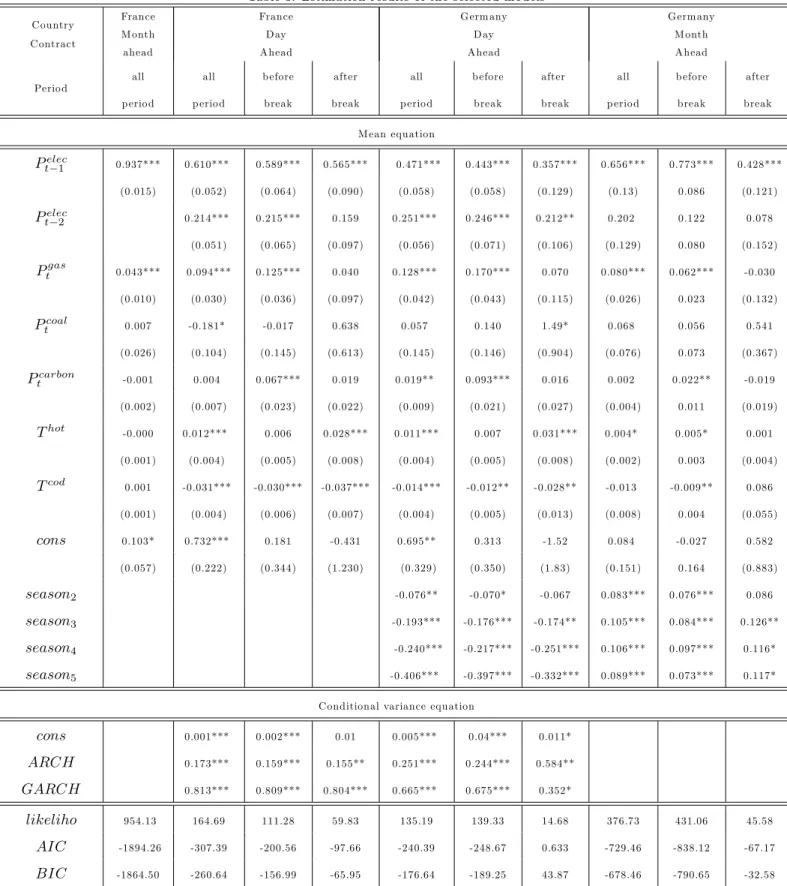
Over the whole period, all the estimated coe¢ cients signi…cant at level 5% have the expected signs. The estimated parameters of the logarithmic price variables in the mean equations are interpreted as long-run elasticities because the models re‡ect the long-run relationships. Higher values of estimated coe¢ cients of lagged electricity price variables and their degrees of signi…cance re‡ect the high dependence of contemporary electricity prices on those of the previous periods. This dependence is due to expectations of contemporary electricity prices made by agents in previous periods. These results argue that temperatures do not a¤ect the
Table 1. Estim ation results of the selected m o dels C ountry C ontract France M onth ahead France D ay A head G erm any D ay A head G erm any M onth A head Perio d all p erio d all p erio d b efore break after break all p erio d b efore break after break all p erio d b efore break after break M ean equation Pelec t 1 0.937*** 0.610*** 0.589*** 0.565*** 0.471*** 0.443*** 0.357*** 0.656*** 0.773*** 0.428*** (0.015) (0.052) (0.064) (0.090) (0.058) (0.058) (0.129) (0.13) 0.086 (0.121) Pelec t 2 0.214*** 0.215*** 0.159 0.251*** 0.246*** 0.212** 0.202 0.122 0.078 (0.051) (0.065) (0.097) (0.056) (0.071) (0.106) (0.129) 0.080 (0.152) Ptgas 0.043*** 0.094*** 0.125*** 0.040 0.128*** 0.170*** 0.070 0.080*** 0.062*** -0.030 (0.010) (0.030) (0.036) (0.097) (0.042) (0.043) (0.115) (0.026) 0.023 (0.132) Pcoal t 0.007 -0.181* -0.017 0.638 0.057 0.140 1.49* 0.068 0.056 0.541 (0.026) (0.104) (0.145) (0.613) (0.145) (0.146) (0.904) (0.076) 0.073 (0.367) Pcarbon t -0.001 0.004 0.067*** 0.019 0.019** 0.093*** 0.016 0.002 0.022** -0.019 (0.002) (0.007) (0.023) (0.022) (0.009) (0.021) (0.027) (0.004) 0.011 (0.019) Thot -0.000 0.012*** 0.006 0.028*** 0.011*** 0.007 0.031*** 0.004* 0.005* 0.001 (0.001) (0.004) (0.005) (0.008) (0.004) (0.005) (0.008) (0.002) 0.003 (0.004) Tcod 0.001 -0.031*** -0.030*** -0.037*** -0.014*** -0.012** -0.028** -0.013 -0.009** 0.086 (0.001) (0.004) (0.006) (0.007) (0.004) (0.005) (0.013) (0.008) 0.004 (0.055) cons 0.103* 0.732*** 0.181 -0.431 0.695** 0.313 -1.52 0.084 -0.027 0.582 (0.057) (0.222) (0.344) (1.230) (0.329) (0.350) (1.83) (0.151) 0.164 (0.883) season2 -0.076** -0.070* -0.067 0.083*** 0.076*** 0.086 season3 -0.193*** -0.176*** -0.174** 0.105*** 0.084*** 0.126** season4 -0.240*** -0.217*** -0.251*** 0.106*** 0.097*** 0.116* season5 -0.406*** -0.397*** -0.332*** 0.089*** 0.073*** 0.117* C onditional variance equation
cons 0.001*** 0.002*** 0.01 0.005*** 0.04*** 0.011* ARCH 0.173*** 0.159*** 0.155** 0.251*** 0.244*** 0.584** GARCH 0.813*** 0.809*** 0.804*** 0.665*** 0.675*** 0.352* likeliho 954.13 164.69 111.28 59.83 135.19 139.33 14.68 376.73 431.06 45.58 AIC -1894.26 -307.39 -200.56 -97.66 -240.39 -248.67 0.633 -729.46 -838.12 -67.17 BIC -1864.50 -260.64 -156.99 -65.95 -176.64 -189.25 43.87 -678.46 -790.65 -32.58
Standard errors are in () ; * ** and *** refer respectively to the 10%, 5% and 1% signi…cance levels of estimated coe¢ cients.
prices of month-ahead electricity contracts while the estimated coe¢ cients of temperature variables Thotand
Tcodre‡ect the fact that overall, softening temperatures in‡uence the price of day-ahead electricity contracts
to decline, and that variations in temperatures toward extreme values in‡uence these prices in increase. In particular, a positive variation of temperatures above the threshold, all things being equal, leads to higher prices of French and German day-ahead electricity contracts, in the same proportions, while a positive change in temperatures below threshold leads to a decrease in prices in di¤erent proportions. In the latter case, higher temperatures below the threshold in France and Germany, in the same proportions, will cause a decline twice as large in percentage terms of the price of the French electricity contract compared to the price of the German contract. As the temperature a¤ects the price of electricity only through electricity demand, we easily justify that temperature in‡uences only the prices of day-ahead electricity contracts. Indeed, the short term of day-ahead contracts and the di¢ culty to predict with accuracy the level of temperature beyond a few days explain that the electricity supply intended to meet the changes in electricity demand due to temperature variations is provided through day-ahead contracts. We note, however, that electricity prices in Germany introduce a daily seasonality during the week. For the day-ahead contract, this seasonality is manifested by a decrease in electricity prices during the week. So, being on Tuesday, Wednesday, Thursday or Friday results, all things being equal, respectively, in a reduction of the logarithm of the day-ahead contract price of 7%, 19%, 24% and 40% compared to the …rst day of the week. The falling price of electricity by 40% on Friday compared to Monday is due to reduced demand for electricity over the weekend as the day-ahead contracts traded on Friday to match the electricity demand of Saturday, day during which economic activity is very low.
The estimation results of mean equations argue that there are important di¤erences between countries and electricity contracts in the way the costs of primary energies and carbon costs are included in the cost function of electricity generation. In France, only the price of gas has an impact on the price of electricity at the long-run equilibrium. However, this impact is twice as high on the day-ahead contract compared to the month-ahead electricity contract. Indeed, higher gas prices by 1% results, all things being equal, an increase of 0:04% of the price of month-ahead contract and an increase of 0:09% of that of the day-ahead contract. The price of carbon, on average over the whole period, was not a determinant of the prices of French electricity contracts. In Germany, the price of gas, unlike that of coal, has been a determinant of the price of both contracts of electricity. Thus, higher gas prices by 1% result, all things being equal, an increase of 0:08% of the price of month-ahead contract and an increase of 0:13% of that of the day-ahead contract. The price of carbon had an impact only on the price of day-ahead contract. A rise in the price of emission permit of 1% results, all things being equal, an increase of 0:02% of the price of German day-ahead electricity contract. The elasticity of the price of electricity relatively to the price of gas is higher for day-ahead electricity contracts compared to the month-day-ahead contracts. This re‡ects a less important weight of gas price in the cost function of electricity traded through month-ahead contracts compared with day-ahead contracts. This result reinforces the idea that electricity generation is subject to a merit order between
technologies based on variable marginal costs. Also, the price of gas has a greater impact on electricity prices in Germany compared to the same prices in France. This di¤erence in the weight of gas prices in the cost of electricity generation is due to the heterogeneity of the French and German energy mixes, share of gas in French and German energy mixes being respectively of 3% and 10%.
The estimates of the conditional variance equations over the whole period argue that electricity price volatilities of German and French day-ahead contracts are variable. It is more strong for the French contract compared to the German one. Indeed, the sum of ARCH and GARCH coe¢ cients is higher in France against the German case. The variance of electricity price around its fundamentals, and in particular the price of carbon dioxide, is higher in France than in Germany. Hence, the greater stability of the price of the German day-ahead electricity contract, around its long run equilibrium path, compared to the price of the French day-ahead one.
The impact of carbon prices on electricity prices, commented yet, represents an average impact over the whole period from July 4, 2005 to June 29, 2007 whereas, the results of stability tests argue that the carbon spot price structural break occurred on December 28, 2006 has a¤ected the long-run equilibrium relationship between the prices of German day-ahead and month-ahead electricity contracts and the French day-ahead contract on the one hand and the prices of gas, coal and emission permit on the other. However, this structural break has not a¤ected the stability of the estimated coe¢ cients of the model (a). We can conclude already that the carbon spot price was not a determinant of the price of electricity of the French month-ahead contract. Indeed, these two series of prices are completely disconnected from each other as the estimated coe¢ cient of the price of carbon in model (a) is not signi…cant and that structural breaks occurred on the carbon spot price series did not a¤ect the estimated coe¢ cients of this model, unlike other models. In addition, the instability of estimated coe¢ cients of the other models, induced by the structural break occurred on December 28th, 2006 on the series of carbon spot price, is an evidence of the close link between the prices of electricity contracts modelled by these models and the price of emission permit. This despite the non-signi…cance in some models of the estimated coe¢ cient of carbon prices on average over the whole period.
Table 1 contains also the estimates results of models over the periods before and after the structural break of December 28, 2006, occurred on the carbon spot price series. These results suggest that the carbon spot price has been a determinant of the price of electricity throughout the period before the convergence towards zero of carbon spot price and therefore during the …rst two years of operation of the EU ETS. Then, the price of electricity was completely disconnected from the carbon spot price in the last year of the pilot phase of the EU ETS. During the period from July 4, 2005 to December 27, 2006, an increase in the price of carbon of 1% resulted respectively, all things being equal, increases by 0; 093%, 0; 067% and 0; 022% of prices of German and French day-ahead electricity contracts and German month-ahead contract. The elasticities of the prices of day-ahead electricity contracts compared to gas prices were higher during this period compared with the whole period. The price of coal, however, has not been a determinant of the price
of any electricity contract. During the period from December 28, 2006 to June 29, 2007, electricity prices of the various contracts were completely disconnected from the spot price of carbon. During this period the price of gas was not a determinant of electricity prices of the various contracts and the price of coal has been without e¤ect on them. This re‡ects distortion in long-run equilibrium relationships between the prices of electricity of the three contracts and their determinants. The analysis of selecting models criteria con…rm this result. The structural break of carbon spot price occurred on December 28, 2006 distorted the entire relationship between the price of the electricity and gas, coal and carbon prices but, not only the relationship between the price of electricity and the price of carbon. This may be evidence of a change in the merit order between technologies of electricity generation caused by the structural break in the series of carbon spot price. This also proves that the European market for emission allowances had an impact on the sector of power generation in both countries even if it was not of the same magnitude.
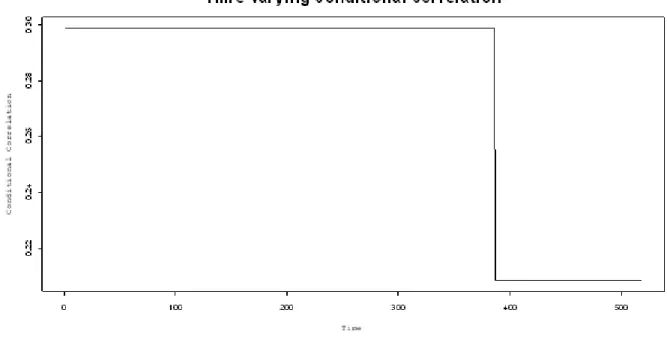
Figure 7 presents the dynamic of the conditional correlation between the prices of day-ahead electricity contracts in France and Germany. This correlation was positive and highly signi…cant. It has been stable around 0,3 during the period before the structural break occurring in the series of the spot price of carbon in December 2006. Then it dropped signi…cantly by almost 30%, following the convergence toward zero of the carbon spot price (Figure 8), reaching a stable value of about 0,2. The stability of the conditional correlation over each of the sub periods is due to the extreme values of estimated coe¢ cients of the model DCCE(1,1). In fact, over each sub period, b1 ' 0 and b2 ' 1, which implies Qt ' Qt 1 and therefore:
0 @ 1 12t 21t 1 1 A ' 0 @ 1 12t 1 21t 1 1 1
A. This result is con…rmed by a comparison test between a DCC model and a Constant Conditional Correlation (Nakatani and Teräsvirta, 2009; Bauwens et al., 2006) CCC model. Electricity prices in Germany and France were much more correlated during the …rst two years of operation of the EU ETS than over the period that followed. The highest correlation has coincided with the period during which the electricity producers had been most constrained by the EU ETS. So, in a context where the debate on the possible manipulation of the electricity wholesale prices in France by the historical producer is still relevant today11, it seems reasonable to expect that the wholesale price of electricity in France are partially aligned with those of Germany12. Indeed, a positive and signi…cant correlation between German and French electricity prices, even though the price of carbon was not signi…cant, corroborates the idea that the French electricity producers take advantage of the French energy mix in terms of production costs. During the …rst two years of operating of the EU ETS, the carbon market was allowed French electricity producers to pull more pro…ts from the composition of their productive parks. This can be explained by the
1 1This debate has been fueled by recent suspicions that a¤ect electricity producers in France. Indeed, in a recent press
release dated from March 11th, 2009, the European Commission suspects an illegal conduct of the French historical producer of electricity. The suspected illegal conduct may include actions to raise prices on the French wholesale electricity market.
1 2As highlighted by Glachant (2007), if one cannot …nd obvious sources of price manipulation in France, one can assume that
the French historical and dominant electricity producer leaves the setting wholesale prices in France to the competitive fringe. These competitors are building gas power plants, this means that opening the market get rid of the economic e¤ects of the French energy mix.
stronger correlation between French and German electricity prices during the same period.
Figure 7: Conditional correlation of French and German electricity prices of day-ahead contracts
Figure 8: Log carbon Spot price series
Finally, the comparative study of the impact of the introduction of the EU ETS on the sectors of electricity generation of both countries will be comparing the elasticity of electricity price compared to the
price of carbon for each type of electricity contract. Regarding day-ahead electricity contracts, we note that during the …rst sub-period, the elasticity of electricity price compared to the price of carbon is higher in Germany than in France. For the month-ahead electricity contracts, we …nd that the price of carbon is not a determinant of the price of electricity in France while the price of carbon has been a determinant of electricity price in Germany during the …rst two years of the EU ETS. We conclude that the German electricity producers have been more undergo the carbon constraint than their French counterparts. This is largely explained by the di¤erences in composition of the energy mixes of the two countries. This …nding is supported by the biggest stability of the price of German day-ahead electricity contract around its path of long-run equilibrium during the …rst two years of operation of the EU ETS, compared to the price of the French day-ahead electricity contract. Indeed, during this period, comparing the sum of the coe¢ cients of ARCH and GARCH e¤ects of each model representing these prices shows that a deviation of the price of day-ahead electricity contract from its equilibrium path following, all things being equal, an overestimation or underestimation of the price of carbon by the electricity producers, the return to equilibrium is faster in Germany than in France.
6
Conclusion
We modelled and estimated, for di¤erent European countries, the relationship between electricity prices, the prices of primary energies used in electricity generation and the price of carbon dioxide emission permit. This enabled us to re‡ect the heterogeneity of responses in the sectors of electricity generation to carbon constraint and to evaluate the e¤ectiveness of the EU ETS taking into account this heterogeneity. We have shown that the impact of carbon constraint on the sectors of electricity generation, during the pilot phase of the EU ETS, depended on the energy mix of the country. During this period, this impact has experienced two phases. First, a phase including the …rst two years of the EU ETS during which electricity producers have included the cost of carbon in their production cost function, then a second phase during which the carbon constraint has no more weighed on the decisions of producers of electricity. However, producers in countries using predominantly fossil fuels, very carbon emitters, have more undergone carbon coercion and thus more integrated the price of emission permits in their cost function of electricity generation. The Conditional correlation between electricity prices of day-ahead contracts in France and Germany has dropped by 30% between the two sub periods. This drop was due to the collapse of the price of carbon and its convergence towards zero. Hence, the EU ETS has increased the market power of the historical French electricity producer and has greatly contributed to the partial alignment of the wholesale price of electricity in France with those of Germany. Throughout the whole …rst phase of the market (2005-2007), the e¢ ciency of the European market for emission allowances has not been up to compel electricity producers as a whole, to reduce their emissions and invest in cleaner technologies. However, this market was a good step towards achieving the objectives that have committed European countries under the Kyoto Protocol. The ine¢ ciency
of the EU ETS was mainly due to the largesse granted by the national authorities of European countries for their power generation sectors which are considered as strategic on the one hand, and certain mechanisms de…ning devices of the EU ETS, on the other. Thus, excess allocations and the impossibility of “banking" on the following periods have made the horizon of the carbon market bounded and eventually prevented the creation of a scarcity that is the essence of the carbon coercion. This has greatly contributed to the convergence towards zero of carbon spot price at the end of the …rst phase of the EU ETS, loosening the carbon coercion that had carried on producers of electricity during the …rst two years of operation of the market.
A
APPENDICES
A.1
Non parametric estimates of electricity price and temperature
relation-ships
Non parametric regression of German electricity price on temperature
A.2
The test by Clemente Montanès and Reyes
The Clemente Montanès and Reyes (1998) test with double change in the mean (1998) using the AO proce-dure and implemented to a series y is based on the estimation of the following equation:
yt= + 1DU1t+ 2DU2t+yet
Where DUmt= 1 for t Tbmand 0 otherwise, for m = 1; 2. Tb1 et Tb2are the dates of structural breaks
and will be searched by the scan method. The noise of this equation becomes the dependent variable on the equation to estimate follows:
e yt= k X i=1 !1iDTb1;t i+ k X i=1 !2iDTb2;t i+ ygt 1+ k X i=1 i ygt i+ et
Where DTbm;t = 1 for t = Tbm+ 1 and 0 otherwise for m = 1; 2. This equation is estimated for each
pair (Tb1; Tb2) in search of the least t-statistic of the unit root hypothesis that is then compared with values
tabulated by the authors. In addition, the same test applied to the series ytusing the IO procedure is based
on the estimation of the following equation:
yt= + 1DU1t+ 2DU2t+ '1DTb1;t+ '2DTb2;t+ yt 1+ k
X
i=1
i yt i+ et
A.3
Two-step estimation of DCC
Emodels
The estimation of parameters of multivariate models is based on the method of maximum likelihood. So with Gaussian residuals, the likelihood function is:
LT = T X t=1 log f (ytj ; ; It 1) Where f (ytj ; ; It 1) = jHtj 1 2g(H 1 2
t (yt t)) the density function of ytgiven the vector of parameters
and . We assume that (yt t) N(0; IN). Thus, the loglikelihood function is:
LT( ) = 1 2 T X t=1 log jHtj + (yt t)0Ht 1(yt t)
The Gaussian likelihood provides a consistent quasi-likelihood estimator even if the true density is not Gaussian. In the case of a DCC model the loglikelihood is composed of two parts. The …rst part depends on the parameters of volatility and the second part depends on the parameters of the conditional correlations knowing the volatility parameters. So, with Ht= DtRtDtwe obtain:
LT( ) = 1 2 T X t=1 log jDtRtDtj + u0tRt1ut
where ut = Dt1(yt t) and u0tRt1ut = (yt t)0Dt1Rt1Dt1(yt t). With these notations, the
loglikelihood is: LT( ) = 1 2 T X t=1 log jDtRtDtj + u0tRt1ut LT( ) = 1 2 T X t=1 [2 log jDtj + u0tut] | {z } 1 2 T X t=1 log jRtj + u0tR 1 t ut u0tut | {z } Q1LT( 1) Q2LT( 1; 2)
with 1 the parameters of the conditional variance Dt and 2 those of the conditional correlation Rt.
Then the loglikelihood function can be written as follows:
LT( ) = Q1LT( 1) + Q2LT( 1; 2)
( 1; 2) are found in two stages. At the …rst stage we estimate 1= arg max Q1LT( 1) and at the second
stage we estimate 2= arg max Q2LT( 1; 2).
References
[2] Alberola E., Chevallier J., Chèze B., “Price drivers and structural breaks in European carbon prices 2005-2007”, Energy Policy, No. 36, pp. 787-797, 2008.
[3] Benz E., Trück S., “Modeling the price dynamics of CO2emission allowances”, Energy Economics, No.
31, pp. 4-15, 2009.
[4] Bauwens L., Laurent S., Rombouts V. K., “Multivariate GARCH models: A survey”, Journal of Applied Econometrics 21, pp. 79-109, 2006.
[5] Clemente J., Montanès A., Reyes M., “Testing for a unit root in variables with a double change in the mean”, Economics Letters 59, pp. 175-182, 1998.
[6] Derek W. B., Fezzi C., “Interaction of European Carbon Trading and Energy Prices”, Fondazione Eni Enrico Mattei, Working paper 123, 2007.
[7] Engle R.F., “Dynamic Conditional Correlation: A Simple Class of Multivariate Generalized Autore-gressive Conditional Heteroskedasticity Models”, Journal of Business and Economic Statistics 20, pp. 339-350, 2002.
[8] Engle R. F., Granger C. W. J., Rice John, Weiss Andrew, “Semiparametric Estimates of the Relation Between Weather and Electricity Sales”, Journal of the American Statistical Association, Vol. 81, No. 394, pp. 310-320, 1986.
[9] Engle R.F., Sheppard K., “Theoretical and Empirical Properties of Dynamic Conditional Correlation Multivariate GARCH ”, Stern Finance Working Paper Series {FIN}-01-027, New York University Stern School of Business, 2001.
[10] European Commission, MEMO/09/104, March 2009, available at: http://europa.eu/ rapid/ pressRe-leases Action .do?reference=MEMO/09/104&format=HTML&aged=0&language=EN&guiLanguage=fr. [11] Galli A., Armstrong M., “Are day-ahead prices for electricity converging in continental
Eu-rope? An exploratory data approach”, Cerna Paris, Working Paper, February 2005, available at: http://www.cerna.ensmp.fr/Documents/MA-AG-PriceConvergence.pdf.
[12] Galli A., Armstrong M., “Comparing the Spot Prices from Powernext and EEX”, Cerna Paris, Working Paper, May 2003, available at: http://www.cerna.ensmp.fr/Documents/AG-MA-Powernext-EEX.pdf. [13] Glachant J. M., “Insatisfactions françaises sur le marché européen de l’électricité”, ADIS-GRJM
Work-ing Paper, 2007.
[14] Honkatukia J., Mälkönen V., Perrels A., “Impacts Of The European Emission Trade System On Finnish Wholesale Electricity Prices”, Government Institute for Economic Research, Helsinki, Nov. 2006. [15] Kanen J. L. M., “Carbon Trading and Pricing”, Environmental Finance Publication, 2006.
[16] Mansanet-Bataller M., Pardo A., Valor E., “CO2 prices, energy and weather”, The Energy Journal 28 (3), pp. 67-86, 2007.
[17] Nakatani T., and Teräsvirta T., “Testing for Volatility Interactions in the Constant Conditional Corre-lation GARCH Model”, Econometrics Journal, volume 12, pp. 147–163, 2009.
[18] Reinaud J., “CO2 allowances & electricity price interaction: impact on industry’s electricity purchasing strategies in Europe”, IEA information paper, February 2007.
[19] Sijm J.P.M., Chen Y., Bakker S.J.A., Harmsen H., Lise W., “CO2 price dynamics: the implications of EU emissions trading for the price of electricity”, ECN report No. ECN-C–05-081, 2005.
[20] Sijm J.P.M. Chen Y. & al., “CO2 price dynamics: a follow-up analysis of the implications of EU emissions trading for the price of electricity”, ECN report No. ECN-C-06-015, Mars 2006.


![[PDF] Générer des rapports personnalisés avec Excel | Cours Bureautique](data:image/gif;base64,R0lGODlhAQABAIAAAP///wAAACH5BAEAAAAALAAAAAABAAEAAAICRAEAOw==)