HAL Id: hal-03190704
https://hal.inrae.fr/hal-03190704
Submitted on 6 Apr 2021
HAL is a multi-disciplinary open access
archive for the deposit and dissemination of
sci-entific research documents, whether they are
pub-lished or not. The documents may come from
teaching and research institutions in France or
abroad, or from public or private research centers.
L’archive ouverte pluridisciplinaire HAL, est
destinée au dépôt et à la diffusion de documents
scientifiques de niveau recherche, publiés ou non,
émanant des établissements d’enseignement et de
recherche français ou étrangers, des laboratoires
publics ou privés.
Distributed under a Creative Commons Attribution| 4.0 International License
Elise Gay, Jessica Soyer, Nicolas Lapalu, Juliette Linglin, Isabelle Fudal,
Corinne da Silva, Patrick Wincker, Jean-Marc Aury, Corinne Cruaud, Anne
Levrel, et al.
To cite this version:
Elise Gay, Jessica Soyer, Nicolas Lapalu, Juliette Linglin, Isabelle Fudal, et al.. Large-scale
transcrip-tomics to dissect 2 years of the life of a fungal phytopathogen interacting with its host plant. BMC
Biology, BioMed Central, 2021, 19 (1), pp.e041118. �10.1186/s12915-021-00989-3�. �hal-03190704�
R E S E A R C H A R T I C L E
Open Access
Large-scale transcriptomics to dissect
2 years of the life of a fungal
phytopathogen interacting with its host
plant
Elise J. Gay
1, Jessica L. Soyer
1, Nicolas Lapalu
1, Juliette Linglin
1, Isabelle Fudal
1, Corinne Da Silva
2, Patrick Wincker
2,
Jean-Marc Aury
2, Corinne Cruaud
3, Anne Levrel
4, Jocelyne Lemoine
4, Regine Delourme
4, Thierry Rouxel
1and
Marie-Hélène Balesdent
1*Abstract
Background: The fungus Leptosphaeria maculans has an exceptionally long and complex relationship with its host plant, Brassica napus, during which it switches between different lifestyles, including asymptomatic, biotrophic, necrotrophic, and saprotrophic stages. The fungus is also exemplary of“two-speed” genome organisms in the genome of which gene-rich and repeat-rich regions alternate. Except for a few stages of plant infection under controlled conditions, nothing is known about the genes mobilized by the fungus throughout its life cycle, which may last several years in the field.
Results: We performed RNA-seq on samples corresponding to all stages of the interaction of L. maculans with its host plant, either alive or dead (stem residues after harvest) in controlled conditions or in field experiments under natural inoculum pressure, over periods of time ranging from a few days to months or years. A total of 102 biological samples corresponding to 37 sets of conditions were analyzed. We show here that about 9% of the genes of this fungus are highly expressed during its interactions with its host plant. These genes are distributed into eight well-defined expression clusters, corresponding to specific infection lifestyles or to tissue-specific genes. All expression clusters are enriched in effector genes, and one cluster is specific to the saprophytic lifestyle on plant residues. One cluster, including genes known to be involved in the first phase of asymptomatic fungal growth in leaves, is re-used at each asymptomatic growth stage, regardless of the type of organ infected. The expression of the genes of this cluster is repeatedly turned on and off during infection. Whatever their expression profile, the genes of these clusters are enriched in heterochromatin regions associated with H3K9me3 or H3K27me3 repressive marks. These findings provide support for the hypothesis that part of the fungal genes involved in niche adaptation is located in heterochromatic regions of the genome, conferring an extreme plasticity of expression.
(Continued on next page)
© The Author(s). 2021 Open Access This article is licensed under a Creative Commons Attribution 4.0 International License, which permits use, sharing, adaptation, distribution and reproduction in any medium or format, as long as you give appropriate credit to the original author(s) and the source, provide a link to the Creative Commons licence, and indicate if changes were made. The images or other third party material in this article are included in the article's Creative Commons licence, unless indicated otherwise in a credit line to the material. If material is not included in the article's Creative Commons licence and your intended use is not permitted by statutory regulation or exceeds the permitted use, you will need to obtain permission directly from the copyright holder. To view a copy of this licence, visithttp://creativecommons.org/licenses/by/4.0/. The Creative Commons Public Domain Dedication waiver (http://creativecommons.org/publicdomain/zero/1.0/) applies to the data made available in this article, unless otherwise stated in a credit line to the data.
* Correspondence:marie-helene.balesdent@inrae.fr
1Université Paris-Saclay, INRAE, AgroParisTech, UMR BIOGER, 78850
Thiverval-Grignon, France
(Continued from previous page)
Conclusion: This work opens up new avenues for plant disease control, by identifying stage-specific effectors that could be used as targets for the identification of novel durable disease resistance genes, or for the in-depth analysis of chromatin remodeling during plant infection, which could be manipulated to interfere with the global
expression of effector genes at crucial stages of plant infection.
Keywords: Leptosphaeria maculans, Brassica napus, Fungal biology, Transcriptomics, Pathogenesis, Effectors, Expression waves, Chromatin regulation, Lifestyle transitions
Background
Fungi play a vital role in global ecosystems. They have highly complex life cycles that often remain poorly understood, due to the multiplicity of fungal species and their behavior. Plant-associated fungi (endophytes, sym-bionts and phytopathogens) contribute to this complex-ity and diverscomplex-ity of behavior, as they may have beneficial, neutral or detrimental interactions with their hosts; some are of paramount importance in favoring the growth of plants or their adaptation to the environment, whereas others are highly damaging pathogens of culti-vated plants [1].
Many fungal pathogens of annual crops display con-trasting infection strategies (e.g., the biotrophs Blumeria graminisand Ustilago maydis, the hemibiotroph
Colleto-trichum higginsianum or the necrotroph Botrytis
cinerea), with reproducible short cycles of colonization/ sporulation, lasting from hours to weeks, on plant leaves. For such species, high-throughput RNA sequencing has made it possible to describe the stage-specific expression of genes during the few days or weeks over which the in-fection process occurs, under laboratory conditions. Such studies have identified concerted waves of patho-genicity gene expression during fungal infection [2, 3], sets of genes involved in the switch from asymptomatic to necrotrophic growth in the hemibiotrophic fungus Zymoseptoria tritici [4, 5], or four waves of expression for genes encoding putative effectors in C. higginsianum [6]. Short life cycles, of no more than a few weeks on the host, are compatible with the description of bio-logical and phytopathogenic features in experiments per-formed in controlled conditions.
In many other models, including symbionts and endo-phytes, the fungi spend much longer interacting with their host and make use of different pathogenic/symbi-otic developmental programs to adapt to different life-styles during host colonization (this is the case in Leptosphaeria maculans, the fungus studied here), differ-ent host tissues (e.g., U. maydis [7];), or different plant species (e.g., rust species with complex pathogenic cycles including two alternate host species [8];). For these spe-cies, RNA-Seq approaches also seem to be the approach of choice for dissecting the entire fungal life cycle and describing the biology of the fungus, together with the
sets of genes involved and their regulation. However, the use of RNA-Seq to describe the fungal life cycle is chal-lenging and technically demanding. Even for fungal spe-cies that can be grown in axenic media and for which miniaturized pathogenicity assays have been developed, parts of the pathogenicity cycle remain inaccessible and cannot be reproduced in laboratory conditions. It is, therefore, essential to sample and monitor isolates from the wild. The second challenge is developing a suffi-ciently comprehensive a priori knowledge of all the rele-vant stages of the fungal life cycle, and a means of sampling all of these stages for analysis. The third chal-lenge is the generation of sufficient amounts of high-quality samples (often corresponding to minute amounts of fungal organisms in large amounts of plant material, or samples obtained blind, without knowing whether the fungus is present in the plant at the time of sampling) for RNA-Seq, to ensure the generation of enough reads for appropriate statistical analyses. The fourth challenge is coping with complex field samples, containing not only the phytopathogen and the host plant, but also many other fungal or bacterial species, necessitating a careful evaluation of the specificity of RNA-Seq mapping before analysis. The final challenge is coping with field samples subject to natural infection in variable environ-mental conditions, potentially resulting in a high level of heterogeneity in terms of the presence of the fungus and its developmental stage within the tissues, and attaining a biologically relevant continuity when monthly samples are obtained over a whole growing season.
L. maculans, a pathogen of rapeseed (Brassica napus), has an exceptionally complex life cycle compared to most other fungal phytopathogens attacking annual plants. It can infect different plant tissues, undergo mul-tiple switches from biotrophy to necrotrophy during a lengthy lifespan in plant tissues, and can also live as a saprophyte on plant residues. The epidemiological cycle of L. maculans is well described [9, 10]. It begins with the hemibiotrophic colonization of young leaves by spores generated by sexual reproduction (ascospores) in early autumn (October–November) in Europe. The fun-gus first colonizes the leaf tissues as a biotroph, for a few days or weeks, depending on the climatic conditions, without causing any symptoms. It then induces the
development of necrotrophic leaf lesions in which its asexual spores (conidia) are produced. The fungus then migrates, without causing symptoms, from the petiole to the stem, where it lives in the plant tissues, as an endo-phyte, for several months. Finally, at the end of the growing season (May to July in Europe), it switches back to necrotrophic behavior, inducing the formation of a damaging stem canker that may result in plant lodging. Having completed all these stages of infection on living plant tissues, L. maculans then switches to a sapro-trophic lifestyle, living on crop residues for up to 3 years. It develops structures for sexual reproduction to create the new inoculum (ascospores) for subsequent seasons on these residues. Due to its length and complexity, only a limited part of the life cycle of L. maculans is amen-able to laboratory experiments. Most of the RNA-Seq-based time-course experiments published to date were performed during the first 2 weeks of infection, on coty-ledons in controlled conditions [11–13], or in one set of stem infection conditions in controlled conditions [14].
In many models analyzing primary leaf infection, RNA-Seq approaches have highlighted the importance of genes encoding small secreted proteins (SSPs), acting as effectors, which often compromise plant defense re-sponses [15]. In L. maculans, SSP genes are strongly expressed during cotyledon infection in controlled con-ditions [11–13], whereas another set of putative effectors and a toxin encoded by a secondary metabolite gene cluster, sirodesmin PL, are recruited during stem infec-tion [14,16]. To date, 20 effector genes have been char-acterized in L. maculans. These genes include nine “early” effector genes (AvrLm genes) [17–25] located in AT-rich regions of the fungal genome enriched in trans-posable elements (TEs) [26] and eleven “late” putative effector genes, with molecular features similar to those of “early” effectors, expressed during stem colonization [14]. Unlike “early” effectors, these genes are located in gene-rich regions of the genome.
In addition to effector genes, the possible role in viru-lence of dozens of genes of different functional categor-ies has been studied in L. maculans. These genes encode proteins involved in the biosynthesis of two secondary metabolites: abscisic acid (ABA) [27] and the toxin siro-desmin [16], and genes disrupted or silenced in L. macu-lans, 11 of which have been implicated in fungal virulence [28–36]. Again, all these studies were per-formed in controlled conditions, generally with minia-turized pathogenicity tests on cotyledons, and nothing is known about the involvement of the candidate genes, or of other pathogenicity genes, in other parts of the fungal life cycle.
L. maculanshas a well-defined bipartite genome con-sisting of gene-rich, GC-equilibrated regions and large AT-rich regions enriched in transposable elements (TE)
but depleted of genes. The AT-rich regions account for 34.8% of the genome and are enriched in H3K9me3 (tri-methylation of the lysine 9 residue of histone H3) marks, typical of constitutive heterochromatin in other species, whereas the GC-rich regions are enriched in H3K4me2 (dimethylation of the lysine 4 residue of histone H3) marks, typical of euchromatin [37, 38]. In addition, species-specific genes and genes silenced during axenic
growth display an enrichment in H3K9me3 and
H3K27me3 (trimethylation of the lysine 27 residue of
histone H3 [38]) heterochromatin modifications. The
chromatin-based regulation of the expression of “early” effector genes has been experimentally validated for a few AvrLm genes in this model [37].
We hypothesized here that, with the use of careful ex-perimental and sampling procedures, it should be pos-sible to use a large-scale transcriptomic approach to decipher the whole of the complex life cycle of L. macu-lans in interaction with its host, in both controlled and field conditions, and over time scales ranging from weeks (controlled condition experiments) to months or years (follow-up of plant infection on leaves and stems for a whole growing season, survival of L. maculans on residues remaining on the soil for 1 year). Our objective was, thus, to use RNA-Seq data to describe the complete fungal life cycle and pathogenicity cycle and to identify the genes and functions involved in each stage. We found that about 9% of the genes of the fungus were expressed specifically during host-fungus interactions. A clustering of all the genes involved in the host-fungus interaction led to the detection of eight major waves of gene expression that could be consistently related to the consecutive stages of the L. maculans life cycle, to tissue-specific expression, or corresponded to genes recycled for all similar lifestyles at different stages of the fungal life cycle. The regulation of expression was strongly associated with the hosting of genes of the eight waves in heterochromatin landscapes, and heterochro-matin dynamics is thought to be instrumental in allow-ing the recyclallow-ing of expression for genes from the same wave during all stages of fungal biotrophy.
Results
Biological and RNA samples representing all aspects of the life cycle of the fungus in interaction with its host
The RNA-Seq experiment was designed to generate samples corresponding to all stages of the interaction of L. maculans with its host plant, either alive (Fig. 1e–c)
or dead (stem residues after harvest; Fig. 1d), in con-trolled conditions or in field experiments under natural inoculum pressure, over periods of time ranging from a few days to months or years (Fig. 1; For a detailed de-scription of biological samples, see the “Methods”
grown in axenic conditions promoting a particular fun-gal developmental stage (mycelium growth, pycnidium differentiation, pseudothecium differentiation, resting conidia, conidial germination) (Fig. 1e), to distinguish between these fundamental biological processes and those specific to interaction with the plant. In total, 102 biological samples, corresponding to 37 different sets of conditions, were subjected to RNA-Seq. Several quality control checks and parameter optimization were re-quired before this heterogeneous dataset could be sub-jected to statistical analyses. In fine, 32 sets of conditions were retained for statistical analyses, whereas five sets of conditions were excluded because too few fungal reads were available (Additional files 1, 2 and 3: S1 Text, S1 and S2 Tables).
Quality control analyses highlight the consistency of the RNA-Seq dataset
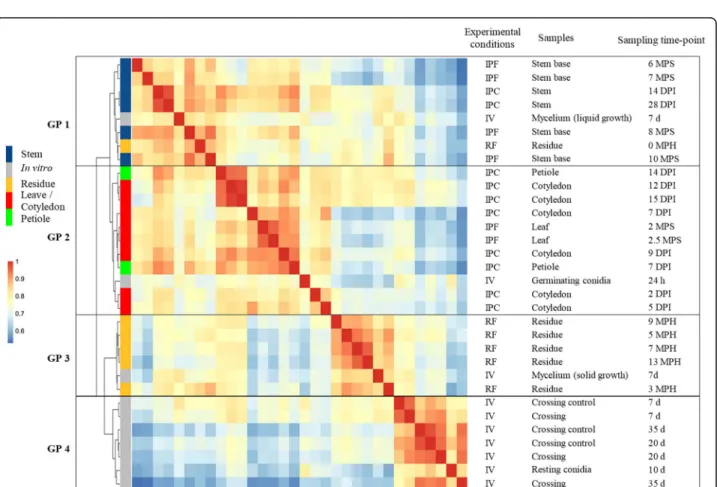
Clustering based on pairwise Pearson’s correlation ana-lyses of the 32 sets of conditions identified four groups of clustered conditions (Fig. 2). In each of these four groups, principal component analysis (PCA) showed a low level of variation between biological replicates, ex-cept for a few field samples and in vitro crosses
(Add-itional files 4 and 5: S2 Text, S1A-D Fig). The four
clusters (Fig. 2) corresponded to the following: (i) the early infection stage on cotyledons and leaves and colonization of the petiole (group 2), (ii) the late in-fection stage on stems (group 1), (iii) the saprophytic lifestyle (group 3), in controlled conditions or in the field, and (iv) all the in vitro growth conditions pro-moting the differentiation of pseudothecia and/or pyc-nidia (group 4).
Within each group, lifestyle provided a second level of sample discrimination, with samples from biotrophic or endophytic stages distinguished from necrotrophic-stage samples (Fig. 2). For example, within group 2, samples displaying necrotrophic behavior on petioles 14 days post infection (DPI) were more closely related to the necrotrophic samples collected from cotyledons 12 and 15 DPI than to the corresponding biotrophic samples (petioles 7 DPI) (Fig. 2). Similarly, in group 1, the resi-dues collected immediately after harvest grouped with the last samples collected from the stem base, even though the residues did not originate from the same growing season, or from the same rapeseed variety, sug-gesting that the transition from stem necrosis to sapro-phytic life takes place after harvest (Fig.2).
Some axenic growth conditions were also grouped with some in planta conditions. Within group 2, germin-ating conidia grouped with the earliest samples collected from cotyledons, consistent with the use of conidia to inoculate plant tissues in controlled conditions (Fig. 2). Samples grown in axenic culture on solid V8 medium
under conditions promoting mycelial growth over sporu-lation clustered within group 3, indicating that mycelial growth is a major component of the saprophytic lifestyle in the wild. By contrast, mycelium grown in static liquid medium grouped with all conditions in which the fungus colonized stem tissues, possibly reflecting growth under low-oxygen conditions in plant vessels or intercellular spaces.
Analytical strategy for identifying genes involved in pathogen-plant interactions
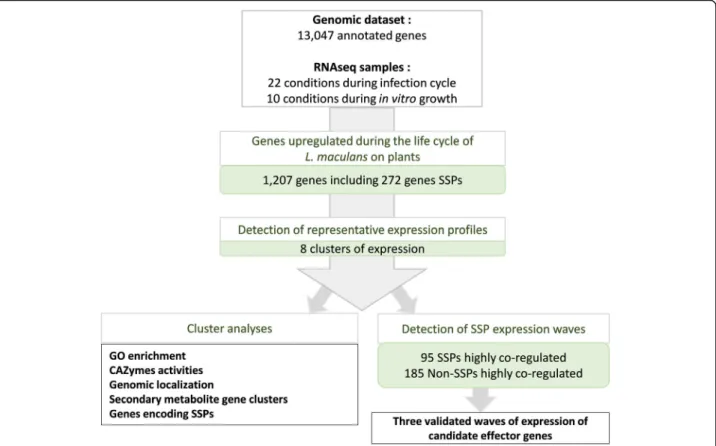
For the identification of fungal genes specifically in-volved in at least one stage of the pathogen-plant inter-action, we used the 10 sets of in vitro growth conditions as 10 sets of control conditions, to exclude all genes in-volved in basic fungal metabolism or life traits other than those associated with plant infection (Fig. 3). We choose very stringent criteria (LogFC > 4; p value < 0.01) to focus on genes specifically and robustly overexpressed in planta relative to in vitro control conditions. We ana-lyzed the expression patterns of these genes, their func-tional annotation, their genomic localization, and their location with respect to histone modifications during axenic growth. We then focused on genes encoding SSPs from the new repertoire generated in this study (Add-itional file 6: S3 Text). Finally, the expression profiles of co-expressed SSP genes were used as a template for the identification of waves of genes displaying a high level of coregulation (R-squared > 0.80) and exemplifying spe-cific pathogenic strategies (Fig.3).
Genes overexpressed during interaction with the plant define eight biologically relevant expression clusters
Relative to axenic growth conditions, 1207 genes were found to be overexpressed in at least one set of condi-tions in planta; thus, 9.2% of L. maculans genes are spe-cifically mobilized during the interaction of the fungus with its host, alive or dead. Eight expression profiles were identified, referred to hereafter as clusters 1 to 8, defining a complex landscape of expression profiles
(Fig. 4). We analyzed the enrichment of each cluster
in GO terms, focusing on CAZymes (carbohydrate-ac-tive enzymes) associated with degradation activities, to identify the functions and pathways associated with each expression profile (Additional files 7, 8, 9 and
10: S2-S5 Fig).
Clusters 1, 2, and 3 included genes expressed sequen-tially during cotyledon infection and were representative of three consecutive stages occurring during the 2-week period of cotyledon colonization by L. maculans. Cluster 1 encompassed 97 genes highly expressed at the first stages of cotyledon infection, when the conidia germin-ate and the hyphae penetrgermin-ate the wounded plant tissues (2–5 DPI). It was enriched in GO terms corresponding
(See figure on previous page.)
Fig. 1 Conditions and samples used for the RNA-Seq study of the Leptosphaeria maculans life cycle. Time-course studies are represented by an arrow and the sampling time points are indicated. a RNA was extracted from cotyledons infected with ascospores 1 or 2 days post inoculation (DPI). Another time-course study was conducted by inoculation with conidia, with RNA extraction at six time points, from 2 to 15 DPI. Young leaves from naturally infected fields were sampled 2 or 2.5 months post sowing (MPS). b Petiole colonization was achieved on petioles inoculated in controlled conditions, with RNA extraction at 7 and 14 DPI. c Stem colonization samples were obtained in controlled conditions, at 14 and 28 DPI. Stem base samples from naturally infected fields were collected and used for RNA extraction every 2 to 3 months over an entire growing season. d Leftover stem residues were sampled every 2 to 3 months for 1 year after harvest (dates expressed in months post harvest, MPH). e We used 10 sets of in vitro growth conditions, based on two different media (liquid or solid) and corresponding to different physiological states (mycelium, sporulation, germinating, and resting conidia, in vitro crossing conditions). The samples highlighted in bold red did not provide enough fungal RNA-Seq reads for statistical analysis. f Schematic representation of the colonization stages of oilseed rape by L. maculans. The plants are sown in mid-August/early September. During the early infection stage in autumn, the ascospores, generated on crop residues, produce hyphae that colonize the cotyledons/young leaves. Then, the fungus migrates asymptomatically in the petioles and the stems during the winter months. In early summer, L. maculans causes stem cankers. Then, L. maculans survives on crop residues and produces a new inoculum
Fig. 2 Hierarchical clustering of Leptosphaeria maculans gene expression in 32 conditions representing the fungal life cycle. Each gene with an FPKM count > 2 in at least one set of conditions was retained for the correlation analysis. A pairwise Pearson’s correlation analysis was performed between the 32 sets of conditions on Log2(FPKM+ 1) values. The resulting Pearson’s correlation matrix was subjected to hierarchical clustering
(represented by the tree) with the ward.D2 method. The Pearson’s correlation results are shown on a color scale. Four groups of clustered samples were identified (GP1 to GP4). The experimental conditions are indicated as IPF, in planta field conditions; IPC, in planta controlled conditions; IV, in vitro conditions and RF, residues in field conditions. The infected plant tissues collected or the conditions under which the in vitro samples were obtained are detailed, together with the corresponding time points for sampling (DPI, days post inoculation; MPS, months post sowing; MPH, months post harvest; d, days; h, hours)
to carbohydrate metabolic processes (p = 1 × 10− 2) and catalytic activities (p = 1 × 10− 3), including peptidase and hydrolase activities (all p≤ 1 × 10− 2). An enrichment in cutinase activity (p = 1 × 10− 2), specific to this cluster, was also observed (Additional files7,8and10: S2-S3, S5 Figs).
The 148 genes of cluster 2 displayed peaks of expres-sion during all stages of asymptomatic growth within plant tissues (cotyledon colonization 5–9 DPI, first stage
of petiole colonization, first two dates of stem
colonization in the field). The genes of this cluster were annotated with few GO terms or functions, but were strongly enriched in SSP genes (p = 2 × 10− 16; Add-itional file 8: S3 Fig). Cluster 3 encompassed 87 genes highly expressed during the necrotrophic stage on both cotyledons (9–15 DPI) and petioles, but not during the necrotrophic stem canker stage in the field. This cluster was enriched in carboxylic ester hydrolase activities (p = 3 × 10− 3) suggesting a role in degradation activities spe-cifically targeting the plant cell wall.
Cluster 4 encompassed 238 genes highly expressed during the shift from biotrophy to necrotrophy in cotyledons (7–9 DPI) and in stem bases infected in the field (7–8 months post sowing, “MPS”). This cluster displayed the strongest enrichment in catalytic processes (p = 2 × 10− 10) and hydro-lase activities (p = 1 × 10− 12), and a specific enrichment in proteolysis processes (p = 2 × 10− 2; Additional file8: S3 Fig). It also displayed the largest number of CAZymes (63 genes; Additional file 10: S5 Fig) targeting different substrates, mostly plant cell-wall components, such as pectin, arabin-ose, and galactan (Additional file10: S5 Fig).
Two clusters (cluster 5 and 6) displayed an increase in expression late in stem infection, but differed in terms of the timing of expression and the functions involved. Cluster 5 contained 128 genes highly expressed during the asymptomatic colonization of stems in the field (at 7–8 MPS) and on residues immediately after harvest. It was enriched in catalytic activities (p = 1 × 10− 3), mostly linked to saccharide degradation, suggesting involvement in activities relating to the uptake of sugar resources
Fig. 3 Pipeline used to describe Leptosphaeria maculans genes overexpressed in at least one condition in planta. We found that 1207 of the 13,047 annotated genes were overexpressed in at least one of the 22 sets of conditions in planta relative to the 10 sets of in vitro conditions. These genes included 272 predicted to encode small secreted proteins (SSPs). We analyzed the set of 1207 genes to identify the major expression profiles by gene expression clustering. We defined eight expression clusters (clusters 1 to 8). For each cluster, we analyzed expression patterns, functional enrichment, and the genomic localization of the genes. For the specific detection of highly coregulated waves of SSPs, we performed a linear regression analysis of the mean expression value for each SSP subset present in each cluster against the expression of all 13,047 genes. This analysis identified 95 SSP genes and 185 non-SSP genes as highly coregulated genes
(carbon-oxygen lyase activity acting on polysaccharides; hydrolase activity; cellulose binding; Additional file 8: S3 Fig). Cluster 6 contained 141 genes highly expressed dur-ing colonization of the stem base in the field, with max-imal expression at 10 MPS, corresponding to the time at which stem canker develops. This cluster was enriched in catalytic activities (p = 2 × 10− 4) but was also linked to co-factor binding (p = 3 × 10− 6), monooxygenase (p = 1 × 10− 2), and oxidoreduction activities (p = 5 × 10− 5), in-volved in detoxification processes (Additional files8 and
9: S3 and S4 Figs). The higher proportion of xylanase genes in cluster 6 than in cluster 5 (Additional file10: S5 Fig) suggests a change in the mode of nutrition during the necrotrophic stage on stems.
Finally, clusters 7 and 8 were specific to saprophytic be-havior on stem residues. The 198 genes in cluster 7 dis-played an increase in expression from the last sampling on necrotic stems until the last sampling on stem residues 1 year after harvest. This cluster was enriched in genes re-lating to monooxygenase activities (p = 1 × 10− 4) and con-tained the largest number of genes encoding LPMOs (lytic polysaccharide monooxygenases), cellulases, and xylanases. Cluster 8 encompassed 170 genes specifically expressed during all stages occurring on senescent or dead plant tis-sue, with the highest levels of expression during saprophytic growth on residues. It was also enriched in oxidoreductase processes (p = 1 × 10− 3), in response to oxidative stresses and oxidant detoxification associated with an enrichment in catalase (p = 1 × 10− 3) and peroxidase (p = 3 × 10− 3).
The different clusters of gene expression thus can be designated as follows: “Penetration and establishment” (cluster 1), “Biotrophy” (cluster 2), “Cotyledon and peti-ole necrotrophy” (cluster 3), “Biotrophy to necrotrophy transition” (cluster 4), “Stem biotrophy” (cluster 5), “Stem necrotrophy” (cluster 6), “Stem canker and sapro-phytism” (cluster 7), and “Saprosapro-phytism” (cluster 8).
Contribution of candidate pathogenicity genes to fungal life in interaction with the plant
Genes involved in fungal pathogenicity in other fungal species
We wondered whether the 9.2% of infection-specific genes were conserved in other phytopathogenic fungi
and if we could relate their phase-specific expression pattern with the lifestyle of these fungi. Of the corre-sponding 1207 proteins, 235 (19.5%) were specific to L. maculans. Of the remaining 979 proteins sharing hom-ologies with proteins predicted in other fungal species (Additional file 11: S6 Fig), 316 (32.2%) had matches with hypothetical or predicted proteins, while the remaining ones matched with proteins with an anno-tated function or domain. The cluster 2 comprised the lowest proportion of proteins with orthologs in other species (64.84%) compared to other clusters, likely due to its high content of species-specific effectors (Add-itional file11: S6 Fig). Globally, most hits were with re-lated phytopathogenic Dothideomycete species (genera Bipolaris, Alternaria, Pyrenophora, Parastagonospora, etc.), for which only limited RNA-Seq resources are available, preventing us from comparing the clusters of expression of L. maculans with theirs. In contrast, a non-negligible number of hits were found with spe-cies of the Colletotrichum or Fusarium genera, and to a lesser extent with Z. tritici and B. cinerea, species with either an hemibiotrophic or a necrotrophic pathogenicity behavior, for which extensive RNA-Seq data are available. For these species, we identified a very low number of homologous annotated proteins
present in the eight expression profiles
(Add-itional file 12: S7 Fig). The cluster 4 contained the highest number of homologous proteins annotated in
Fusarium and Colletotrichum species. They
corre-sponded to catalytic activities such as protease and polysaccharide degradation enzymes. These results suggest that the degrading enzymes involved in the transition from biotrophy to necrotrophy are con-served among the hemibiotrophic fungi.
Several genes previously shown to be involved in fungal pathogenicity were found in one of the eight expression clusters and were mostly associated with biotrophic stages of the interaction. One RALF (rapid alkalinization factor) gene known to favor fun-gal infection [39] was identified in cluster 1 (Lmb_ jn3_05329). Two of the six salicylate hydroxylase genes, known to compromise plant salicylic acid sig-naling in other models [40], were found in clusters 1
(See figure on previous page.)
Fig. 4 Heatmap obtained by clustering the 1207 Leptosphaeria maculans genes upregulated in planta. For each set of conditions, we calculated the mean FPKM value of the replicates, which we then subjected to Log2transformation and scaling. The self-organizing map method was used
on the Log2(FPKM+ 1) values, to define eight expression clusters (clusters 1 to 8) for the 1207 genes. The level of expression ranged from 4
(yellow) to− 4 (green). Genes located in AT-rich regions (AT) or encoding small secreted proteins (SSPs) are indicated by red and black lines, respectively, on the left. The conditions are described in the legend to the x-axis of the heatmap. Three sample features are described: (i) the experimental conditions: IPF, in planta field conditions; IPC, in planta controlled conditions; RF, residues in field conditions; (ii) the type of plant tissue sampled; and (iii) the sampling time points (DPI, days post inoculation; MPS, months post sowing; MPH, months post harvest. The ten sets of in vitro conditions are ordered as follows: conidia (a. non-germinating, b. germinating); incompatible mating conditions (c. JN2 x JN2 7 days (d), d. JN2 x JN2 20d, e. JN2 x JN2 35d); compatible mating conditions (f. JN2 x Nz-T4 7d, g. JN2 x Nzt4 20d, h. JN2 x Nz-T4 35d); mycelial growth (i. in liquid medium, j. on solid medium)
(Lmb_jn3_12582) and 2 (Lmb_jn3_11892). Three of the four LysM-domain containing genes of the gen-ome, known to protect chitin from degradation by
plant enzymes or to scavenge chitin oligomers [41],
were found in clusters 2 (two genes, Lmb_jn3_00461, Lmb_jn3_10047) and 6 (one gene, Lmb_jn3_04300), and LysM genes from cluster 2 matched with
Colle-totrichum spp. LysM genes expressed in planta.
Three isochorismatase genes (Lmb_jn3_11641, Lmb_ jn3_10045, Lmb_jn3_06552), interfering with plant salicylate and jasmonate defense signaling in other phytopathogens, were present in clusters 1, 4, and 6, respectively. Last, all the proteins involved in the biosynthesis of ABA in B. cinerea matched L.
macu-lans proteins annotated in the ABA biosynthesis
cluster, but the ABA genes were not expressed in planta in B. cinerea while they are expressed in the biotrophy cluster 2 in L. maculans (Additional file12: S7 Fig). Finally, one of the two genes encoding NEP (necrosis and ethylene-inducing protein), frequently
associated with necrotrophic behavior [42], was
found to be overexpressed in planta, and belonged to cluster 4 (Lmb_jn3_10035).
Secondary metabolite gene clusters
The genome of L. maculans contains 22 genes predicted by SMURF tools to encode secondary metabolite enzymes
(SM) and annotated as “polyketide synthase” (PKS, 11)
“non-ribosomal peptide synthetase” (NRPS, 5), or “others” (dimethylallyltryptophan synthase, 1; NRPS-like, 4; PKS-like, 1). Seven of the 1207 genes in the eight expression clusters encoded SM enzymes from the PKS or NRPS family. Four of these genes were highly expressed during necrotrophic stages of the life cycle within the stem (ter 6), whereas the other three were associated with clus-ters 2, 4, and 5 (Additional file13: S3 Table).
Among the SM genes analyzed in previous studies [27,
43, 44], the PKS gene involved in abscisic acid (ABA) synthesis was linked to biotrophic behavior (cluster 2), whereas genes involved in the synthesis of the toxins sir-odesmin PL and phomenoic acid were associated with stem necrotrophy, together with one other PKS and one NRPS-like gene (cluster 6) (Additional file13: S3 Table). Secondary metabolite enzymes encode an SM backbone that may be modified by tailoring enzymes, forming complex secondary metabolite gene clusters (SMGC). Here, only three of the seven SM enzyme genes overex-pressed in planta showed coregulation with all or part of surrounding genes of their SMGC: (i) the PKS respon-sible for ABA production (all genes of the ABA SMGC being included in cluster 2), (ii) the NRPS responsible for sirodesmin PL production (16 of the 25 genes of the SMGC included in cluster 6), and (iii) an unknown
NRPS-like gene, co-expressed with nine other
surrounding genes also included in cluster 6 (Add-itional file14: S8 Fig).
Genes involved in L. maculans pathogenicity
Thirty-six of the 52 genes previously identified as
candi-date pathogenicity genes in L. maculans
(Add-itional file 15: S4 Table) did not belong to the SM or avirulence effector gene (see below) categories. Fifteen of these genes were identified within a single cluster (Add-itional file15: S4 Table): cluster 1 (2 genes), cluster 2 (5 genes), cluster 3 (1 gene), cluster 4 (4 genes), cluster 5 (2 genes), or cluster 7 (1 gene). Nine had previously been selected as putative pathogenicity genes on the basis of their overexpression during infection, for inactivation with CRISP-cas9, but the inactivation of these genes in-dividually resulted in no visible pathogenicity defect at the cotyledon stage [45] (Additional file 15: S4 Table). Only one gene, encoding a 3-ketoacyl-thiolase (cluster 1), was shown to be involved in pathogenicity, but the mutant also displayed impaired in vitro growth and ger-mination [28] (Additional file 15: S4 Table). The other five genes have not been validated by functional ap-proaches and are, thus, still considered to be candidate pathogenicity-related genes. Four of these genes (three GH genes and one ABC transporter) were included in the late expression clusters 4, 5, and 7, suggesting that they may be bona fide pathogenicity genes (Add-itional file15: S4 Table).
By contrast, another 21 putative pathogenicity genes did not belong to any of the expression clusters. Nineteen had previously been analyzed in functional studies (knockout or silenced mutants), and 10 were shown to induce a loss or reduction of pathogenicity following inactivation (Add-itional file15: S4 Table). However, the inactivation of six of these genes also induced defects in growth, sporulation, or germination [30,33,36,45,46], suggesting a general ef-fect on different stages of the fungal life cycle with no spe-cific overexpression during interactions with the plant.
Validated or candidate SSP effectors of L. maculans
SSPs have been identified in L. maculans and were classified as “early” effectors (including all known aviru-lence proteins, inducing an aviruaviru-lence phenotype when matching the corresponding resistance genes) or “late” candidate effectors by Gervais et al. [14]. The role of
avirulence proteins as effectors suppressing plant
defense responses or increasing/decreasing the size of cotyledon lesions has been investigated in a few cases following comparisons of near-isogenic L.
macu-lans isolates, gene silencing or complementation
(Additional file15: S4 Table, [21,22,47,48]). The most recently published version of the genome assembly of L. maculans isolate JN3 ([49]; Additional file 16: S4 Text) included a number of major changes. We therefore
produced a new repertoire of genes encoding putative SSPs, encompassing 1070 genes (8.2% of the entire L. maculansgene set) (Additional files6,17,18and19: S3 Text, S9 Fig, S5 and S6 Tables).
All expression clusters displayed a significant enrichment in genes encoding SSPs (Additional files8: S3 Fig). We found that 272 of the 1207 genes upregulated during the L. macu-lans interaction with B. napus (22.5%) encoded SSPs. This enrichment was limited in clusters 1, 3, 6, 7, and 8, which contained only 14–17% of SSP-encoding genes (0.013 < p < 3.10− 5), but three other clusters displayed a much higher level of enrichment in genes encoding SSPs: cluster 4 (23.1%, p= 7 × 10− 16), cluster 5 (31.2%, p = 2 × 10− 16), and cluster 2 (45.3%, p = 2 × 10− 16). Interestingly, both clusters 2 and 5 are associated with biotrophic behavior of the fungus. All the currently known AvrLm genes belonged to the“Biotrophy” cluster (cluster 2) (Additional file15: S4 Table). This cluster displayed sequential rounds of overexpression/repression, with three peaks of overexpression occurring during the three biotrophic stages (5–9 DPI on cotyledons, leaf infection in the field; 7 DPI on petioles; 6–7 MPS in field plant stems) (Fig.5; Additional file20: S10 Fig).
The ten “late” effectors, expressed during stem
colonization in controlled conditions [14], were scattered over four different clusters (3, 4, 5, 6), along with a series of other genes encoding SSPs (cluster 3, 14 SSPs; cluster 4, 55 SSPs; cluster 5, 40 SSPs and cluster 6, 22 SSPs) (Fig.5). The“late” effectors in clusters 5 and 6 were spe-cific to stem colonization (and the first stages of sapro-trophy on residues), but those in clusters 3 and 4 were also expressed during cotyledon infection. These “late” effector candidates were associated with either bio-trophic behavior on stems (cluster 5) or necrobio-trophic behavior on cotyledons and stems (clusters 3 and 6).
Clusters 1, 7, and 8 were also found to be enriched in genes encoding SSPs (p value < 5 × 10− 3). They con-tained 16, 33, and 24 SSP genes, respectively. Candidate effectors may, therefore, be mobilized very early in colonization (cluster 1) and during saprophytic life (clus-ters 7 and 8) (Additional file20: S10 Fig).
Additional RNA-Seq samples (ascospores germinating on unwounded cotyledons 24 and 48 h post inoculation; stem base samples 2, 3 and 5 MPS) were available. They provided too few L. maculans reads for statistical ana-lyses, but these samples allowed us to confirm that genes belonging to cluster 2, and“early” effector genes in par-ticular, were among the genes most strongly expressed both during ascospore germination on cotyledons and very early stages of stem colonization in winter (Additional files21and22: S5 Text, S7 Table).
Histone methylation associated with gene regulation
All cloned avirulence genes of L. maculans identified to
date are associated with H3K9me3. Furthermore,
H3K9me3 and H3K27me3 domains are significantly enriched in genes encoding effectors, regardless of their expression [38]. During axenic culture, 7373 L. maculans genes are associated with H3K4me2, 104 with H3K9me3, 2020 with H3K27me3 and 101 with the two
heterochro-matin histone modifications [38]. We combined the
genome-wide histone maps previously generated in vitro with our analysis of gene expression during infection, to determine whether (i) all genes, (ii) only (putative) effector genes, or (iii) only certain subsets of genes upregulated in planta were associated with a particular chromatin land-scape. H3K4me2-domains encompass 56% of L. maculans genes, but only 20% of the genes upregulated in planta
were associated with H3K4me2 (χ2
test = 662; p < 2 × 10− 16). By contrast, the genes upregulated in planta were significantly enriched in genes located in an H3K27me3 domain, as 44% of the upregulated genes were located in
such a domain (χ2
test = 749, p < 2 × 10− 16). Strikingly, only 205 genes were located in H3K9me3 or H3K27me3 domains in vitro, but 85 of these genes were upregulated in planta. Thus, regardless of the wave of expression con-cerned, the genes upregulated in planta were enriched in genes associated with heterochromatin in vitro. Only clus-ter 2 was significantly enriched in genes associated with the H3K9me3 histone modification (Fig. 6). Interestingly, all clusters of genes upregulated in planta relative to axenic culture were enriched in H3K27me3-associated genes in vitro, whereas these clusters contained signifi-cantly fewer genes located in H3K4me2-domains in vitro than the rest of the genome (Fig. 6). The integration of RNA-Seq and ChIP-Seq data revealed that the genes up-regulated in planta were not randomly located in the gen-ome of L. maculans, with H3K4me2-domains significantly depleted of genes upregulated during rapeseed infection, and both types of heterochromatin domains significantly enriched in such genes.
The co-expression of effector genes defines waves of coregulated gene expression
Almost all the expression clusters were enriched in genes encoding SSPs. However within each cluster, the genes encoding SSPs could have different expression profiles, due to the clustering method (Additional file20: S10 Fig). We aimed here to increase the robustness of the detection of SSP expression waves. We defined eight SSP reference expression profiles by calculating the mean levels of expression for SSP genes within the eight clusters. We selected genes displaying significant coregu-lation (SSP and non-SSP genes), by analyzing the linear regression between the expression patterns of the entire set of 13,047 genes and that of each SSP reference ex-pression profile. Genes significantly co-expressed with the reference expression wave tested (R2> 0.80, p < 0.05)
Fig. 5 Expression of known and putative effectors of Leptosphaeria maculans within the eight expression clusters. The scaled Log2(FPKM + 1)
expression values for the nine avirulence effector (AvrLm) genes, and the eleven candidate late effector genes shown to be upregulated in at least one set of conditions in planta are represented and grouped according to cluster assignment. The mean scaled Log2(FPKM + 1) values of all
the small secreted protein (SSP) genes in each cluster are indicated (black bold curve). The total number of SSP genes in each cluster is indicated. The conditions are described in the legend to the x-axis. Three sample features are described: (i) the experimental conditions: IPF, in planta field conditions; IPC, in planta controlled conditions; RF, residues in field conditions; (ii) the type of plant tissue sampled; and (iii) the sampling time points (DPI, days post inoculation; MPS, months post sowing; MPH, months post harvest)
were included in the new SSP expression waves and were considered to be“highly coregulated genes.”
For clusters 1, 3, and 8, no highly coregulated genes could be identified (Fig. 7). For the other five clusters, waves of highly coregulated genes were identified, each containing five to 39 highly coregulated SSP genes (in-cluding 90 SSP genes from the 178 previously assigned to these clusters), together with 186 highly coregulated
genes encoding other types of proteins (Fig. 7). Two
waves of expression, corresponding to clusters 5 and 6, displayed coregulation of a limited number of SSP genes (seven and five, respectively, i.e., 17% of the SSP genes of these clusters), together with 20 and 25 genes encoding other proteins, respectively. However, only 15 (cluster 5) and 13 (cluster 6) of these genes belonged to the clusters (Fig. 7), suggesting that additional coregulated genes are either expressed in axenic conditions, or do not display specific regulation during plant infection. For clusters 2, 4, and 7, a higher proportion of highly coregulated SSP genes was found, with 58% (exact confidence interval
[45–70%]), 34% ([22–48%]), and 63% ([45–79%]) of the SSP genes of the clusters retained in the waves of highly coregulated genes, respectively (Fig. 7). Thus, clusters 2 and 7 displayed the highest proportion of highly coregu-lated SSP genes, suggesting that the regulation of expres-sion is much tighter in these two clusters than in the others. The highly coregulated genes in the “Biotrophy” wave (contained in cluster 2) included 39 SSPs, 23 (59%) of which displayed no sequence matches to the
NCBI nr protein database (Additional file 23: S8
Table) and could be considered L. maculans-specific effectors. These genes also included other genes men-tioned above, such as the genes of the ABA cluster, providing additional support for their role in the bio-trophic parts of the interaction. The highly
coregu-lated genes in the “Stem canker and necrotrophy”
wave included most of the SSP genes of the cluster, but only two of these genes (9.5%) were specific to L. maculans. This wave also included a large number of genes (24) encoding CAZymes.
Fig. 6 Association of Leptosphaeria maculans genes upregulated in planta with the histone modification marks. The genome-wide histone map was generated by ChIP-Seq analysis during axenic growth [38]. The proportion of genes associated with any of the histone modifications H3K4me2, H3K9me3, and H3K27me3 throughout the entire genome was used as a reference set for detecting the over- or under-representation of specific methylation marks in the eight gene clusters overexpressed in planta, in chi-squared tests (***: p < 0.001, **: p < 0.01). K4, H3K4me2; K9, H3K9me3; K27, H3K27me3
Discussion
In this paper, we used large-scale transcriptomic analyses to decipher the complex life cycle of a phytopathogenic fun-gus, to identify genes paramount for its interactions with the host plant and to shed light on the underlying regula-tory mechanisms. In particular, given that many parts of the L. maculans life cycle remain poorly described, we fo-cused on how the fungus copes with its different lifestyles, their timing and the transitions between them, and the regulation of gene expression throughout the long patho-genic/saprophytic life of the fungus. We generated RNA-Seq data for biological samples corresponding to the main relevant stages of infection in controlled conditions or in field conditions, and at different time scales (from days to years). Using this large dataset, we then focused on sets of genes mobilized exclusively when the fungus interacts with the plant. We used 10 different sets of axenic growth condi-tions promoting different aspects of the fungal life cycle
(e.g., vegetative growth, asexual sporulation, sexual
reproduction) as basic expression features for the identifica-tion of pathogenicity genes per se, contrasting with the common practice of using only a few axenic conditions as controls [7,13,14] or performing pairwise comparisons of the infection time course [11]. We dealt with the variable number of fungal reads between samples and the diverse in vitro conditions, by applying very stringent conditions to determine whether a gene was specifically overexpressed (LogFC> 4, p < 0.01). With these criteria, we showed that 1207 genes (less than 10% of the genes of the fungal gen-ome) were overexpressed during interactions with the living or dead plant relative to axenic conditions. These genes may be considered the maximal set of genes mobilized by the fungus to infect the plant without involvement in basal biological processes. These 1207 upregulated genes were consistently grouped into eight expression profiles, some of which displayed strong coregulation of a number of the genes within the cluster. The sequential expression profiles are consistent with the associated pathogenicity functions, confirming the relevance of this RNA-Seq study performed over a large timescale.
Transcriptome-based description of a complex fungal life cycle
Our RNA-Seq data highlighted and strengthened our knowledge of the biology of the fungus all along its life cycle, including for “obscure parts” of this cycle, as fol-lows (Fig.8):
(i) Ascospores, which are difficult to generate for pathogenicity tests in controlled conditions, are known to be the main source of infection in the field, germinating within a few hours to produce a hypha that penetrates leaf tissues via stomata or
wounds [50]. We found that germinating hyphae
very rapidly (2 DPI) produced“early” effector transcripts (including known AvrLm effectors), detected only 5–7 DPI as a massive peak of expression when inoculations were performed with conidia ([11,13,14], this study). This result is consistent with microscopy-assisted RNA-Seq ana-lyses in other models, which have suggested that a few hyphal tips produce early effectors to counter the initial defense reactions of the plant upon con-tact [4,51]. This suggests that, like other plant-associated fungi,L. maculans manipulates the plant as soon as it enters the tissues, to initiate its own growth within plant tissues, without causing symptoms.
(ii) Following the infection of leaves or cotyledons and primary leaf spot development, the hyphae grow within the intercellular spaces within tissues in advance of the leaf spots towards and within the petiole and then enter the stem tissues [52–54]. Our RNA-Seq data highlight the kinetics of this process and the lifestyle transitions occurring dur-ing cotyledon infection, with three successive waves of gene expression related to different stages of in-fection (penetration, biotrophy, and necrotrophy). Consistent with the biological data, the pattern of gene expression during petiole colonization was similar to that in cotyledons, with a symptomless
(See figure on previous page.)
Fig. 7 Identification of highly coregulated Leptosphaeria maculans genes based on mean SSP gene expression in planta. The mean scaled Log2(FPKM + 1) values for small secreted protein (SSP) genes in each cluster (clusters 1 to 8) were used to create the eight reference expression
profiles (black bold curve). The 22 sets of biological conditions used to average SSP gene expression are described in the legend to the x-axis. Three sample features are described: (i) the experimental conditions: IPF, in planta field conditions; IPC, in planta controlled conditions; RF, residues in field conditions; (ii) the type of plant tissue sampled; and (iii) the sampling time points (DPI, days post inoculation; MPS, months post sowing; MPH, months post harvest. A linear regression analysis was performed to determine the correlation between the scaled Log2(FPKM+ 1)
value for the whole set of genes in the 22 sets of conditions and these eight reference expression profiles. A gene was considered to be highly correlated if its expression fitted the reference expression profile (in black) with an R-squared value > 0.80 and a corrected p value < 0.05. The expression values of the resulting highly correlated gene subsets (SSP in blue and non-SSP in yellow) are plotted. The Venn diagrams show the number of genes (S: SSP, NS: Non-SSP) present in each cluster (green circles) and the number of genes identified as highly correlated with the corresponding expression profile (red circles). The asterisks indicate the significance of the SSP enrichment in the initial cluster (***: p < 0.001, **: p < 0.01)
stage during which the same set of genes was mobi-lized in cotyledons or petioles (Fig.8).
(iii) We also found that isolates infecting leaves in the field had a pattern of gene expression similar to that of a reference isolate used to inoculate cotyledons in controlled conditions at 7 and 9 DPI, demonstrating that infections reproduced with routine protocols in controlled conditions can accurately mimic some stages of field infection. (iv) The monitoring of stem samples for a full year in
field conditions provided new information about the dynamics of stem colonization and necrosis in the field. We found that the fungus was present
very early in the stem base tissues, with fungal reads detectable as early as December, as little as 1 to 2 months after the initial leaf infection. However, levels of fungal transcriptomic activity remained very low between December and February, and it was only at the end of winter (from March on) that the fungus displayed a quantifiable, steady increase in transcriptomic activity.
(v) Fungal life within stem tissues, over a period of 8 months, was characterized by complex patterns of gene expression, with some of the genes concerned expressed exclusively during stem colonization, highlighting the lengthy transition from biotrophy
Fig. 8 Overview of the eight expression profiles detected during the infection cycle of Leptosphaeria maculans. Each curve represents the mean expression value for the genes making up the eight clusters described in this study. The eight profiles are divided into three different plots, depending on the timing of their major expression peaks: (a) early infection and colonization of cotyledons, (b) late colonization of stems, (c) development on crop residues. The characteristics associated with each sample are indicated: mode of nutrition (B: biotrophy, N: necrotrophy, S: saprotrophy); the experimental conditions: (i) IPF, in planta field conditions; IPC, in planta controlled conditions; RF, residues in field conditions; (ii) the type of plant tissue sampled; and (iii) the sampling time points (DPI, days post inoculation; MPS, months post sowing; MPH, months post harvest). We did not include field-infected leaves and the stem infected in controlled conditions, to prevent redundancy and generate a simplified model. The major gene functions identified in each gene cluster are shown on the right
to necrotrophy leading to stem canker (Fig.8). The gene expression patterns observed for stem infection at 6 and 7 months post sowing (March– April) were very similar to those observed for biotrophic stem infection in controlled conditions at 14 and 28 DPI, again demonstrating that controlled conditions adequately reproduce at least one stage of stem colonization in the field.
(vi) The fungus has been reported to survive on residues for between 2 and 4 years, depending on the climatic conditions [50]. However, we currently
know nothing about howL. maculans survives as a
saprobe on residues. A recent metabarcoding study
showed thatL. maculans was the predominant
fungal species on rapeseed residues, on which many other fungal species, including other
phytopathogens were also present, highlighting complex interplay between the species [55]. Our RNA-Seq analysis of residues left on the soil for 1 year confirmed these findings and systematically revealed transcriptomic activity ofL. maculans on the residues, with a mean of 22% of the total
RNA-Seq reads corresponding toL. maculans throughout
the year, but with seasonal variations.
Expression profiles and characteristics of genes specifically involved in interaction with the plant
We observed successive or partly overlapping expression profiles, highlighting various life traits or feeding strat-egies specific to a particular lifestyle or colonized tissue (cluster 1, cluster 2, cluster 4, cluster 8), or with a com-bination of lifestyle/tissue specificities (cluster 3, cluster 5, cluster 6, cluster 7) (Fig.8). For example, necrotrophic behavior is tissue-specific, with genes expressed during cotyledon or petiole necrosis (cluster 3) or in stem tis-sues at the end of the growing season (cluster 6; Fig. 8). By contrast, cluster 2 is involved in biotrophic behavior, whatever the tissue colonized.
The set of 1207 genes specifically expressed during interaction with the plant is strongly enriched in candi-date effectors, with enrichment in effectors observed for all expression clusters. As shown for cotyledon infection in other studies [13], and expanded here to other trophic or necrotrophic stages of plant infection, bio-trophic behavior was associated with enrichment in very few, if any GO terms, whereas biotrophy-necrotrophy transitions were strongly enriched in genes involved in catalytic processes and CAZymes. Strict necrotrophic behavior within stems is associated with an overrepre-sentation of PKS-encoding genes (including the
sirodes-min biosynthesis gene cluster) relative to other
necrotrophic clusters.
The fungus expresses a set of 148 genes in all bio-trophic/endophytic/asymptomatic stages of colonization
(cluster 2). Being based on the annotated reference gen-ome, this amount is probably under-estimated when considering field isolates that may have a different reper-toire of effector genes. This would be mostly the case for genes of cluster 2 embedded in TE-rich regions and known to be prone to presence/absence polymorphism in field populations. Interestingly, we found that the ex-pression of these genes was up- and down-regulated on multiple occasions during the interaction with the plant. The recycling of the same set of genes for a similar life-style highlights the key role played by this set of genes in establishing symptomless growth within the plant, with at least one set of stem-specific genes (cluster 5) also as-sociated with biotrophic behavior, but only during stem colonization. Cluster 2 (and, to a lesser extent, cluster 5) was found to be strongly enriched in genes encoding candidate effectors, which are generally thought to act
by compromising plant immunity [15]. One of these
candidate effectors, AvrLm10A, has been shown to com-promise leaf symptom development [23], and two others, AvrLm4–7 and AvrLm1, interfere with SA and ET sig-naling [47, 48]. In addition, cluster 2 includes genes re-ported in various models to be involved in the suppression of plant defense responses (salicylate hy-droxylase or the ABA cluster [27,56,57];) or the scaven-ging of chitin oligomers, such as the LysM genes [41]. This strongly suggests that cluster 2 plays an important role in hiding the fungus from the plant surveillance ma-chinery, or in compromising or suppressing plant defense responses to various extents.
Our findings suggest that the previous classification of effectors as “early” or “late” [14] is not relevant. “Early” effector genes were found to be expressed on several oc-casions during symptomless cotyledon infection and colonization, the symptomless colonization of petioles, and during at least 3 months of symptomless growth in the tissues of the stem base. Similarly, the“late” effector genes identified by Gervais et al. [14] and thought to be specific to stem colonization according to experiments in controlled condition, were actually found in four dif-ferent expression clusters, only one of which was specific to biotrophic behavior in stem tissues (cluster 5, Fig.8).
Importantly, cluster 2 contains all the genes encoding avirulence proteins identified to date in L. maculans. During leaf or cotyledon infection, these avirulence pro-teins can be recognized by the products of the major re-sistance genes (Rlm genes) of the plant, resulting in complete resistance to avirulent isolates. The re-use of these same genes at other stages of plant colonization strongly suggests that recognition can also take place during the systemic growth of the fungus within petioles or stems, resulting in efficient resistance at these stages of colonization, provided that the Rlm genes are consti-tutively expressed in all plant tissues. In addition to the
nine already cloned avirulence genes, cluster 2 contains 58 additional SSP genes (39 of which are highly coregu-lated with all AvrLm genes), which are candidates of choice for the screening of genetic resources for novel resistance genes.
We also found that effector gene expression was not restricted to interaction with the living plant. Genomic studies on fungal saprotrophs focus on
CAZymes and class-II peroxidases [58]. We show
here that L. maculans recruits a typical cocktail of CAZymes, including the lytic polysaccharide monoox-ygenases (LPMO) involved in wood decay, but also peroxidases, cytochrome P450, and stress response genes, during 1 year of life on crop residues. In addition, cluster 7 encompasses 21 SSP genes specific-ally expressed during saprophytic growth on stem
res-idues (Fig. 8). It has been suggested that effector
genes arise from genes used by saprobes to suppress ecological competitors [59, 60]. The steady expression of a series of coregulated candidate effector genes during many months of life on residues, regardless of the changes in the mycoflora present on the residues over time [55], may indicate a need for the fungus to produce a minimal set of molecules involved in eco-logical competition.
Heterochromatin-based regulation of expression as a key player in the lifetime coregulation of genes involved in pathogenicity
One of the key findings of our work is that all clusters of genes overexpressed during interaction with the host are significantly associated with localization within a hetero-chromatin domain during axenic growth. Evidence is ac-cumulating, for many other plant-associated fungi, regardless of their lifestyles and modes of nutrition, that the genes involved in fungus-plant interaction are often present in regions of heterochromatin within the gen-ome (e.g., in [61–63]). Genes highly expressed during in-fection are often associated with heterochromatin during axenic culture (e.g., in Z. tritici or L. maculans [4, 37,
64]) and histone modifications (H3K9me3 and / or
H3K27me3) have been shown to play a major role in regulating secondary metabolite gene clusters or effector genes (e.g., in F. graminearum, F. fujikuroi, Z. tritici, Epi-chloe festucae[65–69]). In the endophyte E. festucae and the pathogen Z. tritici, the derepression of putative ef-fector genes or secondary metabolite gene clusters upon infection is associated with an underlying dynamic of histone modifications, which has been experimentally validated [65,68,70]. These data suggest that there is a generic chromatin-based control of plant infection mechanisms. We previously showed that, in L. macu-lans, heterochromatin domains (either H3K9me3 or H3K27me3) display significant enrichment in putative
effector genes and that all known avirulence genes are
associated with H3K9me3 during axenic growth [38].
We found here that the genes included in the eight clus-ters specifically overexpressed during interaction with the plant relative to axenic growth were also enriched in H3K9me3 and/or H3K27me3 histone modifications in vitro. Although other regulatory mechanisms may be involved, this significant enrichment reinforces the pos-tulate that the underlying condensation state of the chromatin, in the environment of genes sequentially turned on/off during plant colonization, represents an important player in this dynamic. One striking finding of our study is that genes from the various waves of expres-sion are scattered throughout the genome, but are
sig-nificantly associated with heterochromatin. This
association might facilitate the temporal regulation of sets of genes involved in the same process. All the eight expression clusters identified in the lifecycle of L. macu-lans contained genes displaying significant enrichment in H3K27me3 heterochromatin in vitro. This histone modification is an important regulator of development and response to several biotic and abiotic stresses, in various fungal or plant models (e.g., [71, 72]). By con-trast, genes associated with biotrophic or biotrophic/ asymptomatic life within the plants (cluster 2, Fig.8) dis-played enrichment in H3K9me3 in vitro. The genes in this cluster are located in TE-rich regions of the genome and were found to be more enriched in heterochromatin modifications than the genes of the other clusters. They included the largest number of candidate effector genes, and the largest number of highly coregulated genes (65 genes). In L. maculans, the TE-rich regions are com-prised of heterochromatin, leading to the silencing of as-sociated genes [37,38]. The unique association between genes involved in the symptomless spread of the fungus and H3K9me3 suggests that this histone modification is involved in a regulatory mechanism important for the concealment of the fungus from the plants defenses. Conversely, this cluster also contains all the known avirulence genes, providing additional support for the role of H3K9me3 as the primary regulator of expression for genes at the forefront of the battle with the plant, and as a target of choice for the establishment of effector-triggered immunity during co-evolution of the plant and the pathogen.
The genes associated with H3K9me3 in cluster 2 ap-pear to be more strictly coregulated than those in other clusters, in which genes are associated with H3K27me3. Our findings suggest that chromatin remodeling during interaction with the plant is highly dynamic, rather than occurring only once when the fungus infects the plant, as might have been anticipated from analyses of species with a short lifecycle, or from the few days of interaction amenable to laboratory experiments. This combined
analysis of transcriptomic and epigenomic data thus sup-ports the notion that the finely tuned temporal progress of fungal infections is underpinned by a highly dynamic phenomenon based on the successive opening and clos-ing of different genomic regions.
Conclusions
In many organisms, particularly those involved in com-plex interactions with hosts and the holobiont, many as-pects of the biology of the organism cannot be understood through simple biological/epidemiological approaches and cannot be reproduced experimentally. We show here that RNA-Seq approaches, while necessi-tating complex sampling schemes and complex data pro-cessing, are biologically informative and shed light on the various facets of a biological cycle. The data gathered provide us with a more complex view of the fungal life cycle and challenge previous hypotheses and over-simplified views of the interaction of the fungus with its host. Such approaches would also be relevant for com-plex interactions for which laboratory experiments are difficult or impossible to perform (pure biotrophs, in-cluding symbionts, endophytes, organisms with ex-tremely long interactions with perennial plants).
Our data support the notion that fungi harbor genes involved in niche adaptation and that these genes are lo-cated in flexible genomic regions, conferring an extreme plasticity of expression and reactivity in the face of changes in the environment in planta. The next chal-lenge will be to visualize and analyze heterochromatin dynamics during in planta colonization.
We were also able to identify stage-specific effectors, including numerous new putative effectors produced during symptomless tissue colonization, or saprophytic growth and survival on residues. The effectors produced during symptomless colonization may, at some stage, be recognized by the plant surveillance machinery and may constitute an invaluable set of potential targets for the identification of novel durable disease resistance genes for breeders.
Methods
Plant and fungal materials
Isolate JN2 (v23.1.2) was used in all experiments. Unless otherwise stated, the fungus was cultured on V8-agar medium, and conidia for inoculation tests were pro-duced as previously described [73]. Isolate Nz-T4, which is sexually compatible with JN2, was also used in in vitro crossing experiments. Both isolates were described by Balesdent et al. [74].
Three winter B. napus cultivars were used, depending
on the experiment: “Darmor-bzh,” the reference
se-quenced cultivar [75], “Darmor” and “Bristol.” “Darmor-bzh” is a dwarf isogenic line resulting from the
introduction of the dwarf bzh gene into “Darmor” [76]. “Darmor-bzh” and “Darmor” are characterized by a high level of quantitative resistance in the field, and “Bristol” is moderately susceptible [77].
Production of biological material for RNA sequencing In vitro culture
The fungus was grown under different in vitro condi-tions, to mimic as many physiological stages as possible. All replicates used for RNA sequencing were true inde-pendent biological replicates. The following physio-logical conditions were reproduced: mycelial growth on V8-agar medium or in liquid Fries medium, pycnidios-pore production on V8-agar medium, pycnidiospycnidios-pore ger-mination in liquid Fries medium, and sexual mating in vitro at three time points (7, 20, and 35 days).
For the mycelial state on solid medium, the fungus was cultivated on V8-agar plates. A plug of an actively growing culture was placed on the center of 9-cm-diameter V8-agar Petri dishes. The plates were sealed with Parafilm and were incubated at 25 °C in the dark. After 7 days of growth the aerial mycelium was collected with a spatula and immediately frozen with liquid nitro-gen in an Eppendorf tube. The mycelia from a minimum of three plates were pooled in one sample, and mycelia harvested from two independent experiments were sub-mitted to RNA sequencing.
To produce pycnidiospores, the fungus was cultivated on V8-agar plates without Parafilm and under both white light and near-UV light with a 12-h photoperiod. After 10 days, spores were collected as previously de-scribed [73]. The spore suspension from 9 Petri dishes were pooled in 50-mL Falcon tubes and centrifuged for 15 min at 4 °C and 2600g. The supernatant was dis-carded and the spores were suspended in 4 mL of sterile water. One milliliter of this spore suspension was centri-fuged similarly in an Eppendorf tube and the pellet was immediately frozen in liquid nitrogen to constitute the “resting spores” sample. For germinating spores, Erlen-meyer containing 20 mL of Fries liquid medium were seeded with the spore suspension at a final concentra-tion of 1.25 × 10⁸spores mL− 1 and submitted to orbital shaking at 150 rotations mn− 1. After 24 h at 25 °C, the germinating spore suspension was centrifuged in a Fal-con tube for 7 min at 9000g, and 4 °C, re-suspended in 1 mL of sterile water for a second centrifugation for 5 min at 9000g in an Eppendorf tube. The centrifugate was im-mediately frozen and stored at − 80 °C to constitute the “germinating spores” sample.
Mycelium was also obtained in liquid cultures in Fries liquid medium as previously established [78] after 7 days of cultivation.
Sexual mating conditions were obtained as previously described [79]. Briefly, plugs of two isolates of the