HAL Id: hal-00154621
https://hal.archives-ouvertes.fr/hal-00154621
Preprint submitted on 14 Jun 2007
HAL is a multi-disciplinary open access
archive for the deposit and dissemination of
sci-entific research documents, whether they are
pub-lished or not. The documents may come from
teaching and research institutions in France or
abroad, or from public or private research centers.
L’archive ouverte pluridisciplinaire HAL, est
destinée au dépôt et à la diffusion de documents
scientifiques de niveau recherche, publiés ou non,
émanant des établissements d’enseignement et de
recherche français ou étrangers, des laboratoires
publics ou privés.
The lower mass function of the young open cluster
Blanco 1: from 30 Mjup to 3 Mo
Estelle Moraux, Jerome Bouvier, John Stauffer, David Barrado y Navascues,
Jean-Charles Cuillandre
To cite this version:
Estelle Moraux, Jerome Bouvier, John Stauffer, David Barrado y Navascues, Jean-Charles Cuillandre.
The lower mass function of the young open cluster Blanco 1: from 30 Mjup to 3 Mo. 2007.
�hal-00154621�
hal-00154621, version 1 - 14 Jun 2007
June 14, 2007
The lower mass function of the young open cluster Blanco 1:
from
30M
Ju p
to
3M
⊙
E. Moraux
1⋆, J. Bouvier
1, J.R. Stauffer
2, D. Barrado y Navascu´es
3, and J-C. Cuillandre
4,51 Laboratoire d’Astrophysique, Observatoire de Grenoble (LAOG), B.P. 53, 38041 Grenoble Cedex 9, France 2 Spitzer Science Center, Caltech M/S 220-6, 1200 East California Boulevard, Pasadena, CA 91125, USA 3 Laboratorio de Astrofisica Espacial y Fisica Fundamental (LAEFF-INTA), Apdo. 50727, 28080 Madrid, Spain 4 Canada-France-Hawaii Telescope Corporation, 65-1238 Mamalahoa Highway, Kamuela, HI 96743, USA 5 Observatoire de Paris, 61 Av. de l’Observatoire, 75014 Paris, France
Received 14/09/2006; Accepted
ABSTRACT
Aims.We performed a deep wide field optical survey of the young (∼ 100 − 150 Myr) open cluster Blanco 1 to study its low mass population
well down into the brown dwarf regime and estimate its mass function over the whole cluster mass range.
Methods.The survey covers 2.3 square degrees in the I and z-bands down to I ≃ z ≃ 24 with the CFH12K camera. Considering two different
cluster ages (100 and 150 Myr), we selected cluster member candidates on the basis of their location in the (I, I − z) CMD relative to the isochrones, and estimated the contamination by foreground late-type field dwarfs using statistical arguments, infrared photometry and low-resolution optical spectroscopy.
Results.We find that our survey should contain about 57% of the cluster members in the 0.03 − 0.6M⊙mass range, including 30-40 brown dwarfs. The candidate’s radial distribution presents evidence that mass segregation has already occured in the cluster. We took it into account to estimate the cluster mass function across the stellar/substellar boundary. We find that, between 0.03M⊙and 0.6M⊙, the cluster mass distribution does not depend much on its exact age, and is well represented by a single power-law, with an index α = 0.69 ± 0.15. Over the whole mass domain, from 0.03M⊙to 3M⊙, the mass function is better fitted by a log-normal function with m0= 0.36 ± 0.07M⊙and σ = 0.58 ± 0.06.
Conclusions.Comparison between the Blanco 1 mass function, other young open clusters’ MF, and the galactic disc MF suggests that the IMF, from the substellar domain to the higher mass part, does not depend much on initial conditions. We discuss the implications of this result on theories developed to date to explain the origin of the mass distribution.
Key words.Stars : low-mass, brown dwarfs - Stars : mass function - Open clusters and associations : individual : Blanco 1
1. Introduction
Since the first brown dwarf discovery and confirmation in 1995 (Nakajima et al. 1995; Rebolo et al. 1995), new perspectives have opened regarding the formation of condensed objects in molecular clouds. Today more than a thousand brown dwarfs (BDs) are known but their mode of formation is still contro-versial and the theoretical framework describing the stellar and
Send offprint requests to: Estelle.Moraux@obs.ujf-grenoble.fr
⋆ Based on observations obtained at the Canada-France-Hawaii
Telescope (CFHT) which is operated by the National Research Council of Canada, the Institut National des Sciences de l’Univers of the Centre National de la Recherche Scientifique of France, and the University of Hawaii. Based on observations collected at the European Southern Observatory, Chile (ESO programmes 68.C-0233 and 71.C-0446). Some of the data presented herein were obtained at the W.M. Keck Observatory, which is operated as a scientific partnership among the California Institute of Technology, the University of California and the National Aeronautics and Space Administration.
substellar formation process(es) is far from being satisfactory. How do brown dwarfs form ? Is there a lower mass limit for an object to be formed ? A way to tackle these questions is to determine the mass spectrum resulting from the stellar forma-tion process, i.e. the initial mass funcforma-tion (IMF), down to the substellar regime.
Young nearby open clusters are ideal environments for such a purpose. Their members constitute a uniform population in terms of distance and age, the extinction is usually low and uniform, and their youth ensures that brown dwarfs are still bright enough to be easily detected and followed-up. Moreover, the well-known stellar population of the nearest open clusters complements the discoveries of brown dwarf members to yield a complete mass function from substellar objects up to massive stars.
In this contribution we present a study of Blanco 1, some-times referred to by the name of its brightest member ζ Sculptoris. It is a young southern open cluster (αJ2000 =
0h04m24s, δ
Hipparcos distance of 260+50−40 pc (Robichon et al. 1999) at a high galactic latitude (some 240 pc below the galactic plane,
b = −79.3◦), and has a low extinction (E(B − V) = 0.010). It has a low stellar density with ∼ 200 known stellar members spread over a 1.5◦diameter surface (Hawkins & Favata 1998) and its age is not very well constrained, around 100-150 Myr. Panagi & O’Dell (1997) found it is similar to or slighty older than that of the well-studied Pleiades cluster of 120 Myr, while other authors used an age of 100 Myr (e.g. Pillitteri et al. 2003). The cluster’s youth combined with its large distance from the galactic disc point to an unusual formation history. Ford, Jeffries & Smalley (2005) found also that the abundance pat-tern in Blanco 1 is quite exceptional with an average [Fe/H] close to solar (= +0.04 ± 0.04) but a subsolar [Ni/Fe], [Si/Fe], [Mg/Fe] and [Ca/Fe]. This lead the authors to suggest that the material from which the cluster formed was different from the local galactic disc ISM. It may have travelled some distance without having the chance to homogenize with the ISM and may also have been polluted by one or two unusual supernova events. All these peculiarities make Blanco 1 a very interesting target to test the dependence of the IMF on environmental con-ditions when comparing its present day mass function (MF) to those of similar age open clusters.
Blanco 1 was discovered by Blanco (1949) who noticed a small concentration of A0 stars having the same galactic lati-tude in this region. Since then several photometric studies have been performed, e.g. by Westerlund (1963), Epstein (1968), Eggen (1972), Perry et al. (1978), Lyngå & Wramdemark (1984), Abraham de Epstein & Epstein (1985) and Westerlund et al. (1988). Abraham de Epstein & Epstein (1985) published a relatively complete list of 260 F, G, and K stellar candidates. Kinematic studies based on radial velocities (Jeffries and James 1999) and proper motions (Pillitteri et al 2003) indicate that the contamination level of this photometric sample is about 35 to 40%. X-ray observations performed by Micela et al. (1999) yielded the detection of a few lower mass sources – M dwarfs – confirmed by proper motion. However, the Blanco 1 popu-lation at very low masses and in the substellar domain is still unexplored.
We performed a deep wide-field optical survey and follow-up observations to look for Blanco 1 brown dwarfs (BD) and very low mass stars (VLM) in order to estimate its mass func-tion (MF) down to the substellar domain. The observafunc-tions and data reduction are described in Section 2 and our results are given in Section 3. In Section 4 we compare our MF estimate to the Pleiades, other young clusters and the galactic disc MF to investigate the IMF universality. We discuss the implications for recently developed IMF theories.
2. Observations and data reduction
2.1. Optical survey
Blanco 1 has been observed using CFHT’s 12k×8k optical CCD mosaic camera (Cuillandre et al. 2001) during two sepa-rate runs in September 1999 and December 2000. Over the two runs, a total of 7 non overlapping fields, each of size 28′× 42′ on the sky, were obtained in the I and z filters (central
wave-lengths ∼ 850 and 950 nm respectively). The covered fields are graphically shown in Fig. 1 and their coordinates are listed in Table 1. For each pointing and each filter, the observing se-quence included one 10s and two 600s exposures. A total area of 2.3 sq.deg. was thus surveyed down to a detection limit of
I ∼ z ∼ 24 on and around the cluster’s nominal center. The
seeing measured on images obtained in both filters spanned a range from 0.5 to 0.8 arcsec FWHM.
Table 1. J2000 coordinates of the 7 CFH12K fields covered in Blanco 1.
Field RA(2000) DEC(2000) (h m s) (◦ ′ ′′) 4 00 : 07 : 27.0 −29 : 52 : 37 5 00 : 04 : 19.4 −29 : 53 : 21 6 00 : 01 : 05.0 −29 : 58 : 21 8 00 : 07 : 37.0 −30 : 18 : 26 9 00 : 04 : 19.4 −30 : 24 : 38 10 00 : 01 : 05.0 −30 : 24 : 40 11 00 : 04 : 19.4 −30 : 50 : 29
Fig. 1. Area of the sky covered by the CFHT 1999 and 2000 Blanco 1 surveys. Each rectangle corresponds to one CFH12K field (the coordinates are given in Table 1). The small cross in the middle represents the nominal cluster center and the dashed circles have a radius of 0.5, 1 and 1.5 degrees respectively. Small dots show the location of low mass star candidates se-lected from the short exposures. Very low mass star and brown dwarf candidates selected from the long exposures are shown as large dots if confirmed by infrared photometry and/or optical spectroscopy (open circles if ruled out).
These observations have been performed with the same in-strument and partly during the same nights as the Pleiades clus-ter survey described by Moraux et al. (2003). The reduction of the CFH12K mosaic images has been done likewise, chip by
chip. Briefly, they were first overscan and bias subtracted and a dark map correction was applied. Supersky flats were com-puted combining all images obtained in each band during the whole course of the observing run, and they were normalized to a reference CCD in order to obtain a uniform gain over the whole mosaic. The same photometric zero-point can thus be used for all the CCDs. Images were then flat-field corrected and fringes were removed (see Magnier & Cuillandre 2004 for details of the reduction procedure). Then the pre-reduced pairs of 600s exposures of each field were finally combined to yield the final long exposure images in the I and z filters.
The photometric analysis was done using the SExtractor package (Bertin & Arnouts 1996). To detect the maximum number of sources we first added all pairs of I and z reduced images together and we used the automatic object-finding al-gorithm on these frames. We then computed the photometry of each detected object by PSF-fitting on the individual (i.e. I or
z) images. Spurious detections (cosmic rays, bad columns) and
extended sources were rejected on the basis of their FWHM. For both runs, 1999 and 2000, the zero point of the instrument in the I-band was derived using Landolt photometric standard fields (SA98 and SA113) observed in the same conditions and reduced in the same way as Blanco 1 fields. Several exposures of SA98 were obtained with an incremental offset of several arcminutes in RA so that common sets of standard stars were observed on every CCD of the mosaic. We thus checked that the photometric zero-point in the I-band was the same for each CCD of the mosaic. For the z filter we used unreddened A0 standard stars covered by the Landolt fields assuming their I and z magnitudes were the same. For I < 20, the resulting pho-tometric rms ranges from 0.03 to 0.05 mag for both I and z filters, which corresponds to a colour accuracy between 0.04 and 0.07 mag in I − z. For fainter objects the accuracy is slighty worse but remains better than 0.07 mag in I and z, or 0.10 mag in I − z, down to I ∼ 22.5.
The astrometric solution of each image was calculated with the Elixir software (Magnier & Cuillandre 2002). We first com-puted it for the short exposures using the USNO2 catalog as reference and we used this solution as a first approximation for the long exposures. Since most of the USNO2 stars were satu-rated in the 600s images we could not use this catalog and we used the stars detected in both short and long exposures as as-trometric references instead. The same technique was used by Moraux et al. (2003) and the resulting astrometric accuracy is about 0.3 arcsec which is good considering the CFH12K plate scale of 0.206 arcsec/pixel.
2.2. Infrared follow-up photometry
We observed in the near-infrared 90 of the 124 brown dwarf and very low mass star candidates selected from the long ex-posures of the optical survey (see section 3.2) to confirm their status.
We obtained Ks-band images for 77 of them using the
SOFI camera (10242pixels, 0.288 arcsec/pixel) at ESO/NTT in August 2003. The total exposure time per object was in the range from 10 to 20 min, from the brightest (Ks ∼ 16) to the
faintest source (Ks∼ 20). The seeing was typically around 0.8
arcsec during the entire run and the conditions were most of the time photometric.
Thirteen other candidates have been observed with the near-infrared camera CFHT-IR (10242 pixels, 0.211 arcec/pixel) in November 2004. The observing conditions were very good, photometric with a seeing of about 0.6 arcsec.
In both cases, individual infrared images obtained for each object at 7 or 9 dithered positions were first median combined in order to obtain a sky image which was subtracted from the original images. Sky subtracted images were then flat field cor-rected using dome flats and averaged to yield the final Ks
im-age of the object. Aperture photometry was performed on the object using the IRAF/APPHOT package. Several photomet-ric standards from Persson et al. (1998) were observed each night throughout the run and reduced in the same way as the Blanco 1 candidates. They were used to derive the Ks-band
ex-tinction coefficient as well as the zero-point of the instrument (ZP = 22.46 ± 0.02 mag for SOFI and ZP= 22.73 ± 0.01 for CFHT-IR) and the final photometry is given in the K-band Las Campanas system. The resulting internal photometric precision on the K-band measurements of Blanco 1 candidates is typi-cally 0.02-0.03 mag for K ≤ 18 and 0.05-0.1 mag for fainter objects. While most of Blanco 1 targets were observed during photometric conditions, a few (BL-6, -70, -85, -102, -111) were affected by thin cirrus at the end of the 4th and 5th nights of the SOFI run. In order to calibrate the images taken in such con-ditions, we re-obtained shorter exposure time images of these fields during the following photometric nights. For those few candidates, the photometric accuracy is not as good, of order of 0.10 mag.
2.3. Optical spectroscopy
In addition to the photometric data we obtained low resolution optical spectroscopy for the brightest Blanco 1 brown dwarf candidates. The observations were performed using FORS2 (R ∼ 1500) at the VLT in November 2001 and LRIS (R ∼ 1000) at Keck in December 2001 and October 2002. For the three runs the data reduction was done in the same way using the IRAF package. Briefly, the CCD images were overscan, bias and flat-field corrected, the sky background was subtracted, and the spectra were extracted using the command APALL. The spec-tra were then wavelength calibrated using HgNeAr specspec-tra and corrected from the instrument response computed by dividing observed standard star spectra by their reference spectra.
3. Results
In the following we present the results we obtained from the analysis of the short (Sect. 3.1) and long (Sect. 3.2) opti-cal exposure images. The corresponding detection limits are
I ∼ 13 − 21 for tint = 10s and I ∼ 17.5 − 24 for tint = 600s
which allow our study to be complete from I = 14 to I = 22.2. For both integration times, we constructed the (I, I − z) colour-magnitude diagram (CMD) from which we selected low mass star and brown dwarf candidates. In order to take into account the uncertainty on the cluster age we made two selections, one
for an age of 100 Myr and the other for 150 Myr. For each sample, we estimate the contamination by field dwarfs using either statistical arguments or additional near-infrared photom-etry and optical spectroscopy when available. We then investi-gate the cluster member spatial distribution and determine the cluster core radius for different mass ranges (Sect. 3.3). We fi-nally use these results to derive the Blanco1 mass function from 30 Jupiter masses to 3M⊙(Sect. 3.4).
3.1. Low-mass candidate selection (
0.09M
⊙≤ m ≤ 0.6M
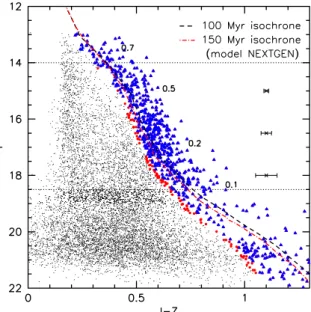
⊙)The (I, I − z) CMD corresponding to the short exposures of the optical survey is presented Fig. 2. The 100 Myr and 150 Myr isochrones given by the NEXTGEN models from Baraffe et al. (1998)1(see Moraux et al. 2003). shifted to the cluster
dis-tance ((m − M)o = 7.1 ± 0.4; Robichon et al. 1999) are shown
as a dashed and dot-dashed line. In order to avoid incomplete-ness due to detection bias (either saturation on the bright side or too low signal to noise ratio on the faint objects) we re-stricted our study to the magnitude range from I = 14 to 18.5. We then made a rather conservative photometric selection for each age (100 Myr and 150 Myr) by shifting the corresponding NEXTGEN isochrone to the maximum cluster distance given by Hipparcos ((m − M)o = 7.5), and on the blue side by the
colour photometric error given by:
σI−z= 0.014 + 2.10−8exp(0.8 × I) (1)
All the objects redder than this line are Blanco 1 candidate members. The 150 Myr isochrone is slightly bluer than the 100 Myr one, which means that the second selection will pick up a few more sources. The objects selected by both the 100 Myr and 150 Myr isochrones (by only the 150 Myr isochrone) are shown as triangles (resp. large dots) on Fig. 2. An electronic list of all the candidates is available from the CDS website. According to the NEXTGEN model, the magnitude range I = 14 − 18.5 corresponds to a mass m between 0.09M⊙and 0.6M⊙ at 100 Myr (0.10 − 0.6M⊙at 150 Myr) for (m − M)o = 7.1.
One of the major shortcomings of this photometric selec-tion is the contaminaselec-tion by sources unrelated to the cluster which may lie in the same region of the CMD. While a fraction of the selected objects must be true cluster members, others are merely field objects (galaxies, red giants or older field stars) on the line of sight. We do not expect to find many galaxies as con-taminants because we rejected all the extended objects through the photometric analysis. The number of red giants in our sam-ple is also expected to be small because they would have to be at greater than 6 kpc above the galactic plane to overlap in the CMD with Blanco1 members, and the density of giants at that height is small. Instead most of the contaminants are expected to be foreground field M-dwarfs.
1 The NEXTGEN and DUSTY isochrones have been calculated
es-pecially for the CFH12K filter set by I.Baraffe using the transmission curves and the CCD quantum efficiency. Their reliability is ensured by the fact that they work well at reproducing the Pleiades single star sequence for an age of 120 Myr and a distance of 125 pc in agreement with the cluster properties
Fig. 2. (I, I − z) colour-magnitude diagram for the short expo-sures of the optical survey. The dashed (dot-dashed) line is the 100 Myr (resp. 150 Myr) isochrone from the NEXTGEN mod-els of Baraffe et al. (1998) shifted to the Blanco 1 distance. The triangles and large dots correspond to our photometric selection of cluster member candidates for both ages (see text). Typical error bars are shown on the right side.
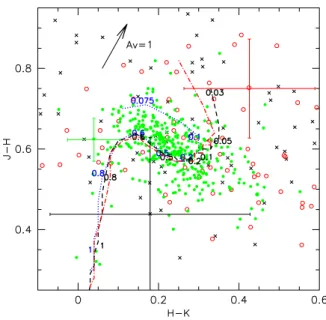
We cross-correlated the whole list of 534 candidates with the 2MASS catalogue for K <∼ 15.5. About 490 of them have a 2MASS counterpart, the others are too faint. The correspond-ing (I, I − K) CMD and (J − H, H − K) colour-colour diagram are shown in Fig. 3 and Fig. 4 respectively. Most of the can-didates lie on or close to the 100 Myr or 150 Myr NEXTGEN isochrone in both diagrams. This indicates that there is little extinction towards Blanco 1 and that all the candidates have infrared colours compatible with being M dwarfs. This sup-ports our contention that there are few giants or galaxies in our candidate sample. It shows also that infrared colours fail to dis-tinguish between field dwarfs and cluster members in this mass range as expected from the models.
To estimate the number of contaminants in our sample, we use instead statistical arguments. For each (I, I − z) position in the CMD, we first estimate the absolute MImagnitude of a field
dwarf having the same I − z colour using the 5 Gyr NEXTGEN isochrone, and we derive its distance from the difference I −MI.
An apparent magnitude range I, I + ∆I yields a distance range and we compute the corresponding volume containing the con-taminants from the surface of the sky covered by our survey. Using the M-dwarf MI-band luminosity function from Zheng et
al. (2004) as well as their scale height2we calculate the number
of expected contaminants per MI bin in the magnitude range
I, I + ∆I. Taking into account a gaussian photometric error of
width σI−zgiven by equation 1, we then derive the number of objects per I − z. Finally, to obtain the total number of field
2 Blanco 1 being at 240 pc below the galactic plane it is indeed
Fig. 3. (I, I − K) colour-magnitude diagram for all the opti-cally selected candidates which have a 2MASS counterpart. The dashed and dot-dashed line are the 100 Myr and 150 Myr isochrones from the NEXTGEN models of Baraffe et al. (1998) shifted to the Blanco 1 distance. The symbols are the same as in Figure 2.
M dwarfs per magnitude bin in our sample, we integrate over
I − z, for I − z redder than our selection limit. The results are
summarized Table 2. Out of the 479 (534) candidates detected in our survey for an assumed age of 100 Myr (150 Myr), we estimate about 211 (292) contaminants, which corresponds to a contamination level of ∼ 45% (∼ 55%).
3.2. Brown dwarf and very low mass star selection (
0.03M
⊙≤ m ≤ 0.09M
⊙)The optical (I,I − z) CMD corresponding to the long exposures of the survey is shown on the left panel of Figure 5, as well as the 100 Myr and 150 Myr isochrones. These isochrones follow the NEXTGEN models (Baraffe et al. 1998) down to Te f f ≃
2500 K, i.e. down to I ≃ 20.5 for Blanco 1. Then dust starts to appear in the brown dwarf atmosphere and the NEXTGEN models are not valid any more. When Te f f ≤ 2000 K (I ≃
21.5), all the dust is formed and the isochrones follow the DUSTY models (Chabrier et al. 2000). In between there is a transition and we simply draw a line from the NEXTGEN to the DUSTY models to ensure the continuity of the isochrones. To select the candidates we proceed in the same way as for the short exposures. For each age, we shifted the isochrones vertically to the largest cluster distance ((m − M)0 = 7.5) and
horizontally on the blue side by the colour photometric error. All the objects redder than this line are then considered as Blanco 1 VLM and BD candidates. This gives us two samples depending on which age we use. The line corresponding to the bluest selection (based on the 150 Myr isochrone) maximizes the number of candidates and is shown on Figure 5. We
identi-Fig. 4. (J −H, H −K) colour-colour diagram of all the low mass star candidates with a 2MASS counterpart. The different sym-bols correspond to different flags in the 2MASS catalog, i.e. different photometric accuracy (dots = flag A, open circles = flag B, crosses = flag C). A typical error bar is represented for each symbol. The 100 Myr, 150 Myr and 5 Gyr (correspond-ing to the field dwarf locus) isochrones are shown as a dashed, dot-dashed and a dotted line respectively and are labelled with mass. The reddening vector is also shown. All candidates are located on or close to the isochrones – within the error bars – indicating that there is little extinction and that they all have near-infrared colours consistent with M-dwarf spectral type.
fied 110 objects with 17.7 ≤ I ≤ 23 for 100 Myr, and 14 more for 150 Myr, i.e. 124 in total. They are listed in Table 3. Their mass spans a range between ∼ 0.03M⊙and 0.1M⊙and depends on the age of the cluster. Taking into account the distance of the cluster, the stellar/substellar boundary is around I ≃ 19.1 at 100 Myr and 19.6 at 150 Myr according to the NEXTGEN models, which means that about 75-80 of the selected objects are brown dwarf candidates.
As explained in the previous section, this optical photomet-ric sample is contaminated by late M-type field dwarfs and we therefore conducted follow-up observations of the candi-dates to confirm their membership. We obtained near-infrared photometry with SOFI at ESO/NTT for 77 of them, and with CFHT-IR for 13 others. The measured K-band photometry is given in Table 3. The candidate location in the (I, I − K) CMD (Fig. 5, right panel) compared to the isochrones shifted to (m − M)0 = 7.5 allowed us to weed out 18 objects, too blue
for being Blanco 1 members. They are indicated as open cir-cles in Fig. 5. The I − K colour is a good diagnostic of mem-bership in the DUSTY regime, for I & 21, but not as much for the brightest objects because field dwarfs and cluster mem-bers have similar infrared colours for I − z . 1.0 (see Fig. 6). A statistical estimate using the Zheng et al. (2004) luminos-ity function (LF) and calculated in the same manner as for the
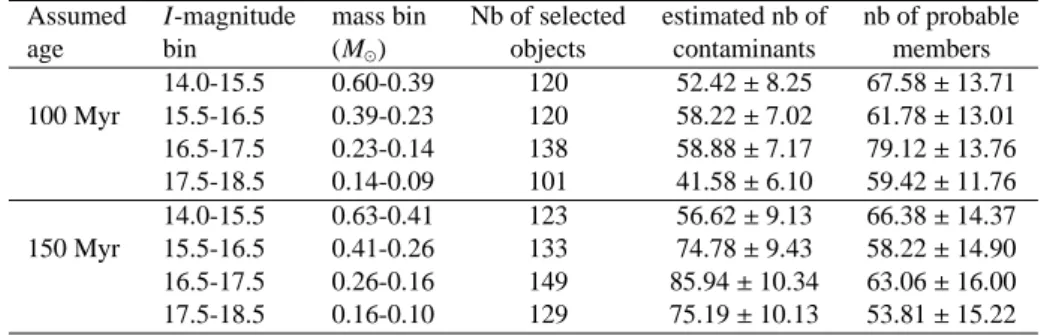
Table 2. Estimated number of contaminants and probable cluster members for 14 ≤ I ≤ 18.5 for both ages 100 Myr and 150 Myr.
Assumed I-magnitude mass bin Nb of selected estimated nb of nb of probable
age bin (M⊙) objects contaminants members
14.0-15.5 0.60-0.39 120 52.42 ± 8.25 67.58 ± 13.71 100 Myr 15.5-16.5 0.39-0.23 120 58.22 ± 7.02 61.78 ± 13.01 16.5-17.5 0.23-0.14 138 58.88 ± 7.17 79.12 ± 13.76 17.5-18.5 0.14-0.09 101 41.58 ± 6.10 59.42 ± 11.76 14.0-15.5 0.63-0.41 123 56.62 ± 9.13 66.38 ± 14.37 150 Myr 15.5-16.5 0.41-0.26 133 74.78 ± 9.43 58.22 ± 14.90 16.5-17.5 0.26-0.16 149 85.94 ± 10.34 63.06 ± 16.00 17.5-18.5 0.16-0.10 129 75.19 ± 10.13 53.81 ± 15.22
Fig. 6. (I − z, I − K) colour-colour diagram of the very low mass star and brown dwarf candidates. The symbols are the same as in Fig. 5. The 100 Myr, 150 Myr and 5 Gyr isochrones are shown as a dashed line, dot-dashed line and solid line respectively. The asterisks (resp. open squares) rep-resent Pleiades candidates confirmed (resp. rejected) by proper motion (Moraux et al. 2003, Casewell et al. 2007). Only a few error bars are drawn for clarity.
short exposures but with
σI−z= 4.47.10−6exp(0.465 × I) (2)
indicates that there should be 10-15 contaminants between
I = 17.7 and 18.5. Assuming that we are about 40% complete
in this magnitude range (because of saturation), this yields a contamination level of ∼ 30%. Below I = 18.5, we estimate the survey is complete and we find a contamination level of about 30% for I = 18.5 − 20. Between I = 20 and 21, we can-not use the same method because we reach the end of the field M-dwarf LF but we do not expect the contamination to be very high as the cluster sequence is well detached from the bunch of field objects in the (I, I − z) CMD. The fact that we do not identify any contaminant (except maybe CFHT-BL-57) in the (I, I − K) CMD in this magnitude range confirms that the
con-tamination level is indeed very low. For I & 21 and I − z > 1.0 infrared colour is sufficient to assess membership. The I − K colour of a 5 Gyr field dwarf starts indeed to differ from that of a ∼ 100 Myr cluster member in this domain (see Fig. 6). Even though the models may be too blue in I − z, empirical data from Pleiades studies (Moraux et al. 2003, Casewell et al. 2007) in-dicate that the I − K colour difference is real. Pleiades members confirmed by proper motion are redder in I − K than older field dwarfs with the same I − z > 1.1.
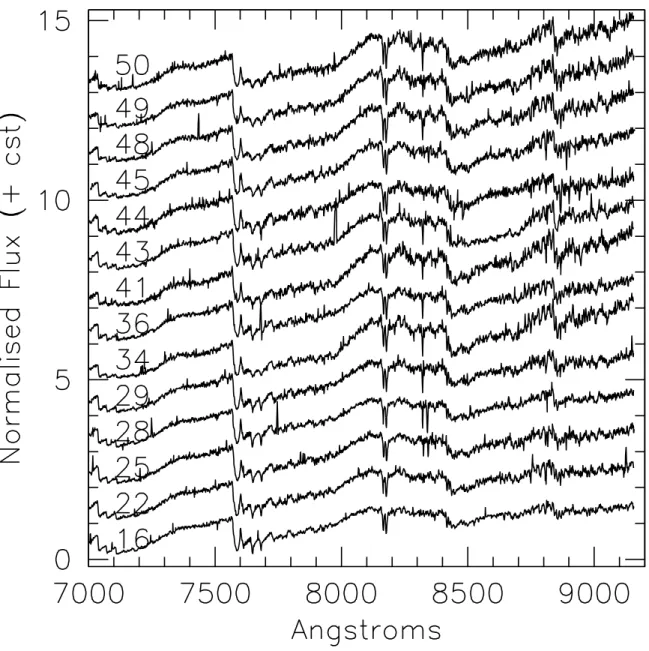
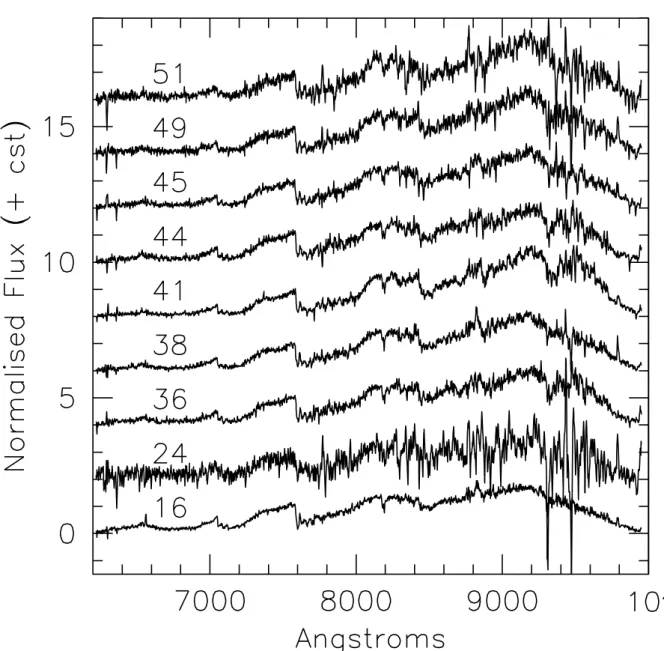
Additional spectroscopic data are thus especially needed for candidates brighter than I ∼ 20. We obtained optical low resolution spectroscopy for 17 of them with FORS2 on VLT and/or LRIS on Keck. The spectra are shown Fig. 7 and 8.
From these data, we estimate the spectral type of each ob-ject using different methods. We first use the PC3 index defined as the ratio of the flux between 8230Å and 8270Å to the flux between 7540Å and 7580Å in order to derive an estimate of the spectral type via the relationship
S pT = −6.685 + 11.715 × (PC3) − 2.024 × (PC3)2
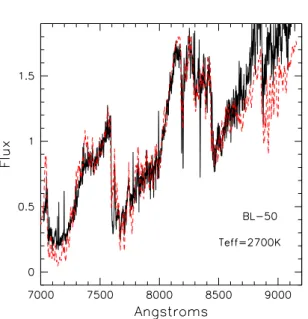
given by Martin et al. (1999). We also compare our spectra to those of spectroscopic standard stars obtained in the same conditions which allows us to estimate the spectral type with a precision of one sub-class. By fitting the data with synthetic spectra from the DUSTY models by Allard et al. (2001), we also estimate the effective temperature of our candidates with an accuracy of 100K corresponding to the grid step. An exam-ple of such a fit is given in Fig. 9 for BL-50. All these methods are in agreement with each other and the results are given in Table 4.
Knowing the effective temperature of the candidates, we then compare the gravity sensitive Na I doublet (8183Å, 8195Å) profile to synthetic spectra of similar Te f f given by
Allard et al. (2001) for various log g. The best fit allows us to estimate the surface gravity of the objects with an accuracy of 0.5 in log g corresponding to the grid step. Since the expected value of log g for ∼ 100 Myr brown dwarfs (log g ≃ 4.8) is lower than the one for older field dwarfs (log g ≃ 5.3), we can use this estimate as a membership criterion. Figure 10 shows the comparison of the Na I doublet profile of a very low mass candidate (BL-29) and a similar spectral type (M6) standard field dwarf GJ-866 with two synthetic spectra of similar Te f f
for log g = 4.5 and 5.0. The older field object is better fitted by the spectrum of larger gravity as expected, while the best
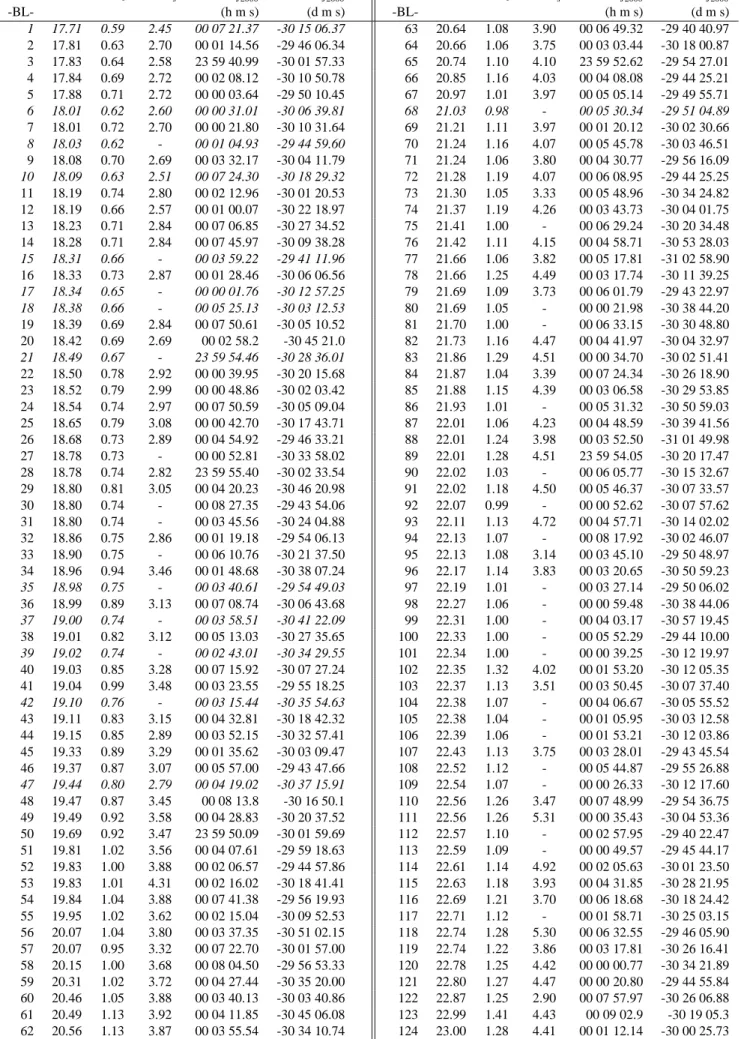
Table 3. Very low mass star and brown dwarf candidates selected from the long exposure images on the basis of their location in the (I,I − z) CMD (see Fig. 5). Objects selected by the 150 Myr isochrone but not the 100 Myr isochrone are written in italic. An electronic version of this table can be found on CDS.
CFHT I I − z I − Ks RAJ2000 DECJ2000 CFHT I I − z I − Ks RAJ2000 DECJ2000 -BL- (h m s) (d m s) -BL- (h m s) (d m s) 1 17.71 0.59 2.45 00 07 21.37 -30 15 06.37 63 20.64 1.08 3.90 00 06 49.32 -29 40 40.97 2 17.81 0.63 2.70 00 01 14.56 -29 46 06.34 64 20.66 1.06 3.75 00 03 03.44 -30 18 00.87 3 17.83 0.64 2.58 23 59 40.99 -30 01 57.33 65 20.74 1.10 4.10 23 59 52.62 -29 54 27.01 4 17.84 0.69 2.72 00 02 08.12 -30 10 50.78 66 20.85 1.16 4.03 00 04 08.08 -29 44 25.21 5 17.88 0.71 2.72 00 00 03.64 -29 50 10.45 67 20.97 1.01 3.97 00 05 05.14 -29 49 55.71 6 18.01 0.62 2.60 00 00 31.01 -30 06 39.81 68 21.03 0.98 - 00 05 30.34 -29 51 04.89 7 18.01 0.72 2.70 00 00 21.80 -30 10 31.64 69 21.21 1.11 3.97 00 01 20.12 -30 02 30.66 8 18.03 0.62 - 00 01 04.93 -29 44 59.60 70 21.24 1.16 4.07 00 05 45.78 -30 03 46.51 9 18.08 0.70 2.69 00 03 32.17 -30 04 11.79 71 21.24 1.06 3.80 00 04 30.77 -29 56 16.09 10 18.09 0.63 2.51 00 07 24.30 -30 18 29.32 72 21.28 1.19 4.07 00 06 08.95 -29 44 25.25 11 18.19 0.74 2.80 00 02 12.96 -30 01 20.53 73 21.30 1.05 3.33 00 05 48.96 -30 34 24.82 12 18.19 0.66 2.57 00 01 00.07 -30 22 18.97 74 21.37 1.19 4.26 00 03 43.73 -30 04 01.75 13 18.23 0.71 2.84 00 07 06.85 -30 27 34.52 75 21.41 1.00 - 00 06 29.24 -30 20 34.48 14 18.28 0.71 2.84 00 07 45.97 -30 09 38.28 76 21.42 1.11 4.15 00 04 58.71 -30 53 28.03 15 18.31 0.66 - 00 03 59.22 -29 41 11.96 77 21.66 1.06 3.82 00 05 17.81 -31 02 58.90 16 18.33 0.73 2.87 00 01 28.46 -30 06 06.56 78 21.66 1.25 4.49 00 03 17.74 -30 11 39.25 17 18.34 0.65 - 00 00 01.76 -30 12 57.25 79 21.69 1.09 3.73 00 06 01.79 -29 43 22.97 18 18.38 0.66 - 00 05 25.13 -30 03 12.53 80 21.69 1.05 - 00 00 21.98 -30 38 44.20 19 18.39 0.69 2.84 00 07 50.61 -30 05 10.52 81 21.70 1.00 - 00 06 33.15 -30 30 48.80 20 18.42 0.69 2.69 00 02 58.2 -30 45 21.0 82 21.73 1.16 4.47 00 04 41.97 -30 04 32.97 21 18.49 0.67 - 23 59 54.46 -30 28 36.01 83 21.86 1.29 4.51 00 00 34.70 -30 02 51.41 22 18.50 0.78 2.92 00 00 39.95 -30 20 15.68 84 21.87 1.04 3.39 00 07 24.34 -30 26 18.90 23 18.52 0.79 2.99 00 00 48.86 -30 02 03.42 85 21.88 1.15 4.39 00 03 06.58 -30 29 53.85 24 18.54 0.74 2.97 00 07 50.59 -30 05 09.04 86 21.93 1.01 - 00 05 31.32 -30 50 59.03 25 18.65 0.79 3.08 00 00 42.70 -30 17 43.71 87 22.01 1.06 4.23 00 04 48.59 -30 39 41.56 26 18.68 0.73 2.89 00 04 54.92 -29 46 33.21 88 22.01 1.24 3.98 00 03 52.50 -31 01 49.98 27 18.78 0.73 - 00 00 52.81 -30 33 58.02 89 22.01 1.28 4.51 23 59 54.05 -30 20 17.47 28 18.78 0.74 2.82 23 59 55.40 -30 02 33.54 90 22.02 1.03 - 00 06 05.77 -30 15 32.67 29 18.80 0.81 3.05 00 04 20.23 -30 46 20.98 91 22.02 1.18 4.50 00 05 46.37 -30 07 33.57 30 18.80 0.74 - 00 08 27.35 -29 43 54.06 92 22.07 0.99 - 00 00 52.62 -30 07 57.62 31 18.80 0.74 - 00 03 45.56 -30 24 04.88 93 22.11 1.13 4.72 00 04 57.71 -30 14 02.02 32 18.86 0.75 2.86 00 01 19.18 -29 54 06.13 94 22.13 1.07 - 00 08 17.92 -30 02 46.07 33 18.90 0.75 - 00 06 10.76 -30 21 37.50 95 22.13 1.08 3.14 00 03 45.10 -29 50 48.97 34 18.96 0.94 3.46 00 01 48.68 -30 38 07.24 96 22.17 1.14 3.83 00 03 20.65 -30 50 59.23 35 18.98 0.75 - 00 03 40.61 -29 54 49.03 97 22.19 1.01 - 00 03 27.14 -29 50 06.02 36 18.99 0.89 3.13 00 07 08.74 -30 06 43.68 98 22.27 1.06 - 00 00 59.48 -30 38 44.06 37 19.00 0.74 - 00 03 58.51 -30 41 22.09 99 22.31 1.00 - 00 04 03.17 -30 57 19.45 38 19.01 0.82 3.12 00 05 13.03 -30 27 35.65 100 22.33 1.00 - 00 05 52.29 -29 44 10.00 39 19.02 0.74 - 00 02 43.01 -30 34 29.55 101 22.34 1.00 - 00 00 39.25 -30 12 19.97 40 19.03 0.85 3.28 00 07 15.92 -30 07 27.24 102 22.35 1.32 4.02 00 01 53.20 -30 12 05.35 41 19.04 0.99 3.48 00 03 23.55 -29 55 18.25 103 22.37 1.13 3.51 00 03 50.45 -30 07 37.40 42 19.10 0.76 - 00 03 15.44 -30 35 54.63 104 22.38 1.07 - 00 04 06.67 -30 05 55.52 43 19.11 0.83 3.15 00 04 32.81 -30 18 42.32 105 22.38 1.04 - 00 01 05.95 -30 03 12.58 44 19.15 0.85 2.89 00 03 52.15 -30 32 57.41 106 22.39 1.06 - 00 01 53.21 -30 12 03.86 45 19.33 0.89 3.29 00 01 35.62 -30 03 09.47 107 22.43 1.13 3.75 00 03 28.01 -29 43 45.54 46 19.37 0.87 3.07 00 05 57.00 -29 43 47.66 108 22.52 1.12 - 00 05 44.87 -29 55 26.88 47 19.44 0.80 2.79 00 04 19.02 -30 37 15.91 109 22.54 1.07 - 00 00 26.33 -30 12 17.60 48 19.47 0.87 3.45 00 08 13.8 -30 16 50.1 110 22.56 1.26 3.47 00 07 48.99 -29 54 36.75 49 19.49 0.92 3.58 00 04 28.83 -30 20 37.52 111 22.56 1.26 5.31 00 00 35.43 -30 04 53.36 50 19.69 0.92 3.47 23 59 50.09 -30 01 59.69 112 22.57 1.10 - 00 02 57.95 -29 40 22.47 51 19.81 1.02 3.56 00 04 07.61 -29 59 18.63 113 22.59 1.09 - 00 00 49.57 -29 45 44.17 52 19.83 1.00 3.88 00 02 06.57 -29 44 57.86 114 22.61 1.14 4.92 00 02 05.63 -30 01 23.50 53 19.83 1.01 4.31 00 02 16.02 -30 18 41.41 115 22.63 1.18 3.93 00 04 31.85 -30 28 21.95 54 19.84 1.04 3.88 00 07 41.38 -29 56 19.93 116 22.69 1.21 3.70 00 06 18.68 -30 18 24.42 55 19.95 1.02 3.62 00 02 15.04 -30 09 52.53 117 22.71 1.12 - 00 01 58.71 -30 25 03.15 56 20.07 1.04 3.80 00 03 37.35 -30 51 02.15 118 22.74 1.28 5.30 00 06 32.55 -29 46 05.90 57 20.07 0.95 3.32 00 07 22.70 -30 01 57.00 119 22.74 1.22 3.86 00 03 17.81 -30 26 16.41 58 20.15 1.00 3.68 00 08 04.50 -29 56 53.33 120 22.78 1.25 4.42 00 00 00.77 -30 34 21.89 59 20.31 1.02 3.72 00 04 27.44 -30 35 20.00 121 22.80 1.27 4.47 00 00 20.80 -29 44 55.84 60 20.46 1.05 3.88 00 03 40.13 -30 03 40.86 122 22.87 1.25 2.90 00 07 57.97 -30 26 06.88 61 20.49 1.13 3.92 00 04 11.85 -30 45 06.08 123 22.99 1.41 4.43 00 09 02.9 -30 19 05.3 62 20.56 1.13 3.87 00 03 55.54 -30 34 10.74 124 23.00 1.28 4.41 00 01 12.14 -30 00 25.73
Fig. 5. (I,I − z) and (I,I − K) CMDs for all point-like objects identified in the long exposures of our survey. The 100 Myr and 150 Myr isochrones constructed from the NEXTGEN and DUSTY models (see text) shifted to the distance of Blanco 1 are shown as a dashed line and dot-dashed line respectively. The mass scale (in M⊙) corresponding to a cluster age of 100 Myr is given on the left hand-side of the (I,I − K) CMD. In each CMD, the solid line represents our bluest selection, i.e. for an age of 150 Myr, that maximizes the number of candidates. All the objects redder than this line on the (I, I − z) CMD have been identified as very low mass star and brown dwarf candidates. Sources with I − K bluer than the solid line in the (I,I − K) CMD have then been rejected and are shown as open circles. Furthermore, candidates with optical spectroscopy consistent with cluster membership are shown as filled triangles (open triangles if not consistent).
fit of BL-29 profile is obtained for log g = 4.5. This indicates that this object is likely a cluster member. We did this analy-sis for all the candidates for which we have a spectrum with a good enough signal to noise ratio to estimate their surface gravity. When possible we also measure the equivalent width of the Hαemission line (6563Å), indicative of chromospheric activity. All the results are indicated in Table 4.
All the candidates observed spectroscopically are late M dwarfs which confirms that the contamination by galaxies or
red giants is indeed very low. CFHT-BL-44 has an earlier PC3 spectral type and a hotter effective temperature than the other candidates of similar I-magnitude. Moreover its surface gravity is too large to be a cluster member. It is most likely a fore-ground field dwarf. We suspect CFHT-BL-28 is also a field dwarf for the same reasons (slighty earlier PC3 spectral type and hotter temperature) even though the analysis of the Na profile did not provide a definitive result. CFHTBL34 and -41 have a later spectral type and a lower temperature than
ex-Fig. 7. FORS2 spectra of CFHT-BL VLM candidates whose number is given above each spectrum on the left hand side.
pected from their I-magnitude and both I − z and I − K colours redder than the NEXTGEN isochrone. Their surface gravity is low and consistent with cluster membership and we therefore believe these two objects are cluster binaries. Note that three other objects (CFHT-BL-52, -53, -54) are also suspected to be cluster binaries from their location above the isochrone in the infrared CMD but we could not get any spectra as they are too faint.
Between I = 18.5 and 20, three objects out of 34 photo-metric candidates have been identified as non-members, either because of their infrared colour (CFHT-BL-47) or because of their spectroscopic properties (CFHT-BL-28 and 44). Eight ob-jects do not have any follow-up observation, neither K pho-tometry nor spectroscopy, and we cannot conclude on their na-ture. This yields a contamination level between 10 and 30%, in agreement with the statistical estimate given above. We can
refine this analysis if we note that all the objects without any follow-up have about the same I − z ≃ 0.74 and form a small group in the CMD (see Fig. 5), slighty bluer than the can-didates that are confirmed spectroscopically. Three other ob-jects that have infrared follow-up lie also in this group. All of them are bluer than the 100 Myr (and sometimes also than the 150 Myr) isochrone in I − K, and one is a non-member (CFHT-BL-28) based on its spectroscopy. Therefore the con-tamination level in this subgroup is probably high, larger than 50%, which gives a total contamination level around 20-30% for I = 18.5 ≤ I ≤ 20.
We can use the same argument to estimate the number of contaminants in the magnitude range I = 21 − 22.2 corre-sponding to our sample completeness limit. We do not have any K-band photometry for nine objects that are amongst the bluest (I − z ≃ 1.0) candidates in this region of the (I, I − z)
Fig. 8. LRIS spectra of CFHT-BL VLM candidates.
CMD. Considering that about half of the objects with I − z = 1.05 − 1.10 have been identified as non-members (CFHT-BL-73, -79, -84, -95, -96) and that there is no contaminant amongst the redder objects, we expect that about five or more of these blue candidates are field dwarfs.
As for the short exposures, we did the full analysis for both selections based on the 100 Myr and 150 Myr isochrones re-spectively. The number of estimated contaminants and of prob-able cluster members per magnitude bin in the long-exposures images is summarized in Table 5 for each age.
3.3. Spatial distribution
Now that we have identified the cluster member candidates with 0.03M⊙ ≤ m ≤ 0.6M⊙ in the survey, we need to study their spatial distribution. It is necessary to check whether mass
segregation has occured in the cluster in order to take it into account when determining the mass function.
Figure 11 shows the spatial distribution of the low mass star candidates selected in the short exposures when assuming a cluster age of 150 Myr. Using the kernel method described by Silverman (1986) we estimated the isodensity contours. The peak of the distribution allows us to determine the coordinates of the cluster center: α0 = 0h04m1.2s, δ0 = −30◦12′. This
is about 0.3◦ away from the nominal center given by Lyngå (1987) but close to the recent estimate given by Kharchenko et al. (2005) who used the maximum of the projected stellar density as the definition of the cluster center.
We then calculate the number of candidates per square de-gree located within each annulus R, R + dR centered on the new center (α0, δ0). The radial profiles obtained for the low
Table 4. Measurements made on the optical spectra of Blanco 1 candidates. In the few cases where an object has been observed with both FORS2 and LRIS, the two calculated PC3 values are given in column 2 and the spectral type given in column 3 has been derived using the average value. [A colon indicates uncertain detection due to low S/N ratio or blending.]
SpT from Te f f from log g from
BL- PC3 PC3 reference synthetic Hα synthetic Instrument comments
spectra spectra (K) EW(Å) spectra
16 1.26/1.27 M4.9 M5 2900 -10.0 4.8 FORS2/Keck02 22 1.33 M5.3 M5 2900 5.0 FORS2 24 1.48 M6.2 M6 2850 Keck (low s/n) 25 1.33 M5.3 M5 2850 5.0 FORS2 28 1.30 M5.1 M5 2950 5.0 FORS2 non-member ? 29 1.41 M5.8 M6 2850 5.0 FORS2 34 1.71 M7.4 M7 2700 4.5 FORS2 binary? 36 1.40/1.40 M5.7 M6 2850 -5.2 5.0 FORS2/Keck 38 1.49 M6.3 M6 2800 -6.5 4.8 Keck 41 1.77/1.71 M7.6 M8 2650 > −2.0 4.5 FORS2/Keck binary? 43 1.49 M6.3 M6 2800 4.8 FORS2 44 1.33/1.39 M5.5 M6 2850 -5.5 5.3 FORS2/Keck non-member 45 1.50/1.61 M6.6 M7 2750 -8.0 4.8 FORS2/Keck 48 1.67 M7.2 M7 2750 5.0 FORS2 49 1.73/1.62 M7.2 M7 2700 -2: 4.8 FORS2/Keck 50 1.73 M7.5 M7 2700 4.8 FORS2 51 1.65 M7.1 M7 2700 -2: 4.5 Keck (low s/n)
Table 5. Number of very low mass star and brown dwarf candidates, estimated contaminants and probable cluster members after analysis of the follow-up observations (infrared photometry + optical spectroscopy) for both selections (100 Myr and 150 Myr).
Assumed magnitude mass bin number of nb of nb of age bin (I) (M⊙) candidates contaminants probable members
18.5-19.0 0.090-0.075 14 2±2 12±3 100 Myr 19.0-20.0 0.075-0.056 15 1±1 14±2 20.0-21.0 0.056-0.041 12 1±1 11±2 21.0-22.2 0.041-0.032 29 10±4 19±5 18.5-19.0 0.104-0.086 15 3±2 12±3 150 Myr 19.0-20.0 0.086-0.065 19 3±2 16±3 20.0-21.0 0.065-0.047 12 0±1 12±2 21.0-22.2 0.047-0.037 30 10±5 20±6
and for the very low mass star and brown dwarf candidates (0.03M⊙≤ m ≤ 0.09M⊙, long exposures) are shown Figure 12. We assume that the distribution of the low mass sample contaminants is uniform and we note their spatial density ncont.
The low mass star distribution is then fitted by a King profile (King 1962) plus ncont
n(x) = k " 1 √ 1 + x − 1 √ 1 + xt #2 + ncont (3)
where k is a normalisation constant, x = (r/rc)2 and xt =
(rt/rc)2. The distance from the cluster center (α0, δ0) is r, rc
the core radius and rtthe tidal radius.
According to Pinfield et al. (1998), the tidal radius rt of a
cluster close to the Sun in a circular orbit is given by
rt =
GMc
2(A − B)2 !1/3
= 1.46 M1/3c (4)
where Mc is the cluster mass and A and B are the Oort
con-stants. Blanco 1 contains about 180 F, G and K stars (Abraham
de Epstein & Epstein 1985, Jeffries & James 1999, Pillitteri et al. 2003), i.e. about half as many as the Pleiades. If we as-sume that both clusters have the same mass distribution, then we expect Blanco 1 is about half as massive as the Pleiades and
rt(Blanco1) = 0.794×rt(Pleiades). The Pleiades tidal radius
be-ing 13.1 pc (Pinfield et al. 1998), we derive rt(Blanco1) = 10.4
pc or 2.3◦for a distance of 260 pc.
Using this value, the best fit minimizing χ2 gives n cont =
112 ± 10, k = 430 ± 40 per square degrees and rc = 0.61+0.16−0.11
degrees, i.e 2.8+0.7
−0.5pc, for the 100 Myr sample. For 150 Myr, we find ncont = 125 ± 10, k = 479 ± 43 and rc = 0.79+0.15−0.16
degrees or 3.6 ± 0.7 pc. Note that the values obtained for ncont
are consistent with the number of contaminants given in Table 2 divided by the surveyed area (2.3 sq.deg.). We find ncont= 92 ±
13 sq.deg−1 for the 100 Myr selection and ncont = 127 ± 17 sq.deg−1for the 150 Myr one. This validates a posteriori our statistical contamination estimate. We then compute the total number N of cluster members in the mass range 0.09-0.6M⊙ by integrating equation 3 for both ages and by adopting the mean value. We find N = 380 ± 50 stars (N100Myr= 343+30−35and
Fig. 9. Spectrum of BL-50 (solid line) fitted by a synthetic spectrum (dashed line) from the DUSTY models of Allard et al. (2001). The best fit gives Te f f = 2700K, which is in
agree-ment with the M7-M7.5 spectral type we find using the PC3 index or the comparison to spectroscopic standards.
N150Myr = 416 ± 37). According to table2, about 255 ± 60 of
them are present in our survey, i.e. ∼ 67%.
The radial distributions of the 49 (for the 100 Myr selec-tion) and 51 (150 Myr selecselec-tion) probable VLM & BD mem-bers remaining after analysis of the follow-up observations are also fitted by a King profile (see Fig. 12). Note that no con-stant is added to the King distributions as the samples used to plot the histograms have been corrected from the contam-ination (the candidates without any NIR photometry or optical spectroscopy are not taken into account here). The fit parame-ters corresponding to the 100 Myr selection are rc = 1.56+0.16−0.15
degrees (7.1 ± 0.7 pc) and k = 160 ± 23 sq.deg.−1. For the 150 Myr sample, we obtain rc= 1.70+0.16−0.14degrees and k = 190 ± 27
sq.deg.−1. The integration of both fits yields 104 ± 15 and 112±15 objects respectively, indicating that we identified about 47% of them in the CFH12K images. Among the 17 candidates without any follow-up observations, we estimate that ∼ 9 are probable members (see previous section). Assuming that they follow the same radial distribution, this yields a total number of 125 ± 20 VLM & BDs in the cluster.
About 47% of the Blanco 1 very low mass stars and brown dwarfs have been covered by the survey whereas ∼67% of the low mass star members are present in our study. This difference has to be taken into account when estimating the cluster mass function. It also suggests that mass segregation due to two body interactions has already occured and that Blanco 1 is dynami-cally relaxed. The relaxation time tris
tr= 0.8 √ Ncrh3/2 √ ¯ mc(log Nc− 0.3) Myr (5)
(Spitzer 1940), where Nc is the total number of cluster
mem-bers, rh the half mass radius in pc and ¯mcthe average stellar
Fig. 10. Upper panel: Comparison of the Na I doublet profile of BL-29 (solid line) with two synthetic spectra of similar Te f f
for log g = 4.5 (dashed line) and 5.0 (dot-dashed line). Lower panel: Same as before but for GJ-866 which is an older field dwarf having the same spectral type than BL-29 (M6).
mass. The crossing time tcris then given by King (1980) by
tcr= tr
31 lnNc 2
Nc
. (6)
As Nc(Blanco 1) < Nc(Pleiades), rh(Blanco 1) . 3 pc
while rh(Pleiades) = 3.66 pc (Pinfield et al. 1998), and
¯
mc(Blanco 1) ∼ ¯mc(Pleiades), we find that these two dynamical
times are smaller for Blanco 1 than for the Pleiades. In particu-lar, this yields tr(Blanco 1) ≤ 90 Myr which is smaller than its
age around 100-150 Myr. This suggests that Blanco 1 is indeed dynamically relaxed. Moreover, when complete equipartition of energy is reached, the cluster core radius varies with stellar mass as m−0.5, and we find that this is roughly the case here. For
0.0 0.5 1.0 1.5 2.0 −31.0 −30.5 −30.0 Ra Dec 0.872242 −30.232192
Fig. 11. Spatial distribution of all the cluster member candi-dates detected in the short exposures and selected from the 150 Myr isochrone. Contours of isodensity are drawn. The cross represents the peak of density and is taken as the cluster center whose coordinates are (0.87,-30.2) in degrees.
both ages, we find rc = (1.6 ± 0.2) ¯m−0.5in pc where ¯m is the
mean mass of the sample (∼ 0.3 for low mass stars and 0.05M⊙ for VLMs & BDs).
3.4. Mass function
The number of probable Blanco 1 members per I-magnitude bin is given in Tables 2 and 5, last column. In order to estimate the cluster system mass function – multiple systems are not re-solved at the distance of the cluster – we first convert the mag-nitude bin to a mass bin using the 100 Myr or 150 Myr mass-magnitude relationship from the NEXTGEN models (Baraffe et al. 1998) for I ≤ 20.0 and DUSTY models (Chabrier et al. 2000) for I ≥ 21.0. The obtained mass ranges are indicated in Table 2 and 5, second column. Then we divide the number of probable members by a correction factor corresponding to the percentage of low mass stars and brown dwarfs covered by our survey (i.e. respectively 0.65 and 0.48).
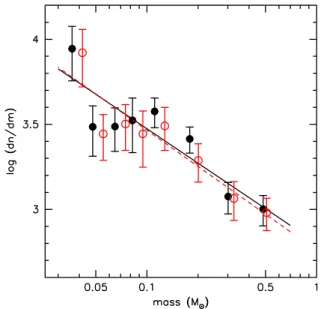
The total number of cluster systems per unit mass is thus derived over a continuous mass range from 0.03 to 0.60M⊙and is shown in Fig. 13. In this mass domain, the mass function can be fitted by a single power-law dn/dm ∝ m−α. A linear regression through the data points yields α = 0.67 ± 0.14 for the 100 Myr sample and α = 0.71±0.13 for the 150 Myr sample where the uncertainty is the 1σ fit error. (In this representation, Salpeter’s IMF corresponds to α = 2.35.)
At larger masses, we completed our study with data from the literature. Pillitteri et al. (2003) established a list of reliable cluster members based on proper motion measurements. Their sample contains objects with mass ranging from 3M⊙down to
∼ 0.2M⊙but is not complete below ∼ 0.4M⊙. Using the mass
Fig. 12. Radial distribution of the low mass star candidates (upper panel) and the VLM & BD probable cluster members (lower panel). The cluster center has been estimated using the isodensity contours (Fig. 11). In both cases, the filled dots and solid histogram represent the 100 Myr sample while the empty dots and dashed line histogram correspond to the 150 Myr sam-ple. The best χ2fit of a King profile is given for each histogram.
Fig. 13. The Blanco 1 system mass function across the stel-lar/substellar boundary. Note that all the data points are derived from the same survey, using short exposures for the stellar do-main and long exposures for the substellar regime. This pro-vides a consistent determination of the slope of the cluster’s mass function in the mass range from 0.030 to 0.6M⊙. The data points are fitted by a power law dn/dm ∝ m−α with an index α = 0.67 ± 0.14 for the 100 Myr sample (solid line) and
estimate given in their paper (table A1)3, we compute the num-ber of objects per unit mass and multiply it by a constant, so that the number of stars in the range 0.4-0.6M⊙is the same as the one we derive from our survey. On the whole mass range, from about 30 Jupiter masses to 3M⊙, the Blanco 1 system mass function corrected for contamination is reasonably well fitted by a Scalo-like log-normal distribution
ξL(m) = dn d log m∝ exp " −(log m − log m0) 2 2σ2 #
where m0 corresponds to the peak of the distribution and σ
represents its width (see Fig. 14). A χ2fit gives m
0 = 0.34 ±
0.05M⊙, σ = 0.58 ± 0.06 for the 100 Myr sample, and m0 =
0.38 ± 0.05M⊙, σ = 0.58 ± 0.06 for the 150 Myr sample. By integration of the log-normal fit, we find a total number of brown dwarf systems (m = 0.01 − 0.072M⊙) in the cluster of about 95 (85), for ∼ 660 (690) stars in the mass range 0.072 − 3M⊙4, which yields a ratio of about 15% (12%) for the 100 Myr (resp. 150 Myr) sample. The cluster total mass is ∼ 410M⊙for an age of 100 Myr (∼ 450M⊙for 150 Myr) with a substellar contribution corresponding to only ∼ 1%. The stellar mass of the Pleiades is 735M⊙(Pinfield et al. 1998), which confirms a
posteriori our initial assumption of Blanco 1 being about half
as massive as the Pleiades. From equations 5 and 6, we find
tr .60 Myr and tcr .15 Myr, which indicates that the cluster
is dynamically relaxed indeed.
4. Discussion
Blanco 1 has an age similar to, or a little older (Panagi et al. 1997) than, the Pleiades but it is less dense (about 30 stars/pc2
against ∼ 65 stars/pc2), about half as massive and has
a different abundance pattern (Ford, Jeffries & Smalley 2005). Comparing the mass functions of these two clusters thus allows us to test the dependence of the IMF on environmental condi-tions, especially as they have been obtained from similar data sets and analysed in the same way. Both mass functions are plotted on Figure 14. The Pleiades MF is from Moraux et al. (2003), their data points are between 0.03M⊙and 0.5M⊙and the log-normal fit goes from 0.03M⊙to 3M⊙.
As seen from both Figures 13 and 14, the Blanco 1 mass function does not depend much on its exact age. The results are similar within the uncertainties. In the following we will do the comparison with the Pleiades MF for the 100 Myr Blanco 1 MF only but the conclusions remain valid for 150 Myr.
A quick look at Figure 14 is sufficient to note that the over-all shapes of the Pleiades and Blanco 1 MF are very similar. Both mass functions can be fitted by a log-normal distribu-tion with a characteristic system mass around m0 ≃ 0.3M⊙and
σ ≃ 0.5. It is interesting to add that this is also the case for a 3 Note that the authors used an age of 100 Myr to estimate masses
but using 150 Myr instead would not change the results in this mass range. This is not the case however at lower mass where the 100 Myr and 150 Myr mass-magnitude relationships differ.
4 Note that the upper mass limit is imposed by the highest mass
cluster member with m ∼ 3M⊙ (M(bol) = −0.74; Westerlund et al.
1988).
Fig. 14. The mass function of Blanco 1, from low mass brown dwarfs to the most massive stars, fitted by a log-normal dis-tribution (solid line and dashed line for the 100 Myr and 150 Myr sample respectively). The large filled (100 Myr sample) and open (150 Myr sample) dots are our data points completed in the more massive star domain by Pillitteri et al. (2003) data (open squares). The Pleiades mass function (data points and log-normal fit from Moraux et al. 2003) is shown for compari-son (see Section 4).
large number of star forming regions and other open clusters, as well as for the system galactic disk mass function down to 0.1M⊙ at least (see Chabrier 2003). This suggests either that the IMF does not depend much on environmental conditions or that star formation occurs only for a narrow range of local parameters as discussed in section 4.2.
4.1. The M7/8 gap
By looking at the Blanco 1 and Pleiades data points, we also notice that for both clusters the point around 0.035M⊙is much above the log-normal fit. This cannot only be due to an un-derestimate of the contamination in this mass range as it is taken into account in the error bar. It is as if the IMF rises again below 0.04M⊙. Similarly, Muench et al. (2002) found a significant secondary peak close to the deuterium limit in the Trapezium IMF. However, the fact that this feature does not occur around the same mass but the same spectral type (later than M8) brought Dobbie et al. (2002) to suggest that this is not real. They argue instead that this structure reflects a sharp local drop in the luminosity-mass (L-M) relationship due to the on-set of dust formation in the atmosphere around Te f f = 2700 K.
A change in the slope of the L-M relationship implies that the mass of objects with spectral type later than M7-M8 may be significantly underestimated by the current NextGen and Dusty models. Thus, the number of objects in the lower mass bin may be overestimated, resulting in an artificial secondary peak in the IMF.
By applying the empirical magnitude-mass relation given by Dobbie et al. (2002; their Fig.3) to the Blanco 1 and Pleiades luminosity function, we find that the lowest mass point goes down for both MFs whereas higher mass points go slightly up (see Fig. 15), following nicely the log-normal fit. Even if this dust effect has still to be investigated, we consider the log-normal distribution is a good approximation to the observed MF, including in the substellar domain down to 30 Jupiter masses.
Fig. 15. The Blanco 1 and Pleiades mass function obtained af-ter applying the empirical magnitude-mass relation given by Dobbie et al. (2002). The open squares are the data points which have been modified while the filled circles are the data points which did not change. The log-normal fit for each cluster is shown as a solid line.
4.2. Dependency of the IMF on environmental conditions
With an age of about 100 Myr, the Blanco 1 and Pleiades clus-ters are already dynamically evolved in the sense that they are well relaxed and that mass segregation has occured. However they are still young enough as not to have lost many objects. Adams et al. (2002) estimated that only ∼ 10% of the pri-mordial low mass star population has been lost in the Pleiades, which has been confirmed by other studies combining numer-ical simulations with observations (e.g. Moraux, Kroupa & Bouvier, 2004). Therefore we can assume that the present day mass functions discussed here represent well the IMF for both clusters.
We have already mentioned that, despite the different local parameters (stellar density, abundance pattern), these 2 IMFs are similar within the uncertainties over 2 decades in mass. This seems also to be the case for other young open clusters such as Alpha-Per (∼ 80 Myr, Barrado et al. 2002), IC2391 (∼ 50
Myr, Barrado et al. 2004a), NGC2547 (∼ 30 Myr, Jeffries et al. 2004) or IC4665 (∼ 30 Myr, De Wit et al. 2006). One could ar-gue that only one “type” of clusters, rich and compact enough, can survive several tens of Myr. Therefore they cannot be very different initially and it is not very surprising to find a similar IMF. However most of the studied star forming regions (λ-Ori, Barrado et al. 2004b; IC348, Luhman et al. 2003a; Trapezium, Muench et al. 2002; σ-Ori, B´ejar et al. 2004) also present sim-ilar IMF’s within the uncertainties. Again, it is true that they are all fairly rich but even in Taurus, a much sparser region, re-cent results from Guieu et al. (2006) seem to indicate that the IMF is not very different (but see also Luhman et al. 2003b and Briceno et al. 2002 for a differing view). Probably even more remarkable is the similarity with the galactic disk mass function (Chabrier 2003) – although uncertainties remain in the substel-lar domain – as field stars come from a substel-large variety of envi-ronments, from small groups with Nstar < 10 to rich clusters
(e.g. Allen et al. 2006). All these results suggest that the IMF, from the substellar regime to the high mass domain, is similar in all studied regions. The fact that the IMF does not seem to depend much on the environment brings strong constraints on star formation theories. To date, two main models (turbulent fragmentation and accretion/ejection) are proposed to explain the origin of the IMF; they are discussed below.
4.2.1. Turbulent fragmentation
Turbulent fragmentation can generate a distribution of density structures in molecular clouds due to supersonic shocks that compress the gas. Multiple compressions result in the forma-tion of sheets and then filaments, whose density and width are due to the MHD shock conditions. High velocity shocks produce high density but thin filaments resulting in low-mass clumps, whereas low velocity shocks produce low-density but large clumps which account for high mass objects. Using the power spectrum of velocities from numerical simulations of turbulence, Padoan & Nordlund (2002) derive a clump mass distribution resulting in a IMF slope which closely matches Salpeter’s. At lower masses however, only a fraction of these clumps are sufficiently dense to be unstable which results in a flattening and a log-normal shape in the substellar regime.
A major success of this model is that it is able to repro-duce directly the observed prestellar core distribution (Motte & Andr´e 2001) which resembles effectively the stellar IMF at least down to 0.1M⊙. However, how the clump spectrum trans-lates into the stellar mass distribution is not fully understood. In particular, it is very likely that the higher mass clumps will sub-fragment into smaller clumps and form several stars. Moreover, SPH simulations find that most of the small cores are unbound and do not collapse to form stars (Klessen et al. 2005).
An important result of the turbulent fragmentation model is that the shape of the IMF depends on the turbulence via the Mach number or the power spectrum (Ballesteros-Paredes et al. 2006, Goodwin et al. 2006) but also on the molecular cloud density (see Padoan & Nordlund 2002, their fig. 2). This is easy to understand using simple considerations. Typically, a denser cloud forms denser but smaller clumps yielding a larger
num-ber of low mass cores. Conversely, at lower density, the mass function peaks at higher mass. This result concerns the core mass function and it is not completely clear yet how this will affect the stellar IMF. However it is reasonable to think that the trend will be the same, which is in contradiction with the observed invariance of the IMF.
4.2.2. Accretion/ejection paradigm
Another model which has been developed to explain the origin of the IMF origin of the IMF gives less importance to turbu-lence and more to gravity. According to Bate & Bonnell (2005), the role for turbulence is to generate structure in molecular clouds which provides the seeds for gravitational fragmentation to occur down to the opacity limit. Stellar masses are then set by a combination of accretion and dynamical ejections which terminate the accretion. In their model based on the results of hydrodynamical SPH calculations, all the objects begin with a mass corresponding to the opacity limit (∼ 0.003M⊙) and grow by accretion until they are ejected from the dense core by dynamical interactions in unstable multiple systems. The ob-jects that end up as brown dwarfs stop accreting before they reach stellar masses because their are ejected soon after their formation. In contrast the higher mass stars are the objects that remain in the dense gas and accrete for longer. The accretion rates of individual objects are drawn from a lognormal distri-bution and the dynamical ejection of protostars from a multiple system is described using a characteristic time-scale. Taking values for these parameters from the hydrodynamical simula-tions, the model is able to reproduce a reasonable IMF in the tellar domain but produces more brown dwarfs than are actu-ally observed.
In the accretion/ejection model the characteristic (median) mass of the IMF is approximatively given by the product of the typical accretion rate and the typical time-scale for dynamical ejection. Bate & Bonnell (2005) and Bate (2005) found that that the characteristic mass varies linearly with the mean thermal Jeans mass MJeansand depends therefore on both density ρ and
temperature T . As MJeansis smaller at higher density, the mass
function is expected to peak at smaller mass. Indeed in a denser cloud dynamical ejections are more likely to occur, yielding the formation of a larger number of low mass stars. Variations of the IMF in different environments should then occur in the location of the peak and in the substellar regime, which is not supported by observations.
4.2.3. Thermal physics
The two main models developed to explain the origin of the IMF predict a dependence of the IMF on the environment, in particular on the density and temperature of the molecular cloud via the thermal Jeans mass and/or turbulence.
Observational results however indicate that the IMF is sim-ilar in many regions from the substellar regime up to the mas-sive star domain. This suggests that either the global properties of all the molecular clouds in which cluster and field stars form are very similar – which seems very unlikely – or that the
phys-ical process for fragmentation by itself imposes specific local conditions. Larson (2005) has suggested that thermal physics in molecular clouds may play this role as it can yield a Jeans mass of order ∼ 1M⊙at the point of fragmentation independently of the exact initial conditions. This results from how the cooling rate changes with density. At lower densities the gas cooling is dominated by atomic and molecular line emission whereas at higher densities the gas is coupled to the dust and dust cooling dominates. This results in a barotropic equation of state involv-ing a coolinvolv-ing term at low densities followed by a gently heatinvolv-ing term once dust cooling prevails. When used in numerical cal-culations, this equation of state can set the characteristic mass scale for fragmentation and produce a realistic IMF (Jappsen et al. 2005, Bonnell et al. 2006a).
A prediction of thermal physics is that a different metallic-ity may yield a different IMF as the cooling equation of state is modified. If a molecular cloud is more metal rich, the cooling is more efficient and the temperature is smaller. Therefore MJeans
is smaller and the characteristic mass is shifted towards the lower mass. However, the thermal physics invoked by Larson (2005) links density and temperature. Thus for a higher metal-licity, the Jeans mass occurs at lower T but also lower ρ and whether it should be larger or smaller is not clear yet. It is therefore premature to give any trend for the dependency of the IMF on metallicity but it could be a good observational test to measure and compare the mass function of stellar clusters with different metallicity.
4.2.4. An hybrid model ?
Bonnell et al. (2006b) have suggested an “hybrid” model to explain the origin of the mass distribution. Turbulence is nec-essary to generates the filamentary structure in the molecular clouds which facilitates fragmentation. Thermal physics sets the mean Jeans mass for gravitational fragmentation which corresponds to the characteristic stellar mass of the IMF. The broad peak can then be understood as being due to the disper-sion in gas densities and temperature at the point where frag-mentation occurs. The higher mass part is due to the continued competitive accretion in dense cores while the lower mass IMF is ascribed to fragmentation and then ejection. Some of the col-lapsing regions, especially in filaments and circumstellar discs, sub-fragment due to the increase of gas density. The lower mass clumps are ejected soon after they form from their natal envi-ronment by dynamical interactions, stop accreting and remain low mass objects (very low mass stars and brown dwarfs).
This model seems to work at reproducing a realistic stel-lar IMF as the location of the peak and the higher mass part do not vary with initial conditions as shown by Bonnell et al. (2006a). However some issues remain in the substellar domain. In particular, the lower mass part of the IMF is still expected to depend on the initial density – denser clouds enhance dynam-ical ejections and thus form more brown dwarfs – which is in contradiction with the current observations.