HAL Id: hal-03060155
https://hal.archives-ouvertes.fr/hal-03060155
Submitted on 21 Dec 2020
HAL is a multi-disciplinary open access
archive for the deposit and dissemination of
sci-entific research documents, whether they are
pub-lished or not. The documents may come from
teaching and research institutions in France or
abroad, or from public or private research centers.
L’archive ouverte pluridisciplinaire HAL, est
destinée au dépôt et à la diffusion de documents
scientifiques de niveau recherche, publiés ou non,
émanant des établissements d’enseignement et de
recherche français ou étrangers, des laboratoires
publics ou privés.
genes involved in adrenocortical carcinoma
aggressiveness
Houda Tabbal, Amandine Septier, Mickael Mathieu, Coralie Drelon,
Stéphanie Rodriguez, Cyril Djari, Marie Batisse-Lignier, Igor Tauveron,
Jean-Christophe Pointud, Isabelle Sahut-Barnola, et al.
To cite this version:
Houda Tabbal, Amandine Septier, Mickael Mathieu, Coralie Drelon, Stéphanie Rodriguez, et al..
EZH2 cooperates with E2F1 to stimulate expression of genes involved in adrenocortical
carci-noma aggressiveness. British Journal of Cancer, Cancer Research UK, 2019, 121 (5), pp.384-394.
�10.1038/s41416-019-0538-y�. �hal-03060155�
ARTICLE
Genetics and Genomics
EZH2 cooperates with E2F1 to stimulate expression of genes
involved in adrenocortical carcinoma aggressiveness
Houda Tabbal1, Amandine Septier1, Mickael Mathieu1, Coralie Drelon1, Stéphanie Rodriguez1, Cyril Djari1, Marie Batisse-Lignier1,
Igor Tauveron1,2, Jean-Christophe Pointud1, Isabelle Sahut-Barnola1, Bruno Ragazzon3, Guillaume Assié3, Jérôme Bertherat3,
Anne-Marie Lefrançois-Martinez1, Antoine Martinez1and Pierre Val1
BACKGROUND: EZH2 is overexpressed and associated with poor prognosis in adrenocortical carcinoma (ACC) and its inhibition
reduces growth and aggressiveness of ACC cells in culture. Although EZH2 was identified as the methyltransferase that deposits the
repressive H3K27me3 histone mark, it can cooperate with transcription factors to stimulate gene transcription.
METHODS: We used bioinformatics approaches on gene expression data from three cohorts of patients and a mouse model of EZH2 ablation, to identify targets and mode of action of EZH2 in ACC. This was followed by ChIP and functional assays to evaluate
contribution of identified targets to ACC pathogenesis.
RESULTS: We show that EZH2 mostly works as a transcriptional inducer in ACC, through cooperation with the transcription factor E2F1 and identify three positive targets involved in cell cycle regulation and mitosis i.e., RRM2, PTTG1 and ASE1/PRC1.
Overexpression of these genes is associated with poor prognosis, suggesting a potential role in acquisition of aggressive ACC features. Pharmacological and siRNA-mediated inhibition of RRM2 blocks cell proliferation, induces apoptosis and inhibits cell migration, suggesting that it may be an interesting target in ACC.
CONCLUSIONS: Altogether, these data show an unexpected role of EZH2 and E2F1 in stimulating expression of genes associated with ACC aggressiveness.
British Journal of Cancer (2019) 121:384–394; https://doi.org/10.1038/s41416-019-0538-y
BACKGROUND
Adrenocortical carcinomas (ACC) are endocrine malignancies associated with dismal prognosis. At diagnosis, 80% of patients present metastases reducing the 5 years survival rate below 30% for most series.
Although clinical management relies on complete surgical resection and mitotane treatment alone or in combination with chemotherapy, surgery remains ineffective in patients with
metastatic disease.1It is thus essential to identify the contributors
of malignancy in order to develop more effective therapeutic approaches.
Molecular analyses have shown three molecular mechanisms predominantly altered in ACC. These alterations include inactivat-ing mutations of the TP53 gene associated with loss of
heterozygosity of the locus in 25–35% of ACC,2,3suggesting that
P53 is involved in ACC pathogenesis. Consistent with this idea, inactivation of both P53 and RB in the adrenal cortex of mice expressing the simian virus 40 (SV40) large T antigen (AdTAg mice)
results in metastatic ACC development.4 Other frequent
altera-tions found in ACC result in overexpression of IGF2 (90% of ACC)
and constitutive activation of the Wnt/β-catenin signalling
path-way (about 40% of ACC).2,3 However, using transgenic mouse
models, we have shown that these alterations, even when
combined together, were not sufficient to induce malignant
progression,5–7indicating that further alterations are required to
allow ACC progression.
Screening of epigenetic factors in publicly available
transcrip-tome data from ACC patients identified the histone
methyltrans-ferase EZH2 as the most deregulated histone modifier in adrenal
cortex cancer. We have also shown that EZH2 overexpression was
associated with tumour progression and poor prognosis in ACC8in
agreement with other cancers.9Overexpression of EZH2 in ACC
patients was also consistent with the high expression of EZH2
detected in AdTAg mice during tumour progression.4
Although EZH2 was initially described as the catalytic core protein of the polycomb repressive complex 2 (PRC2), initiating
target genes silencing by promoting H3K27 trimethylation,10
emerging literature suggests that EZH2 can work as a transcrip-tional activator by directly interacting with transcription factors,
such as STAT3 and AR.9,11,12
In this paper, we show that EZH2 is essentially associated with stimulation of transcription and that this positive effect is the result of a functional cooperation between EZH2 and the transcription factor E2F1 in ACC. We further show that this interaction results in the upregulation of three genes implicated in cell cycle regulation and mitosis i.e., RRM2, PTTG1 and Ase1/PRC1,
Received: 7 March 2019 Revised: 3 July 2019 Accepted: 11 July 2019 Published online: 31 July 2019
1
CNRS, UMR 6293, GReD, Inserm U1103, Université Clermont Auvergne, 63001 Clermont-Ferrand, France;2Centre Hospitalier Universitaire, Service d’Endocrinologie, Faculté de Médecine, 63000 Clermont-Ferrand, France and3
Institut Cochin, Inserm U1016, CNRS UMR 8104, Université Paris Descartes UMR-S1016, 75014 Paris, France Correspondence: Pierre Val (pierre.val@uca.fr)
These authors contributed equally: Houda Tabbal, Amandine Septier
that are associated with poor prognosis, suggesting a potential role in acquisition of aggressive ACC features. Interestingly, pharmacological and siRNA-mediated inhibition of RRM2 blocks cell proliferation, induces apoptosis and inhibits cell migration, suggesting that it may be an interesting target in ACC. Altogether, these data show an unexpected role of EZH2 and E2F1 in
stimulating expression of genes associated with ACC
aggressiveness.
METHODS Patients cohorts
The clinical datasets used in this paper are derived from three cohorts of patients. Cochin’s cohort (47 ACC, 41 ACA and 4 NAd,
GSE492802) and Michigan’s cohort (33 ACC, 22 ACA and 10 NAd,
GSE1092713), were analysed by Affymetrix microarray (HG-U133
Plus 2.0 and HG-U95Av2, respectively). Data analysed were provided by our collaborators after RMA normalisation and inter-array normalisation. The third transcriptome (74 patients) is from
the TCGA database (The Cancer Genome Atlas,3) and it relies on
Illumina HiSeq 2000 RNA Sequencing Version 2. Expression data were standardised by the Relative Standard Error of the Mean (RSEM) algorithm and transformed into Log2 in order to refocus
and symmetrise values’ distribution. For each cohort, patients’
survival data were available and distribution in the good (C1B) and
poor prognosis (C1A) groups, was defined by our collaborators on
the basis of unsupervised clustering.14 Datasets were treated
independently and intersected on the basis of gene names. Microarray analysis of gene expression
Transcriptome data from our mouse model of Ezh2 ablation (Ezh2-KO) in the adrenal were obtained and analysed as described in
Mathieu et al.15
Expression data analyses process
Correlation analyses were conducted in R using cor.test with
parameter method=‘pearson’ (package stats v3.4.2). Significance
was calculated using the method previously described and
adjusted using the Benjamini-Hochberg correction (‘p.adjust’
function).
Survival curves were obtained by the Kaplan–Meier method
(package‘survival’ v2.41-3), which allows evaluation of significance
for the outcome prediction model, based on mRNA expression. Differences between survival curves were assessed using the log-rank test.
Univariate and multivariate Cox proportional hazards regression analyses were performed to evaluate the association of gene expression levels and prognostic factors to overall patients’ survival.
Enrichment analyses were conducted by GSEA v3.0 software
(http://software.broadinstitute.org/gsea/index.jsp). cPRC2 gene
sets were previously defined in Mathieu et al.15
Chip sequencing datasets
Chip sequencing data were obtained from various published sources and were downloaded from Gene Expression Omnibus (GEO) or Encyclopedia of DNA Elements (ENCODE) (Supplemen-tary Table 1).
Chip sequencing analyses process
All data were retrieved in .sra format and converted to .fastq (except for the E2F1 mark of the K562 cell line) using fastq-dump tool (v2.1.7). The reads were aligned on the reference genome GRCh38 using bowtie2 software (v2.2.6, default parameters). The
resulting .samfiles were converted to .bam and then sorted using
samtools (v0.1.19). Specific peaks detection and identification of studied marks were obtained by Macs14 software (v1.4.2) (J Feng et al., 2012 protocol). To eliminate redundant reads densities,
normalisation was carried out using input during software setup. Annotations for peaks with an FDR < 0.05 were performed under R
with the‘GenomicRanges’ package (v1.28.5), taking into account
a ±2 Kb window around the CDS (coding DNA sequence). To
illustrate the peaks, .wigfiles obtained through Macs14 software
were converted to .Bigwig files using the wigToBigWig tool
delivered by UCSC (http://hgdownload.soe.ucsc.edu/admin/exe/).
Peaks were visualised with IGV software (version 2.3.91). Measure of cell growth and apoptosis
H295R cells were cultured as previously described8 and cell
growth rate was determined as described in Drelon et al.8 For
knockdown experiments, cells were counted 5 days after thefirst
round of siRNA transfection. For pharmacological inhibition, cells were counted 5 days after initiation of treatment. These experiments were repeated at least four times with triplicate samples. Cell cycle distribution was determined by analysing
propidium incorporation byflow cytometry. At least 20,000 events
were measured for each sample. These experiments were repeated three times with triplicate samples. Caspase 3 activity
was measured as described in Drelon et al.8
Transfections and treatments
siRNA-mediated EZH2 and E2F1 knockdown was performed as
previously described.8siRNA sequences were: siGFP:
ACUACCAG-CAGAACACCCCUU; siEZH2: Silencer Select (s4917, Ambion Life Technologies); siE2F1 (sc-29297, Santa Cruz Biotechnology) and
siRRM2 (106532, Thermofisher). For pharmacological RRM2
inhibi-tion, H295R cells were treated with increasing doses (1, 2.5, 5, 7.5, 10, 12.5, 15) of GW8510 (G7791, Sigma) for 5 days in complete culture medium, which was changed every 24 h. Likewise, for pharmacological EZH2 inhibition, H295R cells were treated with 5 µM of DZNep (102052-95-9, Cayman Chemical) for 24–72 h in complete culture medium, which was changed every 24 h. Mitotane (Sigma-Aldrich) treatment was conducted in a similar way with 10 or 20 µM doses. In all experiments, control cells were treated with equivalent amounts of DMSO.
Migration and clonogenic growth assays
Wound healing assays were performed as previously described.8
Invasion analyses were performed using Boyden chambers (Millicell) with 8 µm pore-sized membranes, coated with Matrigel
(BD Bioscience). Control or GW8510 treated H295R cells (2.5 × 10⁵
cells) were seeded in the upper chamber in minimum medium DMEM-F12 medium (Invitrogen) containing
penicillin/streptomy-cin (100 mg ml−1) and L-glutamine (2 mM). The lower chamber
contained DMEM-F12 medium (Invitrogen) supplemented with
penicillin/streptomycin (100 mg ml−1), L-glutamine (2 mM), 10%
FBS (Biowest) and 5% SR3 (S2640, Sigma). Cells were incubated for
48 h beforefixation using Paraformaldehyde 4% and staining with
Haematoxylin. Clonogenic growth assays were performed as
described in Drelon et al.8
Protein extraction and western blot analyses
Western blots were performed as previously described16 and
proteins were detected with antibodies described in Supplemen-tary Table 2.
Real-time quantitative PCR
RTqPCR analyses were performed as in Drelon et al.8with primer
pairs listed in Supplementary Table 3. Relative gene expression
was normalised to ACTIN by theΔΔCt method.
Chromatin immunoprecipitation
ChIP experiments were performed as described in Drelon et al.8
except forfixation, which was performed by addition of 1.5 mM
ethylene glycol bis(succinimidyl succinate) (EGS) for 30 min and of 1% formaldehyde for 10 min. Antibodies used were: EZH2
385
1234567
(C15310039, Diagenode), E2F1 (05–379, Millipore) and Rabbit IgGs
(kch-504–250, Diagenode). Sequence enrichment was detected by
real-time PCR with primers designed in the regulatory regions of RRM2, PTTG1 and PRC1 (Supplementary Table 3).
RESULTS
In order to identify EZH2 target genes in ACC, we performed correlation analyses on the basis of publicly available transcrip-tome data from Cochin, Michigan and TCGA cohorts, which represented a total of 146 cancer patients. Pearson R correlation coefficients between EZH2 and all genes were computed. After determination of a false discovery rate (FDR) threshold of 0.001, we selected genes that were correlated with EZH2 in all three cohorts. These data were then represented as a heatmap in which patients were ordered as a function of EZH2 expression and genes
as a function of correlation coefficients (Fig. 1a). Unexpectedly,
most genes that passed our selection criteria were positively
correlated with EZH2 (n= 314/15701) and only a small proportion
of genes were negatively correlated (n= 11/15701, difference in
proportions F-test p value= 6.37 × 10−79) (Fig.1a, Supplementary
Table 4). Even though decreasing the stringency of our selection criteria (FDR < 0.01) increased the number of correlated genes, the proportion of positively correlated genes (653/15701) was still much higher than negatively correlated genes (172/15701, F-test
p value = 2.2 × 10⁻¹⁶). This suggested that the main mode of
action of EZH2 in ACC might not be associated with gene repression. This hypothesis was further supported by low enrichment for EZH2/PRC2 ChIP targets in the list of EZH2
correlated genes (Fig. 1b). Recent data suggest that EZH2 can
function as a transcriptional activator by associating with a number of transcription factors (TF). To gain insight into which TF may be associated with EZH2-dependent gene regulation in ACC,
we performed GSEA analysis using gene sets defined by the
presence of conserved putative TF binding motifs within their
promoters (MSigDB C3). Out of the 33 significantly enriched gene
sets (FDR < 0.01), 21 (63%) were defined by the presence of
putative E2F binding motifs (Fig. 1c). To further confirm the
involvement of E2F transcription factors in the control of these genes, we extracted and intersected leading edge genes from the 21 gene sets. This represented a list of 94 potential targets (Supplementary Table 5). These 94 genes were highly correlated with both EZH2 and E2F1 expression in the three cohorts of
patients (Fig.1d). Analysis of publicly available ChIP sequencing
data showed evidence of E2F1 binding within their regulatory regions (±2 kb from TSS) in HeLa (84/94), LM2 (80/94), Raji (78/94),
K562 (76/94), LNCaP-Abl (57/94) and MCF7 cells (34/94) (Fig.1e).
To gain insight into the potential involvement of these genes into ACC pathogenesis, we analysed patient survival as a function of the mean expression of the 94 genes (EZH2_E2F1 metagene). High expression of the metagene was associated with decreased overall survival (Cochin, TCGA) and shorter disease-free survival (Cochin) analysed as continuous variables (Wald test, TCGA O.S.
p= 3.69 × 10⁻⁵, Cochin O.S. p= 2.74 × 10⁻³, Michigan O.S. p=
0.036, Cochin D.F.S. p= 3.33 × 10⁻³) or after dichotomisation
according to median of expression (Fig. 1f). Cox proportional
hazards regression analysis was then performed to further
evaluate significance of high expression of EZH2_E2F1 metagene
in predicting death. In this analysis, metagene expression, prognosis group (C1A vs C1B), expression of MKI67 (high vs
low), Weiss score (4–9 vs 0–3) and ENSAT staging (3–4 vs 1–2)
predicted overall survival as univariates in TCGA and Cochin cohorts (Supplementary Table 6). Metagene expression remained
significant in most multivariate models but did not increase
predictive power of other parameters (Supplementary Table 6). In further support of a potential role of the genes composing the metagene in ACC aggressiveness, we observed higher expression
in the group of poor prognosis in the three cohorts (Fig.1g) and in
CIMP intermediate and CIMP high as well as in CoC II and CoCIII
clusters of clusters (TCGA, Fig.1h).
Altogether, these data suggested that EZH2 might positively control expression of genes involved in ACC aggressiveness, through positive interaction with the E2F family of TF. To further
refine the list of relevant EZH2 targets in the adrenal gland, we
made use of transcriptome data obtained by analysis of a mouse
model of adrenal-specific Ezh2 knockout. This model, which relies
on excision of Ezh2 exons 16 to 19 by Sf1:Cre mediated
recombination was recently characterised.15Comparison of gene
expression in three control and four knockout adrenals showed significant deregulation of 348 genes (FDR < 0.1, Abs(LogFC) > 1.0)
upon inactivation of Ezh2 (Fig.2a). In this physiological context,
Ezh2 ablation was essentially associated with gene overexpression
(Fig.2a) and positive enrichment of PRC2 target genes (Fig.2b).
This suggested that the main mode of action of EZH2 differed between normal and cancer cells in the adrenal gland. However,
intersection of human and mouse data (Fig. 2c) resulted in the
identification of RRM2, PTTG1 and PRC1 as three potential positive
targets of EZH2 in the adrenal. Consistent with this, their
expression was significantly decreased in knockout adrenals
(Fig.2d) and was positively correlated with EZH2 and E2F1 in all
three cohorts of patients (Fig.2e and Supplementary Fig. 1A).
PTTG1 encodes Securin, a protein involved in the G2/M
transition by inhibiting separation of sister chromatids17but also
in DNA repair18and regulation of transcription.19It is a putative
oncogene in a number of tissues such as the pituitary (where it
was isolated)20and kidney21and was shown to be overexpressed
in ACC by an independent study.22
PRC1, also known as ASE1, encodes another key regulator of mitosis, which binds microtubules and is essential for the formation of the midzone bundle, central spindle organisation
and subsequent cytokinesis.23,24 It is associated with cancer
progression and WNT pathway activation in a number of
tissues.25,26 RRM2 encodes one of the small subunits of
ribonucleotide reductase (RR), the rate limiting enzyme for production of deoxyribonucleotides. RRM2 associates with RRM1 to form an active RR and its accumulation plays a central role in
controlling RR activity.27RRM2 is known to play an active role in
tumorigenesis28 and is a prognostic factor for cancers such as
colon, breast and pancreas.29–31 These data suggest that these
three genes may be involved in ACC pathogenesis and aggressiveness.
Consistent with this idea, all three genes were markedly overexpressed in ACC compared with normal adrenals and ACA
in both Cochin and Michigan cohorts (Fig.2f and Supplementary
Fig. 1B). This was further supported by the observation of higher expression of the three genes in the groups of poor prognosis in
the three cohorts of patients (Fig.2g and Supplementary Fig. 1C).
Higher expression of RRM2, PTTG1 and PRC1 was also associated with significantly lower overall survival (Cochin, TCGA, Michigan)
and lower disease-free survival (Cochin) (Fig.2h and
Supplemen-tary Fig. 1D–E). Altogether, these data suggested that EZH2
positively controlled expression of three genes associated with ACC aggressiveness.
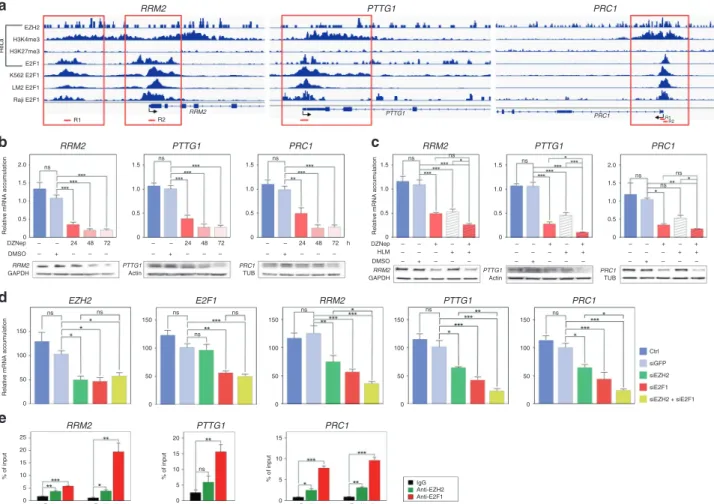
Analysis of publicly available ChIP sequencing data showed strong E2F1 binding peaks in the regulatory regions of these three
genes in HeLa, K562, LM2 and Raji cell lines (Fig.3a). Interestingly,
these E2F1 binding peaks were also associated with the H3K4me3 mark (active chromatin) and EZH2, in the absence of the H3K27me3 mark (inactive chromatin) in HeLa cells. This suggested that EZH2 and E2F1 could cooperate to activate rather than
repress, transcription of RRM2, PTTG1 and PRC1 (Fig. 3a). To
evaluate this hypothesis in adrenocortical cells, we treated H295R cells with DZNep, a compound that we previously used as an EZH2
inhibitor.8 Treatment with 5 µM DZNep for 24, 48 and 72 h
resulted in a strong reduction in the accumulation of RRM2, PRC1 and PTTG1 mRNA and protein, suggesting that EZH2 controlled 386
their expression positively (Fig.3b). To evaluate the possibility that EZH2 cooperated with E2F1 to activate gene expression, we used HLM006474 (HLM), a compound that has been shown to inhibit
E2Fs accumulation and transcriptional activity.32 Treatment with
HLM alone induced a robust dose-dependent decrease in
accumulation of RRM2, PRC1 and PTTG1 (Fig. 3c and
Supplementary Fig. 2A), which was associated with decreased accumulation of E2F1 (Supplementary Fig. 2A and D), inhibition of H295R cell growth and deregulation of cyclins expression (Supplementary Fig. 2B–C). To further assess cooperation between EZH2 and E2F1, we combined inhibition of EZH2 with DZNep and inhibition of E2F with HLM. Consistent with our previously EZH2 correlated genes expression
EZH2 expression (Z-Score)
a b c e f g h d 1.0 –0.5 4 3 2 1 0 1.0 0.8 0.6 0.4 0.2 0 1.0 0.8 0.6 0.4 0.2 0 0 100 F requency 1.0 0.8 0.6 0.4 0.2 1.0 0.5 0 –0.5 1.0 0.5 0 7.5 10 9 8 7 11 9 CIMP low Good prognosis Poor prognosis CoC I CoC ll CoC lll CIMP high CIMP intermediate TCGA 10 8 7 6 11 10 9 8 7 0 F requency F requency 1.0 0.8 0.6 0.4 0.2 0 F requency 200 Overall survival (months)
Disease free survival (months)
Overall survival (days)
D.F.S. Cochin
Cochin Michigan TCGA
EZH2_E2F1 metagene O.S. Cochin
EZH2_E2F1 metagene O.S. Michigan
EZH2_E2F1 metagene O.S. TCGA
EZH2_E2F1 metagen expression EZH2_E2F1 metagene EZH2_E2F1 metagene High: 23 cases Low: 24 cases High: 12 cases Low: 12 cases High: 37 cases Low: 37 cases Logrank test p-value = 1.2 × 10⁻³ High: 22 cases Low: 22 cases Logrank test p-value = 1.9 × 10⁻³ Logrank test p-value = 2.8 × 10⁻² 6.5 × 10⁻⁴ 7.7 × 10 –7 7.7 × 10⁻⁶ 1.1 × 10⁻³ 7.1 × 10⁻³ 0.05 0.02 Logrank test p-value = 1.4 × 10⁻⁷ 300 0 20 406080100120140 0 1000 2000 3000 4000 5000
Overall survival (days) 0 1000 2000 3000 4000
–1
TCGA Cochin Michigan
EZH2
P
e
arson's R
EZH2 expression (Z-Score) EZH2 expression
(Z-Score)
GSEA Transcription factor motifs (C3) enrichment
GSEA PRC2 enrichment
GSEA leading edge correlation
1.000 1.5 1.0 0.5 Nor m
alised enrcihment score
Nor
m
alised enrcihment score
CHENG_PLCS_MM_ES BRA CKEN_SHOR T CHENG_PLCS_HS_ES E2F1DP2_01 E2F4DP1_01 E2F1DP2_01_bis E2F4DP2_01
E2F1DP1RB_01E2F1_Q6_01E2F1DP1_01 E2F1_Q3
E2F1_Q4_01E2F1_Q3_01E2F1_Q4_01E2F_Q6_01
E2F_Q3 E2F_03E2F_01 E2F_Q4 E2F1_Q3_01 KTGGYRSGAA_UNKNO WN MYCMAX_01 MCAA TNNINNGCG_UNKNO WN RRCCGTT A_UNKNO WN GCGSCMNTTT_UNKNO WN
E2F1_Q6E2F_Q4E2F_Q6 E2F_02
CHENG_HUH7_HS_ES VELLUCHTINA_HS_ES_CB_H3_EZH2 LEE_ET_AL CHENG_HUH7_MM_ES 0 –0.5 –1.0 –1.5 –2.0 0.143 FDR q .v alue FDR q .v alue TCGA
Corr. EZH2 Corr. E2F1
Cohort
Pearson’s R
1.0 –0.26
Cochin Michigan
TCGACochin Michigan
0.157 0.6710.713 0.132 0.8290.407 0.513 0.911 0.2580.028 1.0000.855 0.6480.853 0.868 0.777
0 0 0 0 0 0 0 0 0 0 0 0 0 0 0 0 0 0 0 0 0 0 0 0 0 0 0 0 0 0 0 0 0 0 0 0 0 0 0 0 0 0 0 0 0 0 0 0 0 0 0 0 0 0 0 0 0 0 0 0 0 0 0 0 0 0 0 0 0 0.007 0 0 0 0 0 0 0 0.009
0.028 0.010 0.026
ChiP Seq analysis (94 leading edge genes)
HeLa LM2 Raji K562 LNCaP_Abl MCF7
E2F1 binding No binding
published data,8inhibition of E2F with HLM resulted in decreased expression of EZH2 (Supplementary Fig. 2D). In contrast, DZNep had no effect on E2F1 expression ruling out a direct effect of EZH2 on E2F1 expression (Supplementary Fig. 2D). Consistent with a potential positive cooperation between EZH2 and E2F1, accumu-lation of RRM2, PRC1 and PTTG1 was further decreased upon
treatment with HLM and DZNep (Fig. 3c). To further confirm
cooperation between EZH2 and E2F1, we transfected H295R cells
with siRNAs targeting EZH2 and E2F1 (Fig. 3d). Interestingly,
transfection with either EZH2 or E2F1 siRNAs decreased mRNA
accumulation of RRM2, PTTG1 and PRC1 (Fig.3d). This decrease
was further amplified by transfection of both siRNAs even though expression of EZH2 and E2F1 was not further altered by
co-transfection of the two siRNAs (Fig.3d). This further supported the
idea that EZH2 and E2F1 cooperated to stimulate expression of
these three targets. To further confirm this theory, we analysed
the binding of these two factors by chromatin
immunoprecipita-tion in H295R cells (Fig. 3e). Primer pairs used for real-time PCR
quantification of enrichment were designed in zones of coincident
EZH2 and E2F1 binding on the regulatory regions of the three
genes in HeLa cells (Fig.3a). These experiments showed significant
enrichment of E2F1 on the regulatory regions of RRM2, PTTG1 and
PRC1. This was associated with significant binding of EZH2 on the
regulatory regions of RRM2 and PRC1. Although not significant,
there was a trend for EZH2 recruitment on the regulatory regions
of PTTG1 (Fig.3e).
Altogether, our data demonstrate that EZH2 cooperates with E2F1 to induce expression of RRM2, PTTG1 and PRC1, three factors associated with ACC aggressiveness. Whereas drugs targeting PTTG1 and PRC1 are scarce, recent data have shown that RRM2
can be inhibited by compounds such as GW8510.33Interestingly,
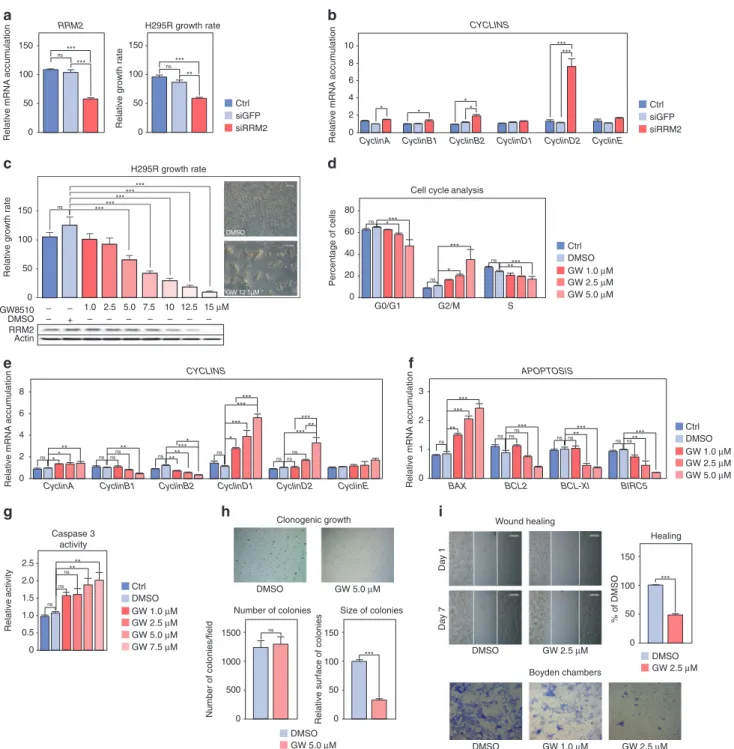
transfection of H295R cells with siRNAs targeting RRM2 resulted in
cell growth inhibition (Fig.4a). This was associated with increased
expression of genes coding Cyclins A, B2 and D2 (Fig. 4b),
suggesting that RRM2 inhibition resulted in cell cycle arrest. To further gain insight into the role of RRM2 in ACC cell growth and to evaluate its potential as a therapeutic target, we treated H295R cells with GW8510 (GW). Incubation with increasing concentra-tions of GW for 5 days resulted in a dose-dependent decrease in
RRM2 accumulation (Fig.4c), which was associated with a
dose-dependent reduction in cell growth and an almost complete absence of cells at the highest doses at the end of treatment
(Fig.4c). The growth inhibitory effect of GW at 5 µM was already
evident at day 2 of treatment and was maintained up to 5 days (Supplementary Fig. 2E). Cell cycle analysis by FACS following propidium iodide incorporation showed a dose-dependent decrease in G0/G1 and S phases and a concomitant increase in G2/M, suggesting that RRM2 inhibition resulted in G2/M arrest
(Fig.4d). Consistent with this, GW inhibited expression of Cyclins
B1/B2 and increased expression of Cyclins D1/D2 (Fig. 4e).
Interestingly, RRM2 inhibition was also associated with decreased expression of the anti-apoptotic BCL2, BCL-XL and BIRC5 genes and
increased expression of the pro-apoptotic factor BAX (Fig. 4f).
Consistent with potential induction of apoptosis, this was
associated with increased caspase 3 activity (Fig.4g).
Altogether, these data established RRM2 as a potential
therapeutic target in the context of ACC. To further confirm this
idea, we evaluated the effect of GW on the aggressive characteristics of H295R cells in culture. Consistent with its effect on cell growth, GW treatment induced a marked reduction in the size of H295R colonies growing in soft agar, even though it did not
prevent clonogenic growth per se (Fig. 4h). However, even low
doses of GW (1.0 and 2.5 µM) were associated with a significant
reduction in H295R migratory capacities as shown by wound
healing and Boyden chambers migration assays (Fig.4i).
A vast majority of ACC patients are treated with Mitotane, which induces adrenostatic effects. However, these effects are only achieved when plasma mitotane concentrations exceed 14 mg/l (equivalent to 100 µM in tissue culture), which in practice is
difficult to reach in a significant number of patients over a short
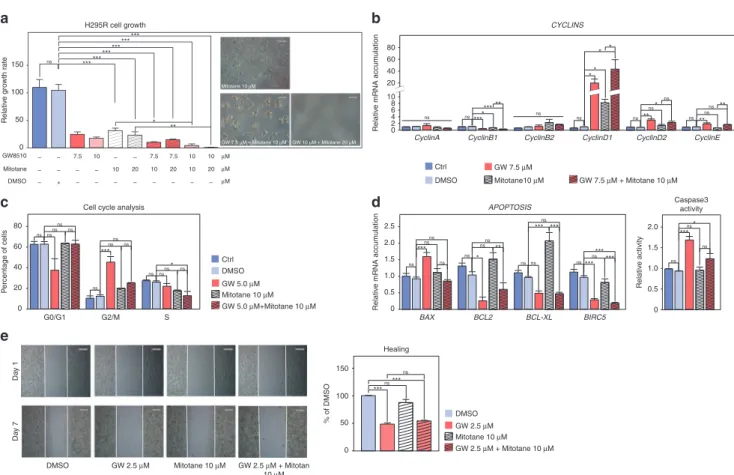
time course. We thus evaluated the potential of RRM2 inhibition to synergise with low doses of Mitotane. Interestingly,
combina-tion of 10 µM mitotane with 10 µM GW had a significant effect on
H295R cell growth compared with mitotane alone (Fig.5a). This
was further amplified by the combination of 20 µM mitotane and
10 µM GW which resulted in the death of almost all cells after
5 days of incubation (Fig. 5a). These growth inhibitory effects
were reflected in a significant effect of the combination of both
compounds on expression of CylinB1 and CyclinD1 (Fig. 5b).
However, GW alone was more efficient than the combination of both compounds to induce G2/M arrest and only mildly
enhanced the effect of mitotane on S phase arrest (Fig.5c). We
then investigated apoptosis. As expected, GW induced expres-sion of the pro-apoptotic gene BAX and inhibited expresexpres-sion of
the anti-apoptotic factors BCL2, BCL-XL and BIRC5 (Fig. 5d).
Mitotane alone had no effect on BAX, BCL2 or BIRC5 expression
and only induced BCL-XL accumulation (Fig. 5d). Accordingly,
there was no effect of mitotane alone on Caspase3 activity
(Fig.5d, right panel). Surprisingly, mitotane reversed the effect of
GW on BAX and BCL2 expression and abrogated induction of
Caspase3 activity by GW (Fig.5d). This showed that mitotane did
not cooperate with GW8510 but rather prevented its pro-apoptotic effects. Investigation of the combination of mitotane and GW on cell migration further showed no effect of mitotane
alone (Fig. 5e) or in combination with GW (Fig.5e). Altogether,
these data show a synergistic effect of RRM2 inhibition and mitotane treatment on H295R cell growth but not on other aggressiveness parameters.
Fig. 1 EZH2 may act as a transcriptional activator through potential cooperation with E2F1 in ACC. a Heatmap showing levels of expression of the genes with highest Pearson’s correlation with EZH2 (FDR < 0.001) in transcriptomes of three ACC cohorts (TCGA, Cochin, Michigan). Patients (columns) are organised according to increasing EZH2 expression shown as a z-score (from blue, low expression, to red, high expression). Genes (lines) are organised by decreasing Pearson’s R coefficient. b Correlation coefficients with EZH2 were used in a pre-ranked Gene set enrichment analysis (GSEA) to evaluate the presence of PRC2 targets in the genes correlated with EZH2. Curated lists of PRC2 targets were described in.15cCorrelation coefficients with EZH2 were used in a pre-ranked GSEA analysis to identify putative transcription factors binding sites in the promoters of the genes correlated with EZH2. Only gene sets with FDR < 0.01 were selected. Gene sets were extracted from MSigDB C3, which contains gene sets defined by the presence of putative transcription factor binding sites within their regulatory regions. d Genes constituting the leading edges of the 21‘E2F’ gene sets were extracted and intersected to build an EZH2/E2F core list of 94 genes. Their correlation coefficients with EZH2 and E2F1 were computed in the three cohorts of patients and represented as a heatmap. Columns represent the three cohorts, line represent correlation coefficients for each gene. e The capacity of E2F1 to bind to the regulatory regions (±2 kb from TSS) of the 94 leading edge genes was analysed in publically available E2F1 ChIP sequencing data obtained from six different cell lines. Pie charts represent the proportion of genes with (orange) or without (blue) E2F1 binding. f Patients’ overall survival (Cochin, Michigan, TCGA) and disease-free survival (Cochin) was analysed as a function of the mean expression of the 94 genes (EZH2_E2F1 metagene) by the Kaplan–Meier method. Statistical significance was evaluated by the Logrank test. g Expression of the metagene in ACC in the groups of good (blue) and poor prognosis (red). Statistical significance was evaluated by Wilcoxon’s test. h Expression of the metagene in ACC classified as CIMP low/intermediate/high and in clusters of clusters I, II and III.3Statistical significance was evaluated by ANOVA
DISCUSSION
We have previously shown that the methyltransferase EZH2 was the most deregulated epigenetic regulator in ACC and that it was
associated with tumour aggressiveness.8 Although EZH2 is the
catalytic component of PRC2 complex that deposits the H3K27me3 repressive histone mark, recent data suggest that
EZH2 can also stimulate transcription by interactions with a number of transcription factors. By a combination of bioinfor-matics analyses relying on datasets from three distinct ACC patients’ cohorts, we show that the main mode of action of EZH2 in ACC is related with transcription activation rather than repression, although some PRC2 gene sets show significant
Gene expression Ezh2KO vs WT GSEA PRC2 enrichment
Ezh2 KO vs WT
Log fold change
Pearson's correlations w. EZH2 Gene expression data (Affymetrix)
Gene expression (Cochin)
RRM2 Cochin O.S. PTTG1 Cochin O.S. PRC1 Cochin O.S.
RRM2 5.0 2.5 0 –2.5 1.0 0.6 0.8 0.2 F requency 0.4 0 1.0 0.6 0.8 0.2 F requency 0.4 0 1.0 0.6 0.8 0.2 F requency 0.4 0 1.0 0.6 0.8 0.2 F requency 0.4 0 1.0 0.6 0.8 0.2 F requency 0.4 0 1.0 0.6 0.8 0.2 F requency 0.4 0 4 2 0 –2 –4 5.0 2.5 NAd ACA ACC 0 –2.5 2 4 0 –1 1.5 1.0 0 –0.50 0.5 –1.0 –0.5 1.5 1.0 0.5 –1.5 –1.0 PTTG1 PRC1 RRM2 PTTG1 PRC1
Gene expression (Cochin)
Cochin TCGA Michigan
FDR <0.001 FDR <0.01 Negatively correlated w. EZH2 Positively correlated w. EZH2 Positive EZH2 targets Negative EZH2 targets Down in KO UP in KO Ezh2KO Wild type –Log 10 (Adj.p .v alue)
140 genes DOWN 208 genes UP
–4 0 1 2 3 4 5 6 –1.5 150 100 50 Relativ e mRNA accum ulation
Gene expression Correlogram (Cochin)
PTTG1 PTTG1 WT Ezh2KO RRM2 RRM2 PRC1 PRC1 EZH2 EZH2 E2F1 E2F1 –1 –0.8 –0.6 –0.4 –0.2 0 0.2 0.4 0.6 0.8 1 0 Rrm2 Pttg1 Prc1 –1.0 –0.5 0 0.5 1.0 1.5 2.0 a c d e f g h b –4 0 2 4 Nor m
alised enrcihment score
FDR q .v alue 0 0.005 0.003 0.011 0.08 0.39 0.32 CHENG_HUH7_MM_ES BRA CKEN_SHOR T CHENG_HUH7_HS_ESCHENG_PLC5_HS_ES VELLUCHTINA_HS_ES _CB_H3_EZH2 LEE_ET_AL CHENG_PLC5_55_ES P e arson's R 6.05 × 10⁻⁵ <1 × 10⁻⁷ ns <1 × 10⁻⁷ <1 × 10⁻⁷ 3.01 × 10⁻⁸ 3.06 × 10⁻⁴ 3.04 × 10⁻³ 0.049 5.7 × 10⁻³ ns ns Logrank test p-value = 3.0 × 10⁻³ High: 23 cases Low: 24 cases High: 23 cases Low: 24 cases High: 23 cases Low: 24 cases High: 22 cases Low: 22 cases Logrank test
p-value = 5.9 × 10⁻³ Logrank testp-value = 2.2 × 10⁻⁴
0 100 200
Overall survival (months)
300 0 100 200
Overall survival (months)
300 0 100 200
Overall survival (months) 300 D.F.S. D.F.S. D.F.S. Logrank test p-value = 1.7 × 10⁻⁴ High: 22 cases Low: 22 cases High: 22 cases Low: 22 cases Logrank test p-value = 4.5 × 10⁻⁴ Logrank test p-value = 6.8 × 10⁻⁴
Disease free survival (months)
0 20 40 60 80100120140
Disease free survival (months)
0 20 40 60 80100120140
Disease free survival (months)
0 20 40 60 80100120140
Good prognosis Poor prognosis
enrichment, in particular in the cohort from Michigan (Fig. 1b). This is in sharp contrast with normal mouse adrenal, in which Ezh2 ablation is associated with up-regulation of PRC2 target genes
(Fig.2a, b and ref.15). Interestingly, these differential activities are
also associated with differential effects on cell homeostasis. Indeed, whereas knockdown of EZH2 in H295R cells results in
decreased proliferation and induction of apoptosis,8 inactivation
of Ezh2 in the adrenal cortex does not alter proliferation but rather
modulates differentiation of steroidogenic cells.15 This suggests
that ACC cells have rerouted EZH2 activity from PRC2-mediated control of differentiation to PRC2-independent stimulation of proliferation. How this is achieved is unclear. In breast cancer and RRM2 RRM2 RRM2 PTTG1 PTTG1 PTTG1 PRC1 PRC1 PRC1 RRM2 RRM2 PTTG1 PTTG1 PRC1 PRC1 PRC1 EZH2 E2F1 PTTG1 EZH2 a b d e c H3K4me3 HeLa H3K27me3 E2F1 K562 E2F1 LM2 E2F1 Raji E2F1 2.0 2.0 1.5 1.0 Relativ e mRNA accum ulation Relativ e mRNA accum ulation % of input % of input Relativ e mRNA accum ulation 0.5 0 1.5 1.0 0.5 0 150 100 50 0 25 20 15 10 5 0 20 15 10 5 0 % of input 15 10 5 0
Region 1 Region 2 Region 1 Region 2
150 100 50 0 150 100 50 0 150 100 50 0 150 Ctrl siGFP IgG Anti-EZH2 Anti-E2F1 siEZH2 siE2F1 siEZH2 + siE2F1 100 50 0 1.5 1.0 0.5 0 1.5 1.0 0.5 0 1.5 1.0 0.5 0 1.5 1.0 0.5 0 24 – – – – – – + 48 72 – 24 – – – – – + 48 72 – 24 – – – – – + – – – – – – – – – – + + + + + – – – – – – – – – – + + + + + – – – – – – – – – – + + + + + 48 72 h DZNep DMSO Actin PTTG1 Actin PTTG1 PRC1 TUB PRC1 TUB RRM2 GAPDH DZNep DMSO HLM RRM2 GAPDH ns ns ns ns ns ns ns ns ns ns ns ns ns ns ns ns ns R1 R2 R1 R2 RRM2 ns
Fig. 3 EZH2 and E2F1 cooperate to up-regulate expression of RRM2, PTTG1 and PRC1 in ACC. a Graphical representation of enrichment for EZH2, H3K4me3, H3K27me3 and E2F1 on the regulatory regions of RRM2, PTTG1 and PRC1 in HeLa, K562, LM2 and Raji cells. Red boxes show regions with EZH2, E2F1 and H3K4me3 enrichment, in absence of H3K27me3. Regions amplified by qPCR in e are shown as red segments under graphical representations. b Effect of 5 µM DZNep treatment for 24, 48 and 72 h on expression of RRM2, PTTG1 and PRC1 was evaluated by RTqPCR (graphs) and western blot (bottom panels) in H295R cells. c Effect of DZNep and/or HLM treatment for 48 h on expression of RRM2, PTTG1 and PRC1 was evaluated by RTqPCR (graphs) and western blot (bottom panels) in H295R cells. d Effect of EZH2 and/or E2F1 knockdown on expression of RRM2, PTTG1 and PRC1 was evaluated by RTqPCR after transfection of siRNAs targeting EZH2 and/or E2F1 in H295R cells. eBinding of EZH2 and E2F1 to the regulatory regions of RRM2, PTTG1 and PRC1 was evaluated by ChIP qPCR in H295R cells. Data are expressed as percent of enrichment over chromatin input. IgG were included as negative control. In b–d graphs represent the mean of five independent experiments ± SEM. In e, graphs represent the mean of three independent IP experiments ± SEM. Significance was evaluated by ANOVA in b–e. *p < 0.05, **p < 0.01, ***p < 0.001
Fig. 2 Identification of EZH2 target genes. a Differential gene expression was evaluated by micro-array analysis in a mouse model of adrenal-specific inactivation of Ezh2, compared with wild-type mice.15Volcano plot represents Log Fold Change and–Log10 of adjusted p-value (FDR) for four knockout compared with three wild-type adrenals. Red dots show genes significantly up-regulated in knockout compared with wild-type adrenals. Blue dots show genes significantly down-regulated in knockout compared with wild-type adrenals. b GSEA evaluation of PRC2 targets enrichment in differentially expressed genes. c Strategy for identification of EZH2 targets in ACC by intersection of patients’ correlation data with mouse gene expression data. d Expression levels of the three identified positive target genes (RRM2, PTTG1, PRC1) were determined by RTqPCR in eight wild-type and eight Ezh2 knockout adrenals. Bars represent the mean ± SEM. Statistical analysis was conducted by Wilcoxon’s test. *p < 0.05, **p < 0.01 e Correlogram shows correlation of expression of RRM2, PTTG1 and PRC1 with expression of EZH2 and E2F1 in Cochin’s cohort. f Expression of RRM2, PTTG1 and PRC1 in normal adrenals, adrenocortical adenomas and adrenocortical carcinomas. Significance was evaluated by ANOVA. g Expression of RRM2, PTTG1 and PRC1 in the groups of good (blue) and poor (red) prognosis in Cochin’s cohort. Significance was evaluated by Wilcoxon’s test. h Overall (O.S) and disease-free (D.F.S) survival as a function of RRM2, PTTG1 and PRC1expression in Cochin’s cohort. Statistical significance was evaluated by the Logrank test
150 100 50 0 ** *** ns H295R growth rate Ctrl siGFP siRRM2 150 100 50 0 *** ****** ****** *** *** *** *** ns DMSO DMSO GW 5.0 µM GW 5.0 µM h 1500 1000 500 0 Number of colonies 150 100 50 0 Size of colonies Clonogenic growth Relative surface of colonies Number of colonies/field *** ** * * *** ns ns ns ns ns RRM2 CYCLINS CyclinA 2 4 6 8 10 0 *** * * * * ***
CyclinB1 CyclinB2 CyclinD1 CyclinD2 CyclinE
Relative growth rate Relative mRNA accumulation Relative mRNA accumulation Ctrl DMSO GW 1.0 µM GW 2.5 µM Day 1 Day 7 DMSO GW 2.5 µM DMSO GW 1.0 µM GW 2.5 µM DMSO GW 2.5 µM i Wound healing Boyden chambers *** 150 100 50 0 Healing % o f DMSO GW 5.0 µM Ctrl DMSO GW 1.0 µM GW 2.5 µM GW 5.0 µM Ctrl DMSO GW 1.0 µM GW 2.5 µM GW 5.0 µM GW 7.5 µM Caspase 3 activity 0.5 1.0 1.5 2.0 2.5 0 Relative activity **** ns ns ns
Cell cycle analysis
G0/G1 20 40 60 80 0 G2/M S Percentage o f cells Relative growth rate 100 150 50 0 GW8510 1.0 2.5 5.0 DMSO H295R growth rate – – + – – – – 7.5 10 12.5 15 µM – – – – RRM2 Actin c d e g f ** *** *** ns BAX *** *** ns BCL2 ns ns APOPTOSIS 1 2 3 0 BIRC5 BCL-Xl ** ns ns ns ns***** Relative mRNA accumulation a b Ctrl siGFP siRRM2 DMSO GW 12.5µM ** ** ns CyclinA ** ns CyclinB1 ns ns CYCLINS 2 4 6 8 0 CyclinD1 ns * *** *** *** CyclinB2 *** ** ns** * CyclinD2 ns ns ns ***** *** CyclinE Relative mRNA accumulation MC170144 MC170150 MC170202 MC170196 MC170033 MC170041
Fig. 4 Inhibition of RRM2 reduces H295R cells growth and aggressiveness. a Effect of siRNA-mediated knockdown of RRM2 on RRM2 expression (left panel) and H295R cells growth afterfive days. b Effect of siRNA-mediated knockdown of RRM2 on expression of Cyclin coding genes in H295R cells was evaluated by RTqPCR. c Effect of pharmacological inhibition of RRM2 on the growth of H295R cells was determined by counting live cells after 5 days of treatment with increasing amounts of GW8510. Bottom panel shows RRM2 accumulation following GW8510 treatment. Representative images were taken at the end of treatment. d Effect of pharmacological inhibition of RRM2 on H295R cell cycle was determined by FACS following propidium iodide incorporation after 2 days of treatment with increasing amounts of GW8510. eEffect of RRM2 inhibition on expression of Cyclin coding genes in H295R cells was evaluated by RTqPCR. f Effect of RRM2 inhibition on expression of apoptosis-related genes in H295R cells was evaluated by RTqPCR. g Caspase 3 activity in H295R cells was determined after 1 day of GW8510 treatment at increasing concentrations. h Effect of RRM2 inhibition on clonogenic cell growth was determined by growing H295R cells in soft agar for 21 days in the presence or absence of 5 µM GW8510. Number and sizes of colonies were determined using Image J. iEffect of RRM2 inhibition on cell migration was determined by wound healing assays (top panel) in the absence or presence of 2.5 µM GW8510 for 7 days. For Boyden chambers migration assays (bottom panel) cells were incubated for 48h with two doses of GW8510 and migrating cells were stained with Haematoxylin. Graphs in a–g represent the mean of four experiments ± SEM. Statistical significance in these panels was evaluated by ANOVA. *p < 0.05, **p < 0.01, ***p < 0.001. Graphs in h, i represent the mean of three experiments ± SEM. Statistical significance was determined by Wilcoxon’s test
castration resistant prostate cancer, phosphorylation of serine 21 by AKT has been shown to play an essential role in diverting EZH2 away from its function as a histone methyltransferase, although its enzymatic activity was still required. This phenomenon was
associated with cancer aggressiveness.12,34 Interestingly, the
growth factor IGF2, which signals through PI3K/AKT pathway is
almost systematically upregulated in ACC.2,3Although the role of
IGF2 in ACC pathogenesis is still unclear,5,6it may be involved in
modulation of EZH2 activity through activation of AKT.
Using a combination of bioinformatics and in vitro analyses, we show that EZH2 functionally interacts with E2F1 to stimulate gene
expression in ACC. Thesefindings are consistent with recent data
showing a similar functional interaction in castration resistant prostate cancer (CRPC). In this study, using a combination of ChIP sequencing and expression data, Xu et al. showed that EZH2 cooperated with E2F1 to stimulate expression of a group of 56 genes involved in cancer aggressiveness. Interestingly, collabora-tion between EZH2 and E2F1 was also found to regulate the majority of these genes in diffuse large B-cell lymphomas,
suggesting that this activity was generally found in cancer.35 In
contrast, even though we showed functional interaction between EZH2 and E2F1 in ACC, only six out of 56 CRPC genes were also found in our list of EZH2/E2F1 targets (Supplementary Table 7). This suggests that the repertoire of EZH2/E2F1 positive targets may vary from one tissue to the other.
In contrast with CRPC, where EZH2 expression seems to be
independent of E2F1 levels,35we have previously shown that E2F1
directly stimulates EZH2 expression in ACC.8A reciprocal effect of
EZH2 on E2F1 expression has been shown in hepatocellular carcinoma cells, where EZH2 repressed expression of E2F1, which
may constitute a negative feedback loop.36In contrast, we show
that tampering with EZH2 expression/activity has no impact on
E2F1 expression (Fig.3d and Fig. S2D). Therefore, our data show
that ACC progression may be dependent on a feed-forward mechanism involving E2F1 stimulated EZH2 expression, which would in turn stimulate E2F1 transcriptional activity.
Consistent with observations in CRPC,35the 94 positive targets
of EZH2/E2F1 interaction are mostly involved in cell cycle control, DNA replication and mitosis and their overexpression is strongly associated with reduced overall and disease-free survival. By
combining patients’ data with transcriptome analysis of our
mouse model of adrenal-specific Ezh2 deletion,15 we identified
PTTG1, PRC1 and RRM2 as three robust positive target genes. Interestingly, recent reports have also shown overexpression of
PTTG122 and RRM237 in ACC. However, they did not provide a
molecular mechanism accounting for their deregulation in these tumours. Here, we show that these three genes are transcription-ally stimulated by cooperation of EZH2 and E2F1 on their regulatory regions. Increased expression of these genes is strongly associated with poor prognosis and results in decreased overall
****** * ** ****** ****** ns Relativ e g ro wth r ate 100 150 50 0 GW8510 7.5 10 10 20 10 20 10 20 Mitotane H295R cell growth – – – – – – – – 7.5 7.5 10 10 µM DMSO – + – – – – – – – – µM µM a b c d e GW 7.5 µM + Mitotane 10 µM Mitotane 10 µM CyclinA ns CYCLINS 10 2 4 20 60 40 80 0 Relativ e mRNA accum ulation 6 8 **** ***** ns CyclinB1 CyclinB2 ns ** * ns ns ns CyclinD2 * * ns CyclinD1 * * CyclinE ** ** ns nsns Ctrl DMSO GW 7.5 µM Mitotane10 µM GW 7.5 µM + Mitotane 10 µM BAX APOPTOSIS 0.5 1.0 2.5 0 Relativ e mRNA accum u lation 1.5 2.0 *** ns nsns ns BCL2 BCL-XL BIRC5 * ** ns nsns *** *** *** ns ns *** *** nsns ns Caspase3 activity 0.5 1.0 2.0 0 Relativ e activity 1.5 *** * ns ns ns G0/G1 20 80 0 40 60 nsnsns ns ns G2/M ns ns nsns ns ns nsns S Ctrl DMSO Cell cycle analysis
GW 5.0 µM Mitotane 10 µM GW 5.0 µM+Mitotane 10 µM *** * P e rcentage of cells ns ns *** *** 150 100 50 0 Healing % of DMSO DMSO GW 2.5 µM Mitotane 10 µM GW 2.5 µM + Mitotane 10 µM Da y 1 Da y 7
DMSO GW 2.5 µM Mitotane 10 µM GW 2.5 µM + Mitotan 10 µM GW 10 µM + Mitotane 20 µM MC170057 MC170060 MC170062 MC170067 MC170110 MC170124 MC170126 MC170123 MC170016 MC170023 MC170032
Fig. 5 Combined effects of mitotane and RRM2 inhibition on H295R cells growth and aggressiveness. a Effect of pharmacological inhibition of RRM2 and/or mitotane treatment on the growth of H295R cells was determined by counting live cells after 5 days of treatment with two doses of GW8510 and/or mitotane. Representative images were taken at the end of treatment. b Effect of pharmacological inhibition of RRM2 and/or mitotane treatment on expression of Cyclin coding genes in H295R cells was evaluated by RTqPCR. c Effect of pharmacological inhibition of RRM2 and/or mitotane treatment on H295R cell cycle was determined by FACS, following propidium iodide incorporation after 2 days of treatment with GW8510 and/or mitotane. d Effect of RRM2 inhibition and/or mitotane treatment on expression of apoptosis-related genes in H295R cells was evaluated by RTqPCR (left panel). Caspase 3 activity was determined after 1 day of treatment with 5 µM GW8510 and/or 10 µM mitotane (right panel). e Effect of GW8510 and/or mitotane on cell migration was determined by wound healing assays in the absence or presence of 2.5 µM GW8510 and/or 10 µM Mitotane for 7 days. Graphs in a-e represent the mean of four experiments ± SEM. Statistical significance was determined by ANOVA. *p < 0.05, **p < 0.01, ***p < 0.001
and disease-free survival, suggesting that they may play a role in ACC aggressiveness.
Consistent with this idea, we show that pharmacological inhibition and/or siRNA-mediated knockdown of RRM2, which is required for the catalytic activity of the ribonucleotide reductase, is associated with decreased cell growth, G2/M arrest, increased apoptosis and inhibition of cell migration.
These findings are consistent with the anti-tumour effects of
RRM2 inhibition in pancreatic,38cervical29and breast cancer39as
well as in neuroblastoma40 and glioblastoma.41 It further
suggests that RRM2 may be an interesting therapeutic target in the context of ACC. Interestingly, a number of compounds that can inhibit ribonucleotide reductase activity, such as
Triapine (https://clinicaltrials.gov/ct2/results?term=triapine) or
COH-29 (NCT02112565) have undergone or are undergoing
phase I and II clinical trials42,43and may prove interesting in the
context of ACC.
Altogether, our data show that EZH2 cooperates with E2F1 to stimulate expression of genes involved in ACC aggressiveness and establishes RRM2 as an interesting therapeutic target in this cancer.
ACKNOWLEDGEMENTS
We wish to thank Thomas Giordano (University of Michigan, Ann Arbor, USA) for providing clinical information for TCGA patients and Yoan Renaud (CNRS UMR 6293 GReD, Clermont-Ferrand, France) for performing complementary statistical analyses.
AUTHOR CONTRIBUTIONS
H.T. performed experiments and helped write the paper, A.S. analysed OMICs data and generatedfigures, MM performed experiments, C.D. performed experiments, SR performed experiments, C.D. performed experiments, M.B-L. discussed data, I.T. discussed data, JCP performed experiments, ISB performed experiments, B.R. provided patients data, G.A. provided patients data, J.B. provided patients data, A-M.L-M. conceived some experiments, P.V. conceived and performed experiments, analysed data and wrote the paper.
ADDITIONAL INFORMATION
Supplementary information is available for this paper athttps://doi.org/10.1038/
s41416-019-0538-y.
Competing interests: The authors declare no competing interests.
Ethics approval and consent to participate: This study used exclusively already published gene expression datasets from anonymised patients. Ethical approval and consent to participate were granted for original studies (refs.2,3,13
).
Funding: This work was funded by institutional support from Centre National de la Recherche Scientifique, Institut National de la Santé et de la Recherche Médicale, Université Clermont Auvergne, La Ligue Contre le Cancer (Allier & Puy de Dôme committees) and Fondation ARC (PJA-20141201894).
Consent to publish: N/A.
Data availability: The authors declare that all data supporting thefindings of this study are available within the article and its supplementary informationfiles or from the corresponding author upon reasonable request. Gene expression data from patients cohorts are readily available from GEO (GSE49820 and GSE10927) and Broad GDAC (TCGA ACC data). Mouse gene expression data are available from GEO (GSE109578). ChIP sequencing data were downloaded from GEO and Encode. Details can be found in Supplementary Table 1.
Note: This work is published under the standard license to publish agreement. After 12 months the work will become freely available and the license terms will switch to a Creative Commons Attribution 4.0 International (CC BY 4.0).
Publisher’s note: Springer Nature remains neutral with regard to jurisdictional claims in published maps and institutional affiliations.
REFERENCES
1. Libé, R. Adrenocortical carcinoma (ACC): diagnosis, prognosis, and treatment. Front Cell Dev. Biol. 3, 45 (2015).
2. Assié, G., Letouzé, E., Fassnacht, M., Jouinot, A., Luscap, W., Barreau, O. et al. Integrated genomic characterization of adrenocortical carcinoma. Nat. Genet 46, 607–612 (2014).
3. Zheng, S., Cherniack, A. D., Dewal, N., Moffitt, R. A., Danilova, L., Murray, B. A. et al. Comprehensive pan-genomic characterization of adrenocortical carcinoma. Cancer Cell 29, 723–736 (2016).
4. Batisse-Lignier, M., Sahut-Barnola, I., Tissier, F., Dumontet, T., Mathieu, M., Drelon, C. et al. P53/Rb inhibition induces metastatic adrenocortical carcinomas in a preclinical transgenic model. Oncogene 36, 4445–4456 (2017).
5. Drelon, C., Berthon, A. & Val, P. Adrenocortical cancer and IGF2: is the game over or our experimental models limited? J. Clin. Endocrinol. Metab. 98, 505–507 (2013).
6. Drelon, C., Berthon, A., Ragazzon, B., Tissier, F., Bandiera, R., Sahut-Barnola, I. et al. Analysis of the role of Igf2 in adrenal tumour development in transgenic mouse models. PLoS ONE 7, e44171 (2012).
7. Berthon, A., Sahut-Barnola, I., Lambert-Langlais, S., de Joussineau, C., Damon-Soubeyrand, C., Louiset, E. et al. Constitutive {beta}-catenin activation induces adrenal hyperplasia and promotes adrenal cancer development. Hum. Mol. Genet 19, 1561–1576 (2010).
8. Drelon, C., Berthon, A., Mathieu, M., Ragazzon, B., Kuick, R., Tabbal, H. et al. EZH2 is overexpressed in adrenocortical carcinoma and is associated with disease pro-gression. Hum. Mol. Genet 25, 2789–2800 (2016).
9. Wassef M., Margueron R. The Multiple Facets of PRC2 Alterations in Cancers. J. Mol. Biol.https://doi.org/10.1016/j.jmb.2016.10.012. (2016)
10. Margueron, R. & Reinberg, D. The Polycomb complex PRC2 and its mark in life. Nature 469, 343–349 (2011).
11. Kim, E., Kim, M., Woo, D.-H., Shin, Y., Shin, J., Chang, N. et al. Phosphorylation of EZH2 activates STAT3 signaling via STAT3 methylation and promotes tumor-igenicity of glioblastoma stem-like cells. Cancer Cell 23, 839–852 (2013). 12. Xu, K., Wu, Z. J., Groner, A. C., He, H. H., Cai, C., Lis, R. T. et al. EZH2 oncogenic
activity in castration-resistant prostate cancer cells is Polycomb-independent. Science 338, 1465–1469 (2012).
13. Giordano, T. J., Kuick, R., Else, T., Gauger, P. G., Vinco, M., Bauersfeld, J. et al. Molecular classification and prognostication of adrenocortical tumors by tran-scriptome profiling. Clin. Cancer Res J. Am. Assoc. Cancer Res 15, 668–676 (2009). 14. de Reynies, A., Assie, G., Rickman, D. S., Tissier, F., Groussin, L.,Rene-Corail, F. et al. Gene expression profiling reveals a new classification of adrenocortical tumors and identifies molecular predictors of malignancy and survival. J. Clin. Oncol. 27, 1108–1115 (2009).
15. Mathieu M., Drelon C., Rodriguez S., Tabbal H., Septier A., Damon-Soubeyrand C. et al. Steroidogenic differentiation and PKA signalling are programmed by his-tone methyltransferase EZH2 in the adrenal cortex. Proc. Natl Acad. Sci. USA 115, E12265–E12274 (2018)
16. Drelon, C., Berthon, A., Sahut-Barnola, I., Mathieu, M., Dumontet, T., Rodriguez, S. et al. PKA inhibits WNT signalling in adrenal cortex zonation and prevents malignant tumour development. Nat. Commun. 7, 12751 (2016).
17. Zou, H., McGarry, T. J., Bernal, T. & Kirschner, M. W. Identification of a vertebrate sister-chromatid separation inhibitor involved in transformation and tumor-igenesis. Science 285, 418–422 (1999).
18. Bernal, J. A., Roche, M., Méndez-Vidal, C., Espina, A., Tortolero, M., Pintor-Toro, J. A. Proliferative potential after DNA damage and non-homologous end joining are affected by loss of securin. Cell Death Differ. 15, 202–212 (2008).
19. Tong, Y., Tan, Y., Zhou, C. & Melmed, S. Pituitary tumor transforming gene interacts with Sp1 to modulate G1/S cell phase transition. Oncogene 26, 5596–5605 (2007).
20. Pei, L. & Melmed, S. Isolation and characterization of a pituitary tumor-transforming gene (PTTG). Mol. Endocrinol. Balt. Md 11, 433–441 (1997). 21. Wei, C., Yang, X., Xi, J., Wu, W., Yang, Z., Wang, W. et al. High expression of
pituitary tumor-transforming gene-1 predicts poor prognosis in clear cell renal cell carcinoma. Mol. Clin. Oncol. 3, 387–391 (2015).
22. Demeure, M. J., Coan, K. E., Grant, C. S., Komorowski, R. A., Stephan, E., Sinari, S. et al. PTTG1 overexpression in adrenocortical cancer is associated with poor survival and represents a potential therapeutic target. Surgery 154, 1405–1416 (2013). discussion 1416.
23. Portran, D., Zoccoler, M., Gaillard, J., Stoppin-Mellet, V., Neumann, E., Arnal, I. et al. MAP65/Ase1 promote microtubuleflexibility. Mol. Biol. Cell 24, 1964–1973 (2013). 24. Duellberg, C., Fourniol, F. J., Maurer, S. P., Roostalu, J. & Surrey, T. End-binding proteins and Ase1/PRC1 define local functionality of structurally distinct parts of the microtubule cytoskeleton. Trends Cell Biol. 23, 54–63 (2013).
25. Zhan P., Zhang B., Xi G., Wu Y., Liu H., Liu Y. et al. PRC1 contributes to tumor-igenesis of lung adenocarcinoma in association with the Wnt/β-catenin signaling pathway. Mol. Cancer 16https://doi.org/10.1186/s12943-017-0682-z(2017)
26. Chen, J., Rajasekaran, M., Xia, H., Zhang, X., Kong, S. N., Sekar, K. et al. The microtubule-associated protein PRC1 promotes early recurrence of hepatocellular carcinoma in association with the Wnt/β-catenin signalling pathway. Gut 65, 1522–1534 (2016).
27. Nordlund, P. & Reichard, P. Ribonucleotide reductases. Annu Rev. Biochem 75, 681–706 (2006).
28. Furuta, E., Okuda, H., Kobayashi, A. & Watabe, K. Metabolic genes in cancer: their roles in tumor progression and clinical implications. Biochim Biophys. Acta 1805, 141–152 (2010).
29. Liu, X., Zhang, H., Lai, L., Wang, X., Loera, S., Xue, L. et al. Ribonucleotide reductase small subunit M2 serves as a prognostic biomarker and predicts poor survival of colorectal cancers. Clin. Sci. Lond. Engl. 1979 124, 567–578 (2013).
30. Fujita, H., Ohuchida, K., Mizumoto, K., Itaba, S., Ito, T., Nakata, K. et al. Gene expression levels as predictive markers of outcome in pancreatic cancer after gemcitabine-based adjuvant chemotherapy. Neoplasia N. Y N. 12, 807–817 (2010).
31. Jones, D. T., Lechertier, T., Mitter, R., Herbert, J. M. J., Bicknell, R., Jones, J. L. et al. Gene expression analysis in human breast cancer associated blood vessels. PloS ONE 7, e44294 (2012).
32. Ma, Y., Kurtyka, C. A., Boyapalle, S., Sung, S.-S., Lawrence, H., Guida, W. et al. A small-molecule E2F inhibitor blocks growth in a melanoma culture model. Cancer Res 68, 6292–6299 (2008).
33. Hsieh, Y.-Y., Chou, C.-J., Lo, H.-L. & Yang, P.-M. Repositioning of a cyclin-dependent kinase inhibitor GW8510 as a ribonucleotide reductase M2 inhibitor to treat human colorectal cancer. Cell Death Disco. 2, 16027 (2016).
34. Cha, T.-L., Zhou, B. P., Xia, W., Wu, Y., Yang, C.-C., Chen, C.-T. et al. Akt-mediated phosphorylation of EZH2 suppresses methylation of lysine 27 in histone H3. Science 310, 306–310 (2005).
35. Xu, H., Xu, K., He, H. H., Zang, C., Chen, C.-H., Chen, Y. et al. Integrative analysis reveals the transcriptional collaboration between EZH2 and E2F1 in the regula-tion of cancer-related gene expression. Mol. Cancer Res. MCR 14, 163–172 (2016).
36. Gao, S.-B., Zheng, Q.-F., Xu, B., Pan, C.-B., Li, K.-L., Zhao, Y. et al. EZH2 represses target genes through H3K27-dependent and H3K27-independent mechanisms in hepatocellular carcinoma. Mol. Cancer Res. 12, 1388–1397 (2014).
37. Grolmusz, V. K., Karászi, K., Micsik, T., Tóth, E. A., Mészáros, K., Karvaly, G. et al. Cell cycle dependent RRM2 may serve as proliferation marker and pharmaceutical target in adrenocortical cancer. Am. J. Cancer Res 6, 2041–2053 (2016). 38. Zheng, S., Wang, X., Weng, Y.-H., Jin, X., Ji, J.-L., Guo, L. et al. siRNA knockdown of
RRM2 effectively suppressed pancreatic tumor growth alone or synergistically with doxorubicin. Mol. Ther. Nucleic Acids 12, 805–816 (2018).
39. Zhang, H., Liu, X., Warden, C. D., Huang, Y., Loera, S., Xue, L. et al. Prognostic and therapeutic significance of ribonucleotide reductase small subunit M2 in estrogen-negative breast cancers. BMC Cancer 14, 664 (2014).
40. Li, J., Pang, J., Liu, Y., Zhang, J., Zhang, C., Shen, G. et al. Suppression of RRM2 inhibits cell proliferation, causes cell cycle arrest and promotes the apoptosis of human neuroblastoma cells and in human neuroblastoma RRM2 is suppressed following chemotherapy. Oncol. Rep. 40, 355–360 (2018).
41. Li, C., Zheng, J., Chen, S., Huang, B., Li, G., Feng, Z. et al. RRM2 promotes the progression of human glioblastoma. J. Cell Physiol. 233, 6759–6767 (2018). 42. Shao, J., Zhou, B., Chu, B. & Yen, Y. Ribonucleotide reductase inhibitors and future
drug design. Curr. Cancer Drug Targets 6, 409–431 (2006).
43. Mortazavi, A., Ling, Y., Martin, L. K., Wei, L., Phelps, M. A., Liu, Z. et al. A phase I study of prolonged infusion of triapine in combination with fixed dose rate gemcitabine in patients with advanced solid tumors. Invest New Drugs 31, 685–695 (2013).