HAL Id: inserm-00668203
https://www.hal.inserm.fr/inserm-00668203
Submitted on 9 Feb 2012
HAL is a multi-disciplinary open access
archive for the deposit and dissemination of
sci-entific research documents, whether they are
pub-lished or not. The documents may come from
teaching and research institutions in France or
abroad, or from public or private research centers.
L’archive ouverte pluridisciplinaire HAL, est
destinée au dépôt et à la diffusion de documents
scientifiques de niveau recherche, publiés ou non,
émanant des établissements d’enseignement et de
recherche français ou étrangers, des laboratoires
publics ou privés.
Consistency of aortic distensibility and pulse wave
velocity estimates with respect to the Bramwell-Hill
theoretical model: a cardiovascular magnetic resonance
study.
Anas Dogui, Nadjia Kachenoura, Frédérique Frouin, Muriel Lefort, Alain de
Cesare, Elie Mousseaux, Alain Herment
To cite this version:
Anas Dogui, Nadjia Kachenoura, Frédérique Frouin, Muriel Lefort, Alain de Cesare, et al.. Consistency
of aortic distensibility and pulse wave velocity estimates with respect to the Bramwell-Hill theoretical
model: a cardiovascular magnetic resonance study.. Journal of Cardiovascular Magnetic Resonance,
BioMed Central, 2011, 13 (1), pp.11. �10.1186/1532-429X-13-11�. �inserm-00668203�
R E S E A R C H
Open Access
Consistency of aortic distensibility and pulse
wave velocity estimates with respect to the
Bramwell-Hill theoretical model: a cardiovascular
magnetic resonance study
Anas Dogui
1*, Nadjia Kachenoura
1, Frédérique Frouin
1, Muriel Lefort
1, Alain De Cesare
1,
Elie Mousseaux
1,2, Alain Herment
1Abstract
Background: Arterial stiffness is considered as an independent predictor of cardiovascular mortality, and is increasingly used in clinical practice. This study aimed at evaluating the consistency of the automated estimation of regional and local aortic stiffness indices from cardiovascular magnetic resonance (CMR) data.
Results: Forty-six healthy subjects underwent carotid-femoral pulse wave velocity measurements (CF_PWV) by applanation tonometry and CMR with steady-state free-precession and phase contrast acquisitions at the level of the aortic arch. These data were used for the automated evaluation of the aortic arch pulse wave velocity
(Arch_PWV), and the ascending aorta distensibility (AA_Distc, AA_Distb), which were estimated from ascending aorta strain (AA_Strain) combined with either carotid or brachial pulse pressure. The local ascending aorta pulse wave velocity AA_PWVc and AA_PWVb were estimated respectively from these carotid and brachial derived distensibility indices according to the Bramwell-Hill theoretical model, and were compared with the Arch_PWV. In addition, a reproducibility analysis of AA_PWV measurement and its comparison with the standard CF_PWV was performed. Characterization according to the Bramwell-Hill equation resulted in good correlations between Arch_PWV and both local distensibility indices AA_Distc (r = 0.71, p < 0.001) and AA_Distb (r = 0.60, p < 0.001); and between Arch_PWV and both theoretical local indices AA_PWVc (r = 0.78, p < 0.001) and AA_PWVb (r = 0.78, p < 0.001). Furthermore, the Arch_PWV was well related to CF_PWV (r = 0.69, p < 0.001) and its estimation was highly reproducible (inter-operator variability: 7.1%).
Conclusions: The present work confirmed the consistency and robustness of the regional index Arch_PWV and the local indices AA_Distc and AA_Distb according to the theoretical model, as well as to the well established
measurement of CF_PWV, demonstrating the relevance of the regional and local CMR indices.
Background
Changes in aortic stiffness have a high physiopathologi-cal relevance as they can lead to increases in the aortic pulse pressure [1,2] and the cardiac pressure afterload, which can cause left ventricular hypertrophy [3]. Arterial stiffness is recognized as a major risk factor in coronary heart disease [4,5], and is considered as an independent predictor of cardiovascular mortality [6-10]. It is
therefore increasingly used in clinical practice [11]. Distensibility and pulse wave velocity (PWV) are com-monly used to characterize the arterial stiffness [12-16]. The distensibility describes the ability of the artery to expand during systole, and is defined as the relative change in the cross-sectional area of the artery (strain) divided by the local pulse pressure. The PWV is the propagation speed of the pressure or the velocity wave along the artery, and is calculated as the ratio between the distance separating two locations and the transit time needed for the wave to cover this distance.
* Correspondence: anas.dogui@imed.jussieu.fr
1
Inserm U678, 91 boulevard de l’Hôpital, 75634 Paris cedex 13, France Full list of author information is available at the end of the article
© 2011 Dogui et al; licensee BioMed Central Ltd. This is an Open Access article distributed under the terms of the Creative Commons Attribution License (http://creativecommons.org/licenses/by/2.0), which permits unrestricted use, distribution, and reproduction in any medium, provided the original work is properly cited.
Tonometry is the most commonly used technique for quantification of global vascular function [11]. However, this technique can only provide a global estimation of the aortic PWV, along the whole carotid-femoral artery path. Indeed, tonometry uses body surface anatomy to estimate artery length and does not take into account the often torturous route of the vessels.
Cardiovascular magnetic resonance (CMR) is increas-ingly used to analyze the local and regional mechanical properties of the aortic wall and the blood flow [13-24]. Steady-state free-precession (SSFP) cine acquisitions enable a direct estimation of the aortic strain at loca-lized and specific levels of the thoracic aorta, as well as the precise measurement of the length of the aorta. Furthermore, phase-contrast (PC) cine acquisitions pro-vide an accurate assessment of the blood flow velocities throughout different aortic sections during the cardiac cycle, which enable the estimation of velocity wave-forms. The transit time of a velocity waveform propaga-tion between two aortic secpropaga-tions can be calculated and its combination with the aortic distance travelled by the waveform provides the aortic arch PWV [15]. The com-bination of the aortic strain with pulse pressure mea-surements results in local aortic distensibility.
Although the relation between the aortic strain and the distending pressure is complex because the aorta may exhibit a non-linear and spatially non-uniform elas-tic behavior, a theoreelas-tical model that links the PWV, strain, pulse pressure, and blood density have been pro-posed by Bramwell and Hill [25] and have been com-monly used in clinical practice [11]. Despite the fact that the Bramwell and Hill equation was derived from the Moens-Korteweg equation [26], more modern theo-retical work using the 1-D equations describing flow in compliant vessels [26] shows that the Bramwell-Hill model is more general since it does not consider assumptions such as thin-walled and homogeneous elas-tic arteries that are assumed in the Moens-Korteweg model.
Accordingly, our primary goal was to use the theoreti-cal model described by Bramwell and Hill [25] to demonstrate the consistency of the automated MR mea-surements of the local and regional aortic stiffness indices. Furthermore, comparisons against the clinical standard of the tonometric carotid-femoral PWV (CF_PWV) estimates as well as a reproducibility analysis of the MR PWV measurements were performed.
Methods Data acquisition
For this study, 46 volunteers (age: 39 ± 15 years) were recruited. None of the volunteers had any history of car-diovascular events or hypertension. All CMR examina-tions were performed on a 1.5T scanner (Sigma
LX; General Electric Medical Systems, Milwaukee, Wisconsin, US) using a cardiac phased-array coil and ECG-gated sequences. SSFP and PC cine acquisitions were acquired for each subject.
For the local ascending aortic strain (AA_Strain) mea-surements, an axial dataset was positioned perpendicular to the axis of the aorta at the level of the bifurcation of the pulmonary trunk (between 2 and 4 cm above the aortic junction) to ensure optimal imaging quality [27] and to avoid distortion due to the aortic valve move-ment. Axial dataset was acquired according to the SSFP sequence using the following average scan parameters: field-of-view = 370 mm × 370 mm, repetition time = 3.2 ms, echo time = 1.4 ms, flip angle = 50°, slice thick-ness = 8 mm, pixel size = 1.65 mm × 1.92 mm, and inter phase duration = 33 ms. For further evaluation of the aortic geometry, axial and coronal sequences cover-ing the whole aortic arch were acquired uscover-ing the same protocol. For the aortic arch PWV (Arch_PWV) estima-tion, the PC slice was set at the level used for ascending aortic strain measurement. Hence, the ascending and descending aorta could be studied simultaneously. The PC data were acquired using a retrospectively ECG-gated breath-hold gradient sequence with a velo-city encoding gradient in the through-plane direction, which provided phase-related pairs of modulus and velocity-encoded images. The scan parameters were: repetition time = 9 ms, echo time = 3.5 ms, flip angle = 20°, views per segment = 2, rectangular field-of-view = 50%, acquisition matrix = 256 × 128, pixel size = 1.58 mm × 1.58 mm, slice thickness = 8 mm, and encoding velocity = 200 cm/s. View sharing was used resulting in an effective temporal resolution of 18 ms.
Oscillometric techniques were used to assess the pulse pressure at the brachial artery (Vital Signs Monitor, Welch Allyn Inc, US). The brachial pressure was mea-sured with a sensor cuff in the magnet simultaneously to MR SSFP and PC acquisitions of the aorta.
Applanation tonometry of both the right carotid artery and right femoral artery was performed with the Pulse Pen device (Diatecne, Milano, Italy) [28] immediately after the MRI acquisitions. These acquisitions were used to estimate the carotid pulse pressure, and the carotid-femoral PWV (CF_PWV). The CF_PWV was defined as the ratio of the difference between the suprasternal notch-femoral and the carotid-suprasternal notch dis-tances, to the transit time between the pressures wave-forms recorded at the carotid and femoral arteries. The suprasternal notch-femoral, and the carotid-suprasternal notch distances were measured by means of a tape ruler over the body surface [29]. The transit time was mea-sured as the foot-to-foot interval of the carotid and femoral waveforms. The carotid pulse pressure was cal-culated after rescaling tonometric measurement by the
Dogui et al. Journal of Cardiovascular Magnetic Resonance 2011, 13:11 http://www.jcmr-online.com/content/13/1/11
brachial mean and diastolic pressures measured simulta-neously to the MR acquisitions. This rescaling is based on the assumption that the difference between the mean and diastolic blood pressures remains unchanged throughout the arterial artery pathway [11].
Theoretical model
Bramwell and Hill [25] proposed an equation which links the pulse wave velocity with the vessel and fluid characteristics. It assumes that the vessel is compliant and filled with an incompressible nonviscous fluid.
PWV Distensibility = × 1 . (1)
Here r is the blood density (1059 kg.m-3). The Disten-sibility of an infinitesimally thin slice of the vessel under the pressure of a fluid is computed as follow:
Distensibility strain P S S P = = × Δ Δ Δ . (2)
Here, ∆P is the pulse pressure, and strain is the induced relative variation of the vessel cross-sectional area (∆S/S).
The Bramwell-Hill equation (1) was derived from the Moens-Korteweg equation [26], and is commonly used in clinical studies [11].
In our study, the equation (1) was applied on the ascending aorta to study the relationship between the PWV along the aortic arch (Arch_PWV) and the direct measurement of the local ascending aortic strain (AA_Strain), combined with either brachial or carotid pulse pressure.
CMR image analysis
Local and regional indices of aortic stiffness were esti-mated from MR SSFP and PC cine images using the fol-lowing post-processing approaches.
Regional aortic arch pulse wave velocity
To extract ascending and descending aorta mean velo-city curves, aortic lumen contours were detected from the modulus of the PC images using the Art-FUN soft-ware package as described in a previous work [30]. Con-tours were then superimposed on the velocity-encoded images.
The aortic arch PWV (Arch_PWV) was calculated as the ratio between the 3D length of the aortic arch, and the transit time (∆t) between the velocity waveforms in the ascending and descending aorta.
To estimate the 3D length of the aortic arch, the cen-ters of the aortic lumen were first selected by an experi-enced user on each SSFP axial and coronal slices in a
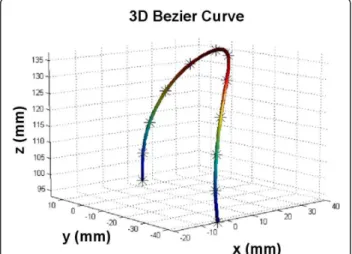
3D Coordinate-System. Six to eight markers were defined for the ascending and the descending segment on axial slices, and three markers were defined for the top of the aortic arch on coronal slices. The 3D coordi-nates of the selected centers were computed from the DICOM headers of the MR images, and were interpo-lated with a 3D Bezier curve (Figure 1). The length of the 3D Bezier curve comprised between the ascending and descending aorta planes defined from the PC images was considered for the estimation of the AA_PWV.
As previously described [31], to minimize the variabil-ity of foot-to-foot measurement inherent to lower tem-poral resolution on mean velocity curves compared to pressure curves, the transit time (∆t) was calculated automatically using a method based on the least squares minimization approach between the systolic up-slope of the ascending aorta mean velocity curve, and the whole descending aorta mean velocity curve. The systolic up-slope was defined as the portion of the mean velocity curve comprised between the onset of the blood flow and the time of its maximum. This up-slope portion was preferred to the entire flow curve because of the unidirectional and reflectionless nature of the flow wave during this systolic phase as shown in [16,26].
First, the mean velocity waveforms were re-sampled to a temporal resolution of 1 ms using a cubic interpola-tion, and were normalized to account for the differences between the waveform amplitudes. Then, the transit time (∆t) was calculated as the time shift for which the resemblance between the profile of the systolic up-slope of the normalized mean ascending aorta velocity waveforms (E*A), and the normalized descending aorta waveform (ED) was maximal. This maximal resemblance
Figure 1 Estimation of the aortic length. Estimation of the aortic length from the axial and coronal slices with a 3D Bezier curve interpolation.
was obtained by shifting ED by successive temporal
translations with a unitary step of 1 ms, and by mini-mizing the quadratic error (Er) between E*A and ED.
Er k N E iA E iD k i N ( )=
(
*( )− ( + ))
. =∑
1 2 1 (3)Here, k is the temporal translation, and N is the num-ber of samples of the systolic up-slope E*A.
The transit time ∆t was then provided as follows:
Δt k with Er k Er k k = + + =
{
}
∈ ( ) min ( ) . [ ,0 100] (4)The estimation of the aortic arch length and the tran-sit time was repeated by two independent operators to assess inter-observers variability.
Local ascending aorta strain and distensibility
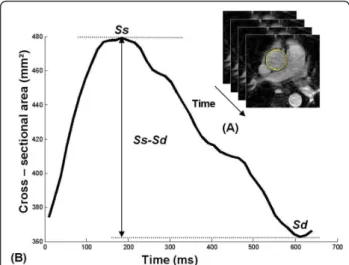
The local aortic strain (AA_Strain) was calculated from the systolic (Ss) and diastolic (Sd) areas of the aortic lumen at the level of the ascending aorta (AA_Strain = (Ss-Sd)/Sd). These lumen areas were measured from SSFP cine MR acquisitions using the automatic segmen-tation previously used on PC modulus images [30]. The Ssand Sd areas were defined as the maximum and the minimum of the curve describing the lumen area varia-tion during the cardiac cycle (Figure 2).
According to the equation (2), the combination of the resulting strain with either the tonometric carotid pulse pressure or the brachial pulse pressure provided the
ascending aorta distensibility indices, respectively named AA_Distcand AA_Distb.
Local theoretical ascending aorta pulse wave velocity
The local theoretical indices of ascending aorta PWV AA_PWVcand AA_PWVb were estimated according to the Bramwell-Hill equation (1) from the above local indices of ascending aorta distensibility.
Statistical analysis
Comparisons were performed using linear regression analysis, as well as mean ± standard deviation (SD). For regression analysis Pearson’s correlation coefficient®was provided, and statistical significance was indicated by p < 0.05. The inter-observer variability was studied using the coefficient of variation defined as the standard deviation of the differences between two series of mea-surements divided by the mean of the meamea-surements.
Results
The characteristics as well as the estimated aortic and arterial stiffness indices obtained for the 46 volunteers are summarized in Table 1.
Arch_PWVestimation
Reproducibility of the CMR regional Arch_PWV index was measured by repeating the estimation of the aortic length and the transit time by two operators. The aver-age length of the aortic arch was 12.1 ± 2.1 cm for the first operator, and 12.3 ± 2.1 cm for the second opera-tor; providing a coefficient of variation of 4.0%. The average transit time was 29 ± 5 ms for the first operator, and 28 ± 5 ms for the second operator; providing a coefficient of variation of 4.4%. These two parameters resulted in a coefficient of variation of 7.1% for the
Figure 2 Determination of the aortic cross-sectional area during a cardiac cycle. (A): automatic contouring of the ascending aorta. (B): ascending aorta cross-sectional area versus time curve; Ss and Sd correspond to the ascending aorta systolic and diastolic areas, respectively.
Table 1 Subjects characteristics
Parameters Subjects (n = 46)
Age (years) 39 ± 15
Body mass index (kg.m-2) 23.75 ± 3.4
Aortic length (cm) 12.1 ± 2.1
Carotid pulse pressure (mmHg) 35.9 ± 10.6 Brachial pulse pressure (mmHg) 45.4 ± 10
Arch_PWV (m.s-1) 4.34 ± 1.29 CF_PWV (m.s-1) 7.07 ± 3.19 AA_Distc (10-3mmHg-1) 5.86 ± 3.23 AA_Distb (10-3mmHg-1) 4.52 ± 2.4 AA_PWVc (m.s-1) 5.55 ± 2.55 AA_PWVb (m.s-1) 6.26 ± 2.83
Subjects characteristics are expressed as Mean ± SD.; Arch_PWV: regional aortic arch PWV assessed with MRI; CF_PWV: global aortic PWV assessed with tonometry; AA_Distc and AA_Distb: local ascending aorta distensibility estimated from MRI aortic strain and carotid or brachial pulse pressures; AA_PWVc and AA_PWVb: local ascending aorta PWV estimated according equation (1) from AA_Distc or AA_Distb.
Dogui et al. Journal of Cardiovascular Magnetic Resonance 2011, 13:11 http://www.jcmr-online.com/content/13/1/11
estimation of the Arch_PWV. Furthermore, the linear regression analysis between this latter parameter and the tonometric CF_PWV resulted in a correlation of r = 0.69 (p < 0.001). The equation of the linear regression was Arch_PWV = 0.28× CF_PWV +2.33.
Comparison between regional index Arch_PWV and both local indices AA_Distc and AA_Distb
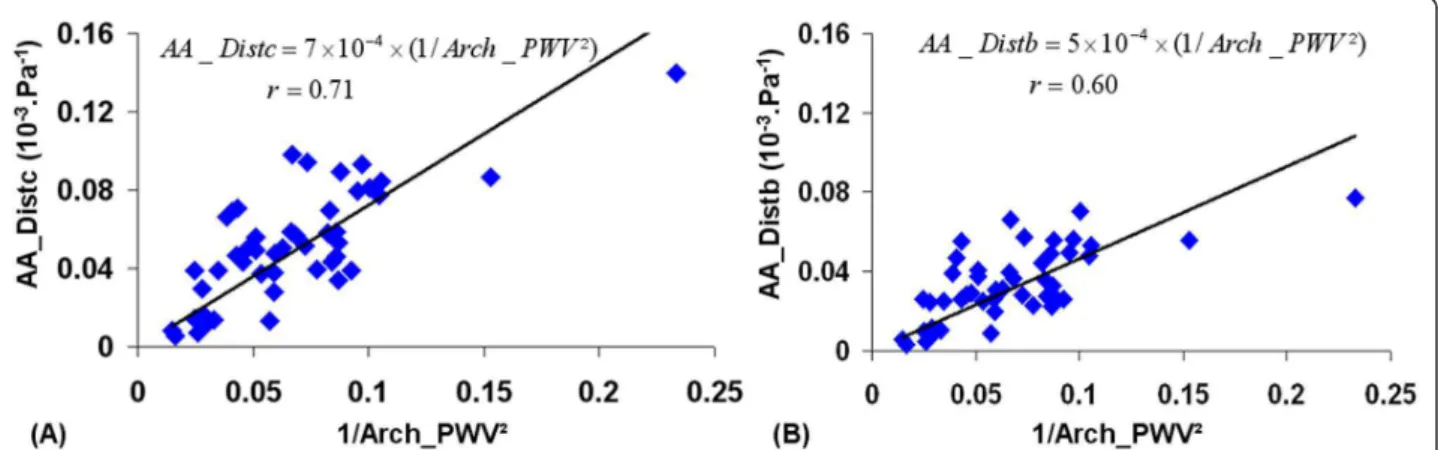
Given the Bramwell-Hill equation (1), linear regressions between local ascending aortic distensibility indices AA_Distc, AA_Distb, respectively, and 1/Arch_PWV2 were performed and shown in figure 3. The relationship between these indices resulted in a Pearson coefficient of r = 0.71 (p < 0.001) between AA_Distc and 1/Arch_PWV2 ; and of r = 0.60 (p < 0.001) between AA_Distband 1/Arch_PWV2. In addition, when the car-otid pulse pressure was used for the estimation of the local ascending aorta distensibility, the slope (7×10⁻⁴) of the linear regression was closer to theoretical value cal-culated from the blood density in Bramwell-Hill equa-tion (1) (1/r = 9×10⁻⁴). This slope was equal to 5×10⁻⁴ when the brachial pulse pressure was used for the esti-mation of the local ascending aorta distensibility.
Comparison between regional index Arch_PWV and both local indices AA_PWVc and AA_PWVb
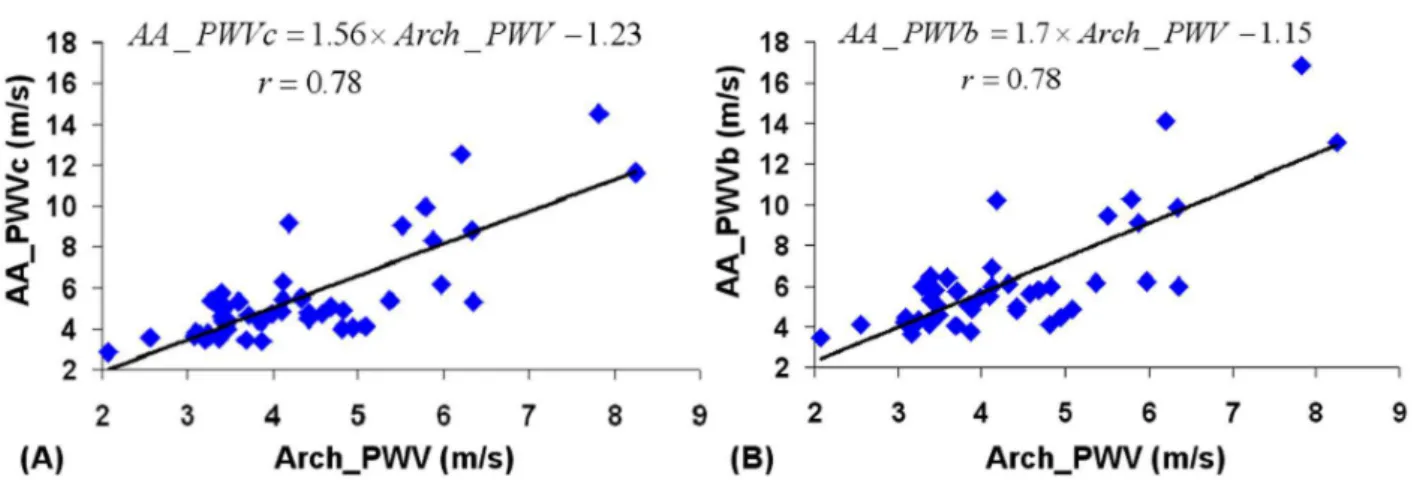
The local aortic pulse wave velocity AA_PWVc and AA_PWVb indices were compared with the regional Arch_PWV index, resulting in Pearson’s correlation coefficient of r = 0.78 (p < 0.001) for both AA_PWVc and AA_PWVb. These comparisons are shown in Figure 4. However, the regression analysis indicated that the regional Arch_PWV was lower than both the local theoretical AA_PWVc and AA_PWVb. As shown in Table 2, these differences were more important for the highest values of PWV. Indeed, when considering
subject < = 50 years old (n = 37), the mean value of these differences decreases from 1.21 (SD = 1.71) to 0.75 (SD = 1.06) for AA_PWVc, and from 1.92 (SD = 1.99) to 1.37 (SD = 1.2) for AA_PWVb. Furthermore, the slope of the linear regression was slightly lower when the carotid pulse pressure was used for the esti-mation of the local ascending aorta PWV.
Discussion
In this study, the indices of aortic stiffness were assessed automatically and non-invasively using CMR and pulse pressure measurements. The consistency of the CMR indices was investigated using the theoretical model (1), a comparison with the independent measurement of the arterial stiffness using the tonometric CF_PWV, and an inter-observer variability analysis.
Although the aortic distensibility (AA_Distc, AA_Distb) is a local index, while the aortic arch PWV (Arch_PWV) is a regional index, their relationships were well characterized according to the Bramwell-Hill model. Indeed, the consistency of our CMR measure-ments of aortic stiffness was confirmed by the good cor-relations found when comparing: 1) 1/Arch_PWV 2with the local distensibility indices AA_Distc and AA_Distb estimated from AA_Strain and carotid or brachial pulse pressures, and 2) the aortic Arch_PWV with the local theoretical indices AA_PWVc and AA_PWVb estimated according to the equation (1).
Slight differences were found when comparing AA_PWVcand AA_PWVb with the Arch_PWV. These differences which were consistent with results of a previous study that compared AA_PWVb against Arch_PWV, can be explained by the fact that the com-parison was performed between a regional and a local measurement. To reduce these differences, two direc-tional in-plane velocity encoded data [32,33] could be
Figure 3 Correlations between local ascending aorta distensibility and regional aortic arch PWV. (A): comparison between AA_Distc and 1/Arch_PWV2. (B): comparison between AA_Distb and 1/Arch_PWV2. AA_Distc and AA_Distb: local ascending aorta distensibility estimated from
used to calculate the PWV at the same site than the theoretical estimation. In addition, the differences between the local theoretical PWV measurements in the ascending aorta and the regional Arch_PWV were more important for subjects with the highest PWV values. This might be due to the more pronounced effect of aging on the ascending aorta [29], where there are more elastin fibers than in the other parts of the aorta [34]. Despite these differences good correlations between the Arch_PWVand the local theoretical indices AA_PWVc and AA_PWVb were found in our study.
Of note, a slope of linear regression closer to (1/r) and a higher correlation coefficient were obtained for the comparison between 1/Arch_PWV2 and AA_Distc than for the comparison between 1/Arch_PWV2 and AA_Distb. In addition, lower mean difference and slope closer to 1 were obtained for the comparison between the Arch_PWV and the AA_PWVc than for the compari-son between the Arch_PWV and the AA_PWVb. These finding indicated that, according to the Bramwell-Hill equation (1) applied on the ascending aorta, the Arch_PWVwas better related to the ascending aorta dis-tensibility estimated from carotid pulse pressure than from brachial pulse pressure. This might be due to the
fact that the carotid pulse pressure assessed by tonome-try is more representative for the aortic pulse pressure [11]. Indeed, data from invasive studies showed that car-otid artery pulse pressure only slightly overestimate the pulse pressure in the ascending aorta with less than 2 mmHg [35].
In our study, the analysis of the CMR SSFP and PC cine data was performed using a robust segmentation technique based on a (2D+t) snake algorithm. This mentation technique was previously used for the seg-mentation of the ascending and descending aorta data that were acquired on three different MR devices, result-ing in a very high intra- and inter-observers reproduci-bility [30]. It has been also validated against manual tracing for both healthy volunteers and patients with dilated aorta [30].
The aortic arch PWV (Arch_PWV) was estimated from the length of the aortic arch, and the temporal shift between the mean velocity waveforms in the ascending and descending aorta. In our study, a 3D approach was used to assess the aortic arch length from both the coronal and axial slices, rather than the tradi-tional 2D measurement which is usually performed from a single sagittal oblique section by a manual selec-tion of the centreline of the aorta [13,15-17]. The advan-tage of our 3D technique is its ability to better take into account the 3D geometry of the aorta. Indeed, the cur-vature of the aortic arch is not always aligned in a speci-fic plane regarding to the position of the ascending and descending aorta. Since our technique required a man-ual positioning of the centers of the aorta lumen on axial and coronal data acquired during two successive apneas, its reproducibility was studied, resulting in very low inter-observer variability. The transit time was esti-mated from the systolic up-slope portion of the velocity
Figure 4 Correlations between local ascending aorta PWV and regional aortic arch PWV. (A): comparison between AA_PWVtc and Arch_PWV. (B): comparison between AA_PWVb and Arch_PWV. AA_PWVc and AA_PWVb: local ascending aorta PWV estimated according equation (1) from AA_Distc or AA_Distb; Arch_PWV: regional aortic arch PWV assessed with CMR.
Table 2 Results of the local and regional PWV measurements
Pulse wave velocity Subjects ≤ 50 years (n = 37) Subjects >50 years (n = 9) Arch_PWV (m/s) 3.84 ± 0.75 6.39 ± 0.99 AA_PWVc (m/s) 4.59 ± 1.11 9.49 ± 3.07 AA_PWVb (m/s) 5.22 ± 1.22 10.55 ± 3.57
PWV are expressed as Mean ± SD; Arch_PWV: regional aortic arch PWV assessed with MRI; AA_PWVc and AA_PWVb: local ascending aorta PWV estimated according equation (1) from AA_Distc or AA_Distb.
Dogui et al. Journal of Cardiovascular Magnetic Resonance 2011, 13:11 http://www.jcmr-online.com/content/13/1/11
waves using an automated method based on a least squares minimization technique used in previous stu-dies for the evaluation of the effect of coarctation repair [20] and aging [21] on CMR aortic stiffness indices. Other methods based on the foot-to-foot [18] or on the cross-correlation [32] were used to estimate the transit time. Similar to the foot-to-foot approaches, the systolic up-slope was considered in our method rather than the entire curve as proposed in the cross-correlation methods. This choice was based on the unidirectional and reflectionless nature of the systolic up-slope [16,26] and aimed at minimizing the influ-ence of the morphology of the downslope which may be altered by aortic stiffening and disorganization of the flow during end systole.
The reproducibility of the transit time estimation resulted in a low inter-operator variability as reflected by a coefficient of variation of 4.4%. In addition, the combination of this transit time with the estimated aor-tic arch length resulted in a reproducible estimate of Arch_PWV. Indeed the coefficient of variation obtained in the present study was lower than the coefficient of 13% presented in a previous study [18].
Furthermore, the estimated Arch_PWV was well corre-lated to the tonometric CF_PWV. However, values of CF_PWV were consistently higher. This can be explained by physiological reasons. Indeed, the elastic properties of the conduit arteries vary along the arterial tree, with more elastic proximal arteries and stiffer distal arteries [34-36]. Therefore PWV increases from central to peripheries arteries, for example from 4-5 m.s-1in
the aortic arch to 8-9 m.s-1 in the iliac and femoral
arteries [37].
The transit time and subsequently the arch-PWV esti-mations could be influenced by the temporal resolution of the PC data. In the present study, breath-hold techni-que was used for the PC acquisition resulting in a lower temporal resolution compared to other validated free breathing acquisition techniques [18]. However, this later technique requires longer acquisition time and is exposed to more variation of the RR-interval during the acquisition as well as to the displacement of the aortic region of interest throughout the acquisition plane.
Another limitation is the use of CF_PWV values for comparison instead of invasive gold standard values. Indeed, it has been demonstrated that the CF_PWV cal-culation was influenced by the body shape and size [21]. However, it has been also demonstrated that in subjects with body mass index values <35 kg m-2the CF_PWV validly reflects aortic PWV values [38]. Therefore, because of the low body mass index of the studied population (23.75 ± 3.4 kg m-2), the effect of body shape was supposed to be minimal providing accurate CF_PWVvalues.
Conclusions
Local and regional aortic stiffness indices were computed from a combination of CMR measurements with pulse pressure data. The consistency of these indices according to the theoretical model and to the well established tonometry measurement of the global aortic stiffness was demonstrated. The addition of such post processing techniques to the established CMR tools may prove clinically useful for the local evaluation of the aortic stiffness, especially in patients with localized aortic stiffness, such as subjects with Marfan disease. Therefore, CMR regional measurements in the ascend-ing aorta and on the aortic arch should be clinically relevant because of the proximal position of these seg-ments regarding to the left ventricle, and of their effects on its working conditions and consequently its physiopathology.
Author details
1
Inserm U678, 91 boulevard de l’Hôpital, 75634 Paris cedex 13, France.2
AP-HP, Service de Radiologie Cardiovasculaire, Hôpital Européen Georges Pompidou, 20 rue Leblanc, Paris, 75015, France.
Authors’ contributions
AD participated in the conception and design of the study, in the technical developments, and in writing the manuscript. NK and FF participated in the conception and the revision of the manuscript. ML participated in data processing. ADC participated in the technical developments. EM participated in revising the manuscript, and in the acquisition and interpretation of data. AH participated in the technical developments, in the design and coordination of the study. All authors revised, read and approved the final version of the manuscript.
Competing interests
The authors declare that they have no competing interests. Received: 7 September 2010 Accepted: 27 January 2011 Published: 27 January 2011
References
1. Benetos A: Pulse pressure and cardiovascular risk. J Hypertens Suppl 1999, 17:S21-24.
2. Nichols WW, Edwards DG: Arterial elastance and wave reflection augmentation of systolic blood pressure: deleterious effects and implications for therapy. J Cardiovasc Pharmacol Ther 2001, 6:5-21. 3. Nussbacher A, Gerstenblith G, O’Connor FC, Becker LC, Kass DA,
Schulman SP, Fleg JL, Lakatta EG: Hemodynamic effects of unloading the old heart. Am J Physiol 1999, 277:H1863-1871.
4. Franklin SS, Khan SA, Wong ND, Larson MG, Levy D: Is pulse pressure useful in predicting risk for coronary heart Disease? The Framingham heart study. Circulation 1999, 100:354-360.
5. Ohtsuka S, Kakihana M, Watanabe H, Sugishita Y: Chronically decreased aortic distensibility causes deterioration of coronary perfusion during increased left ventricular contraction. J Am Coll Cardiol 1994, 24:1406-1414.
6. Blacher J, Safar ME, Guerin AP, Pannier B, Marchais SJ, London GM: Aortic pulse wave velocity index and mortality in end-stage renal disease. Kidney Int 2003, 63:1852-1860.
7. Boutouyrie P, Tropeano AI, Asmar R, Gautier I, Benetos A, Lacolley P, Laurent S: Aortic stiffness is an independent predictor of primary coronary events in hypertensive patients: a longitudinal study. Hypertension 2002, 39:10-15.
8. Laurent S, Boutouyrie P, Asmar R, Gautier I, Laloux B, Guize L,
all-cause and cardiovascular mortality in hypertensive patients. Hypertension 2001, 37:1236-1241.
9. Meaume S, Benetos A, Henry OF, Rudnichi A, Safar ME: Aortic pulse wave velocity predicts cardiovascular mortality in subjects >70 years of age. Arterioscler Thromb Vasc Biol 2001, 21:2046-2050.
10. Safar ME, Henry O, Meaume S: Aortic pulse wave velocity: an independent marker of cardiovascular risk. Am J Geriatr Cardiol 2002, 11:295-298.
11. Laurent S, Cockcroft J, Van Bortel L, Boutouyrie P, Giannattasio C, Hayoz D, Pannier B, Vlachopoulos C, Wilkinson I, Struijker-Boudier H: Expert consensus document on arterial stiffness: methodological issues and clinical applications. Eur Heart J 2006, 27:2588-2605.
12. McDonald DA: Regional pulse-wave velocity in the arterial tree. J Appl Physiol 1968, 24:73-78.
13. Groenink M, de Roos A, Mulder BJ, Spaan JA, van der Wall EE: Changes in aortic distensibility and pulse wave velocity assessed with magnetic resonance imaging following beta-blocker therapy in the Marfan syndrome. Am J Cardiol 1998, 82:203-208.
14. Laffon E, Marthan R, Montaudon M, Latrabe V, Laurent F, Ducassou D: Feasibility of aortic pulse pressure and pressure wave velocity MRI measurement in young adults. J Magn Reson Imaging 2005, 21:53-58. 15. Mohiaddin RH, Firmin DN, Longmore DB: Age-related changes of human
aortic flow wave velocity measured noninvasively by magnetic resonance imaging. J Appl Physiol 1993, 74:492-497.
16. Vulliemoz S, Stergiopulos N, Meuli R: Estimation of local aortic elastic properties with MRI. Magn Reson Med 2002, 47:649-654.
17. Groenink M, de Roos A, Mulder BJ, Verbeeten B Jr, Timmermans J, Zwinderman AH, Spaan JA, van der Wall EE: Biophysical properties of the normal-sized aorta in patients with Marfan syndrome: evaluation with MR flow mapping. Radiology 2001, 219:535-540.
18. Grotenhuis HB, Westenberg JJ, Steendijk P, van der Geest RJ, Ottenkamp J, Bax JJ, Jukema JW, de Roos A: Validation and reproducibility of aortic pulse wave velocity as assessed with velocity-encoded MRI. J Magn Reson Imaging 2009, 30:521-526.
19. Lalande A, Khau Van Kien P, Walker PM, Zhu L, Legrand L, Claustres M, Jeunemaitre X, Brunotte F, Wolf JE: Compliance and pulse wave velocity assessed by MRI detect early aortic impairment in young patients with mutation of the smooth muscle myosin heavy chain. J Magn Reson Imaging 2008, 28:1180-1187.
20. Ou P, Celermajer DS, Jolivet O, Buyens F, Herment A, Sidi D, Bonnet D, Mousseaux E: Increased central aortic stiffness and left ventricular mass in normotensive young subjects after successful coarctation repair. Am Heart J 2008, 155:187-193.
21. Redheuil A, Yu WC, Wu CO, Mousseaux E, de Cesare A, Yan R,
Kachenoura N, Bluemke D, Lima JA: Reduced ascending aortic strain and distensibility: earliest manifestations of vascular aging in humans. Hypertension 55:319-326.
22. Rerkpattanapipat P, Hundley WG, Link KM, Brubaker PH, Hamilton CA, Darty SN, Morgan TM, Kitzman DW: Relation of aortic distensibility determined by magnetic resonance imaging in patients > or = 60 years of age to systolic heart failure and exercise capacity. Am J Cardiol 2002, 90:1221-1225.
23. Rogers WJ, Hu YL, Coast D, Vido DA, Kramer CM, Pyeritz RE, Reichek N: Age-associated changes in regional aortic pulse wave velocity. J Am Coll Cardiol 2001, 38:1123-1129.
24. Mohiaddin RH, Underwood SR, Bogren HG, Firmin DN, Klipstein RH, Rees RS, Longmore DB: Regional aortic compliance studied by magnetic resonance imaging: the effects of age, training, and coronary artery disease. Br Heart J 1989, 62:90-96.
25. Bramwell JC, Hill AV: The velocity of the pulse wave in man. Proc R Soc Lond B 1922, 93:298-306.
26. Nichols WW, O’Rourke M: In McDonald’s blood flow in arteries. Theoretical experimental and clinical principles Edited by: Arnold E 1998.
27. Grotenhuis HB, Westenberg JJ, Doornbos J, Kroft LJ, Schoof PH, Hazekamp MG, Vliegen HW, Ottenkamp J, de Roos A: Aortic root dysfunctioning and its effect on left ventricular function in Ross procedure patients assessed with magnetic resonance imaging. Am Heart J 2006, 152(975):e971-978.
28. Salvi P, Lio G, Labat C, Ricci E, Pannier B, Benetos A: Validation of a new non-invasive portable tonometer for determining arterial pressure wave
and pulse wave velocity: the PulsePen device. J Hypertens 2004, 22:2285-2293.
29. Sugawara J, Hayashi K, Yokoi T, Tanaka H: Age-associated elongation of the ascending aorta in adults. JACC Cardiovasc Imaging 2008, 1:739-748. 30. Herment A, Kachenoura N, Lefort M, Bensalah M, Dogui A, Frouin F,
Mousseaux E, De Cesare A: Automated segmentation of the aorta from phase contrast MR images: validation against expert tracing in healthy volunteers and in patients with a dilated aorta. J Magn Reson Imaging 2010, 31:881-888.
31. Ou P, Celermajer DS, Raisky O, Jolivet O, Buyens F, Herment A, Sidi D, Bonnet D, Mousseaux E: Angular (Gothic) aortic arch leads to enhanced systolic wave reflection, central aortic stiffness, and increased left ventricular mass late after aortic coarctation repair: evaluation with magnetic resonance flow mapping. J Thorac Cardiovasc Surg 2008, 135:62-68.
32. Fielden SW, Fornwalt BK, Jerosch-Herold M, Eisner RL, Stillman AE, Oshinski JN: A new method for the determination of aortic pulse wave velocity using cross-correlation on 2D PCMR velocity data. J Magn Reson Imaging 2008, 27:1382-1387.
33. Westenberg JJ, de Roos A, Grotenhuis HB, Steendijk P, Hendriksen D, van den Boogaard PJ, van der Geest RJ, Bax JJ, Jukema JW, Reiber JH: Improved aortic pulse wave velocity assessment from multislice two-directional in-plane velocity-encoded magnetic resonance imaging. J Magn Reson Imaging 32:1086-1094.
34. O’Rourke M, Farnsworth A, O’Rourke J: Aortic dimensions and stiffness in normal adults. JACC Cardiovasc Imaging 2008, 1:749-751.
35. Van Bortel LM, Balkestein EJ, van der Heijden-Spek JJ, Vanmolkot FH, Staessen JA, Kragten JA, Vredeveld JW, Safar ME, Struijker Boudier HA, Hoeks AP: Non-invasive assessment of local arterial pulse pressure: comparison of applanation tonometry and echo-tracking. J Hypertens 2001, 19:1037-1044.
36. Clark JM, Glagov S: Transmural organization of the arterial media. The lamellar unit revisited. Arteriosclerosis 1985, 5:19-34.
37. Latham RD, Westerhof N, Sipkema P, Rubal BJ, Reuderink P, Murgo JP: Regional wave travel and reflections along the human aorta: a study with six simultaneous micromanometric pressures. Circulation 1985, 72:1257-1269.
38. Joly L, Perret-Guillaume C, Kearney-Schwartz A, Salvi P, Mandry D, Marie PY, Karcher G, Rossignol P, Zannad F, Benetos A: Pulse wave velocity assessment by external noninvasive devices and phase-contrast magnetic resonance imaging in the obese. Hypertension 2009, 54:421-426.
doi:10.1186/1532-429X-13-11
Cite this article as: Dogui et al.: Consistency of aortic distensibility and pulse wave velocity estimates with respect to the Bramwell-Hill theoretical model: a cardiovascular magnetic resonance study. Journal of Cardiovascular Magnetic Resonance 2011 13:11.
Submit your next manuscript to BioMed Central and take full advantage of:
• Convenient online submission
• Thorough peer review
• No space constraints or color figure charges
• Immediate publication on acceptance
• Inclusion in PubMed, CAS, Scopus and Google Scholar
• Research which is freely available for redistribution
Submit your manuscript at www.biomedcentral.com/submit
Dogui et al. Journal of Cardiovascular Magnetic Resonance 2011, 13:11 http://www.jcmr-online.com/content/13/1/11