Development of a Core Design Optimization Tool and Analysis in Support of
the Planned LEU Conversion of the MIT Research Reactor (MITR-II)
by
HEATHER M. CONNAWAY
B.S. Nuclear Engineering, 2010
The University of Florida
Submitted to the Department of Nuclear Science and Engineering in Partial Fulfillment of the Requirements for the Degree of
Master of Science in Nuclear Science and Engineering at the
Massachusetts Institute of Technology September 2012
©2012 Massachusetts Institute of Technology All rights reserved
MASSACHUSErS INS~T1f1E FEB 'Y J) Signature of Author: Heather M. Connaway August 17, 2012 Certified by: Asfta't Aroffessor
A//
Accepted by: Benoit Forget, Ph.D. of Nuclear Science and Engineering Thesis Supervisor -K' '/)//L
Thomas H. Newton, Jr., Ph.D. Associate Director, Engineering, Nuclear Reactor Laboratory(
Thesis Readerid S. Kazimi, Ph.D. TEPCO Profes4 r of Nuclear Engineering Chair, Department Committee on Graduate Students
Development of a Core Design Optimization Tool and Analysis in Support of the
Planned LEU Conversion of the MIT Research Reactor (MITR-II)
by
HEATHER M. CONNAWAY
Submitted to the Department of Nuclear Science and Engineering in Partial Fulfillment of the Requirements for the Degree of
Master of Science in Nuclear Science and Engineering at the
Massachusetts Institute of Technology
ABSTRACT
The MIT Research Reactor (MITR-II) is currently undergoing analysis for the planned conversion from high enriched uranium (HEU) to low enriched uranium (LEU), as part of a global effort to minimize the availability of weapons-grade uranium. In support of efficient fuel management analysis with the new LEU fuel, a core design optimization tool has been developed. Using a coarse model, the tool can quickly consider the large range of refueling options available, and identify a solution which minimizes power peaking with the least fuel shuffling possible. The selected scheme can then be examined in greater detail with a more robust simulation tool.
The unique geometry of the MITR core makes it difficult to develop a model that both runs very quickly and provides detailed power distribution information. Therefore, a correlation-based approach has been employed. Relationships between burnup, critical control blade position, core Um mass, and power distribution are used to predict fuel element U23s depletion, critical control blade motion, and power peaking. The tool applies the correlations to identify an optimal loading pattern, defined as the core which has the lowest maximum radial peaking factor in the set of valid solutions with the minimum number of fuel shuffling actions. The correlations that are utilized by the optimization tool were developed using data from simulations with MCODE-FM, a fuel management wrapper for the MCNP-ORIGEN linkage code MCODE. The correlations have been verified with results from additional MCODE-FM runs, and the code logic has been verified with the core loading solutions for a variety of input parameters. The verification found that the code is able to predict radial peaking, core mass, and general control blade motion with sufficient accuracy to develop a good refueling scheme. The tool provides the output solution in an interactive format, which allows the user to quickly examine small perturbations on the identified loading pattern. In addition to the optimization tool development, loading patterns for the mixed HEU-LEU fuel transition cores have been evaluated. This analysis identified general behavioral trends of the mixed-fuel cores, which serve as an initial basis for future transition core analysis.
Thesis Supervisor: Benoit Forget
Acknowledgements
This work was sponsored by the Global Threat Reduction Initiative Program at Argonne National Laboratory.
I would like to thank my advisors Benoit Forget and Thomas Newton for their guidance and support. This project that has been an excellent learning experience for me, and they have provided very helpful advice and feedback throughout my time here at MIT. I would also like to thank Nick Horelik, who spent a great deal of time demonstrating the fundamentals of MCODE-FM. He was always very willing to help whenever I ran into trouble, and his well-structured code work served as an excellent example when developing my own code. I am also grateful to Lin-Wen Hu and Ed Pilat for their feedback throughout my time working on the conversion project, and to Paul Romano for his assistance when I was just getting started. In addition, I would like to thank Argonne National Laboratory employees Benoit Dionne and Arne Olson for taking the time to meet with me. Their feedback strongly influenced the direction of my research.
I am also grateful to my NSE classmates, particularly my fellow Gators, for making my time at MIT and in Boston much more enjoyable. Finally, I would like to thank my parents, brothers Patrick and Sean, and boyfriend Adam for their love and encouragement. I am very fortunate to have such a strong support system, and I would not be where I am today without them.
Table of Contents
I IN TRO DU CTION ... 14
1.1 Objectives... 14
1.2 M ITR D escription ... 15
1.3 M ITR Fuel Elem ents... 17
1.4 Current M ITR Fuel M anagem ent... 20
2 LEU REFUELING CORE-DESIGN OPTIMIZATION TOOL ... 22
2.1 Selected Approach... 22
2.2 Analysis and Correlations ... 24
2.2.1 Criticality, Cycle Length, and Control Blade Movement ... 25
2.2.2 Pow er D istribution... 37
2.3 M ethodology ... 51
2.3.1 Evaluation of Previous Core ... 53
2.3.2 Determination of Core U23s Mass Needed to Achieve Target Burnup... 56
2.3.3 Elem ent Evaluation... 60
2.3.4 Placing Fresh Elem ents... 60
2.3.5 M aking Required Loading Pattern Changes ... 61
2.3.6 Full Optim ized Search ... 62
2 .4 U sa g e ... 6 6 2.4.1 G U I Interface ... 66
2.4.2 Output ... 69
2.5 V erification... 72
2.5.1 V erification of Code M ethodology... 72
2.5.2 V erification of Correlations... 79
3 TRAN SITION CORE AN A LY SIS... 91
4 CON CLU SION S ... 97
5 FU TU RE W O RK ... 98
REFEREN CES ... 100
APPENDIX A - OPTIMIZATION TOOL SOURCE CODE ... 102
A .] gui/Optim izerGuiD ialog.py... 102 A .2 utils/LEU core optim ization.py ... 1 10
A .3 utils/getcurrent core.py... 115
A .4 utils/opt-subs.py... 125
A .5 utils/shuffle subs.py... 150
List of Figures
Figure 1-1 Cross-Sectional View of the MITR Core [6]... 16
Figure 1-2 Engineering Drawing of an HEU Fuel Element [7]... 17
Figure 1-3 Cross-Sectional Engineering Drawing of an HEU Fuel Element [7] ... 17
Figure 1-4 Schematic of the Proposed LEU Fuel Element Design [2]... 18
Figure 2-1 REBUS-PC Model of the MITR-1I Core [6]... 23
Figure 2-2 Critical Blade Position, Depletion of Cores 179-190 [2]... 24
Figure 2-3 Critical Blade Position, LEU Equilibrium Run, Core 190 (7 MW)... 25
Figure 2-4 U 23 Mass in Core as a Function of (a) Time and (b) Burnup... 26
Figure 2-5 U 23 Mass Lost as a Function of Burnup... 27
Figure 2-6 U2 35 Mass Lost by an Individual Element vs. Core Burnup, for LEU Equilibrium Core 1 9 0 ... 2 8 Figure 2-7 Element Depletion Rate vs. Element Mass Peaking Factor... 29
Figure 2-8 Allowable LEU Element BOC and EOC U 23 Mass Ranges for Each Ring ... 30
Figure 2-9 Critical Blade Position as a Function of U2 3 5 Mass in the Core, LEU Equilibrium Core 1 9 0 ... 3 1 Figure 2-10 Critical Control Blade Position for 3,4,5, and 6 New LEU Fuel Elements Added to th e S am e C o re ... 3 2 Figure 2-11 Critical Blade Position vs. Mass, LEU Equilibrium Cores 187-190, 7 MW, steps 2 to E O C ... 3 2 Figure 2-12 Data Fits for the Power-Dependent Critical Blade Position vs. Core U2 35 Mass Equations, Steps 2 to EOC, for Equation Parameters (a) Slope and (b) Y-Intercept ... 33
Figure 2-13 Critical Control Blade Position vs. Core U235 Mass, Steps 0 to I... 34 Figure 2-14 Relative Change in Control Blade Position vs. Relative Change in Mass for All C o res, A ll P ow ers ... 3 5 Figure 2-15 Blade Worth Curves for LEU Equilibrium Cores... 36
Figure 2-16 Differential Blade Worth Curves for LEU Equilibrium Cores, LEU Cores 187-190, BOC and EOC... 36
Figure 2-17 Power Distribution (W) at (a) BOC and (b) EOC at Axial Level 3 (of 6) for a Core Loaded with the Sam e Element in Every Location ... 37
Figure 2-19 Data for Linear Fits to Element Maximum Radial Peaking Factors vs. Element Mass
Peaking Factors for location A 2, BO C ... 40
Figure 2-20 Data for Linear Fits to Element Maximum Radial Peaking Factors vs. Element Mass Peaking Factors for B-ring Locations, BOC... 40
Figure 2-21 Data for Linear Fits to Element Maximum Radial Peaking Factors vs. Element Mass Peaking Factors for C-ring Locations, BOC ... 41
Figure 2-22 Data for Linear Fits to Element Maximum Radial Peaking Factors vs. Element Mass Peaking Factors for location A2, EOC ... 41
Figure 2-23 Data for Linear Fits to Element Maximum Radial Peaking Factors vs. Element Mass Peaking Factors for B-ring Locations, EOC ... 42
Figure 2-24 Data for Linear Fits to Element Maximum Radial Peaking Factors vs. Element Mass Peaking Factors for C-ring Locations, EOC ... 42
Figure 2-25 (a) BOC Power (W), (b) BOC Mass (g), (c) EOC Power (W), and (d) EOC Mass (g), for Equilibrium Core 189, Location C2, Plate 18 ... 46
Figure 2-26 (a) Power (W) and (b) Mass (g) for Equilibrium Core 189, Location C2, Plate 18, A x ial Z on e 15 (of 18) ... 4 7 Figure 2-27 Preliminary Attempt to Correlate the Lateral Power Peaking Factors to Lateral Mass Peaking Factors for the First and Last Lateral Stripe; Data for select C-ring Elements, LEU Core 18 6 , B O C ... 4 8 Figure 2-28 Logical Flow Chart For the General Methodology of the Optimization Tool... 52
Figure 2-29 Logical Flow Chart for Evaluation of the Previous Core ... 54
Figure 2-30 Segmentation of a LEU Fuel Element Radially, Axially, and Laterally to Evaluate M ass B iases... 5 5 Figure 2-31 Example of a 'storedelements/storage mats' File from an MCODE-FM Run... 55
Figure 2-32 Example of Control Blade Behavior at the Maximum and Minimum Allowable BOC P o sitio n s ... 5 7 Figure 2-33 Example of Target Mass Range Analysis for 3 Different EOC Blade Position C o n strain ts ... 5 8 Figure 2-34 Logical Flow Chart For Calculation of U2 3 5 Mass Needed... 59
Figure 2-35 Flow Logic Diagram for the Evaluation of a Core Loading Pattern... 64
Figure 2-36 Flow Logic Diagram Summarizing the Approach of the Full Search Algorithm... 65
Figure 2-37 User Interface Window for Optimizing a New Core ... 66
Figure 2-39 Example of the Excel Output File Content with After Changes to the Element in C10 and the Target Cycle Length, (a) BOC and (b) EOC... 71
Figure 2-40 Comparison of the Correlation Predicated and MCODE-FM Calculated Maximum Radial Peaking Factors in Each Element for (a) BOC and (b) EOC for LEU Equilibrium Core
1 8 5 ... 8 0
Figure 2-41 Comparison of the Correlation Predicated and MCODE-FM Calculated Maximum Peaking Factors, (a) BOC Axial, (b) EOC Axial, (c) BOC Lateral, (d) EOC Lateral, for LEU E qu ilibrium C ore 185 ... 8 1
Figure 2-42 Critical Control Blade Position over LEU Equilibrium Core 185 ... 81
Figure 2-43 Individual Element Maximum Radial Peaking Factor Verification, (a) Core 191 BOC, (b) Core 191 EOC, (c) Core 192 BOC, (d) Core 192 EOC, (e) Core 193 BOC, (f) Core 193 EOC... 89 Figure 2-44 Critical Control Blade Position Verification, (a) Core 191, (b) Core 192, (c) Core
List of Tables
Table 1-1 A Comparison of HEU and LEU Element Dimensions [2] ... 19
Table 2-1 Linear Fit to M ass Loss vs. Burnup... 27
Table 2-2 Linear Fits to Individual Element Mass Loss Rates vs. Element Mass Peaking; Loss R ates in g/M W d ... 30
Table 2-3 Linear Fits to the Blade Position vs. Core Mass Values for LEU Equilibrium Cores 187 to 190, for M CODE-FM time steps Step 2 to EOC... 33
Table 2-4 Linear Fits against Core Power to the Slope and Y-intercept of the Blade Position vs. M ass E qu ation s ... 34
Table 2-5 Linear Fit to the Change in Critical Control Blade Position vs. Change in Core Mass Data for LEU Equilibrium Cores 187-190, MCODE-FM steps 0 to 2... 35
Table 2-6 Polynomial Fit to the Differential Blade Worth Data, LEU Cores 187-190... 36
Table 2-7 Summary of Individual Core Location Element Orientation / Plate Orientation R elation sh ip s... 3 9 Table 2-8 Linear Fits to the BOC Maximum Element Radial Peaking Factor vs. Element Mass P eak in g F actor D ata ... 4 3 Table 2-9 Linear Fits to the EOC Maximum Element Radial Peaking Factor vs. Element Mass P eak ing F actor D ata ... 44
Table 2-10 BOC Axial Power Peaking Factor Prediction; Data Set is Maximum Peaking Value in Each Element of LEU Equilibrium Cores 186-190 ... 49
Table 2-11 EOC Axial Power Peaking Factor Prediction; Data Set is Maximum Peaking Value in Each Element of LEU Equilibrium Cores 186-190 ... 49
Table 2-12 BOC Lateral Power Peaking Factor Prediction; Data Set is Maximum Peaking Value in Each Element of LEU Equilibrium Cores 186-190... 50
Table 2-13 EOC Lateral Power Peaking Factor Prediction; Data Set is Maximum Peaking Value in Each Element of LEU Equilibrium Cores 186-190 ... 50
Table 2-14 Source Code Files for the Optimization Tool... 51
Table 2-15 B-Ring Partner Locations for Placing 3 Fresh Elements... 61
Table 2-16 Description of Optimization Tool Interface Window Items... 67
Table 2-17 Solution From LEU 190, For Default Input Constraints of 50 days, 6 MW, 2.0 Maximum Peaking, 3 New, 48.0 Maximum EOC Blade, 17.0 Minimum BOC Blade, 35.0 M axim um B O C B lade ... 74
Table 2-18 Comparison of Solution (1) With Default Inputs, (2) With "keep" MIT 349 in Core, a n d ... 7 5
Table 2-19 Comparison of Solution with Maximum Peaking Constraint of 1.9... 77
Table 2-20 Comparison of Original Solutions with Case with Minimum BOC Critical Blade P o sition o f 2 9 cm ... 78
Table 2-21 MCODE Peaking Factor Values from MCNP Tally Data and the % Error in the Correlation Prediction of the Parameter, LEU Equilibrium Core 185, 6 radial/ 18 axial/ 4 Lateral M e sh ... 8 2 Table 2-22 Evaluation of the Depletion Correlations, LEU Equilibrium Core 185 ... 83
Table 2-23 Fuel Shuffling for Verification Cores 191-193 ... 84
Table 2-24 Individual Element U235 Depletion Verification ... 85
Table 2-25 Individual Element Maximum Radial Peaking Factor Verification... 86
Table 2-26 Individual Element Maximum Axial Peaking Factor Verification ... 87
Table 2-27 Individual Element Maximum Lateral Peaking Factor Verification... 88
Table 2-28 Critical Control Blade Position Verification ... 90
Table 3-1 Summary of the Transition Core Cases Discussed... 93
Table 3-2 Key Performance Parameters For Transition Cores Case 1 ... 94
Table 3-3 Key Performance Parameters for Transition Cores Case 2... 94
Table 3-4 Key Performance Parameters for Transition Core cases with 10,000 MWh bumup per core (a) Case 3, (b) Case 4 with 1 Lateral Zone Mesh, (c) Case 4 with 4 Lateral Zone Mesh, (d) Case 5 with 4 Lateral Zone Mesh ... 95
Table 3-5 Key Performance Parameters for Transition Core Cases at Higher Burnups (a) Case 4 at 15,000 MWh per core, I Lateral Zone Mesh, (b) Case 4 at 20,000 MWh per core, I Lateral Zone Mesh, (c) Case 5 at 15,000 MWh per core, 4 Lateral Zone Mesh, (d) Case 5 at 20,000 MWh for Core 192 and 15,000 MWh for all other Cores, 4 Lateral Zone Mesh ... 96
1
INTRODUCTION
1.1 ObjectivesThere is an ongoing effort worldwide to transition away from the use of highly enriched uranium (HEU) in research reactors. The Reduced Enrichment for Research and Test Reactors (RERTR) Program was established in the United States in 1978 to facilitate the conversion of HEU-fueled reactors to low enriched uranium (LEU). The use of LEU (defined as fuel with less than 20% uranium-235 enrichment) will minimize the availability of weapons-grade uranium. Increased fears of terrorism have resulted in a stronger push to convert all of the U.S. reactors as quickly as possible. A goal has been established to convert all domestic reactors to LEU by 2014. However, conversion by this date while maintaining operation is not feasible for higher power reactors, which require the development and qualification of a higher density fuel [1]. With the exception of the five high performance reactors, all other domestic civilian reactors have been successfully converted to HEU.
For the reactor facilities themselves, an important goal is to develop an LEU core which maintains the scientific usefulness of the reactor. The Massachusetts Institute of Technology Reactor (MITR-II) is a 6 MW tank-type research reactor located in Cambridge Massachusetts. It has a compact HEU-fueled core, and delivers a neutron flux comparable to that of a typical PWR. The MITR is planned for conversion to LEU using a new type of fuel based upon a uranium-molybdenum alloy (UMo). The LEU-fueled MITR core must meet in-core experimental needs such as neutron spectrum, reactivity, and size, and must be optimized to provide a high neutron flux to the experimental facilities [1 ],[2].
The MITR has a long operating history with HEU (discussed in detail in Section 1.2). The operators are therefore very adept at fuel management, and are able to employ standardized refueling approaches. They can roughly predict an appropriate way to refuel before they ever analyze a potential loading pattern with a simulation tool, and can design a shuffling pattern without having to evaluate an excessive number of cores. The LEU fuel, however, has very different material properties than HEU, and in addition the LEU fuel to be used in the MITR (discussed in Section 0) has not yet been employed in an operating reactor. An LEU-fueled core will not behave the same as an HEU fueled core, and the traditional assumptions regarding fuel management cannot automatically be applied to LEU. It will therefore be much more difficult to engage in efficient fuel management with the unfamiliar LEU fuel.
Fuel management is a crucial aspect of nuclear reactor operations. It involves a number of decisions, including the number of fresh elements to insert, the selection of partially-burned elements to employ, and the locations and orientations of these elements within the core. Proper fuel management minimizes the cost of the fuel cycle, while satisfying requirements for power, flux, and other parameters. This process is largely constrained by safety and operational limitations. There are numerous variables which must be considered in core design, which results in a massive decision space [3]. Reload optimization methods are necessary, which can accurately identify the optimal loading scheme from the full set of possible solutions, without undergoing the time-consuming practice of explicitly simulating every one with a set of full criticality and depletion models.
The goal of this project is to develop a refueling optimization code that can be used for reload analysis of the MITR following its conversion to LEU fuel. This tool is intended to evaluate a number of potential core arrangements very quickly using coarse models and select the best solution. A core designer can then analyze the chosen loading scheme more explicitly with the stronger existing fuel management tools. In support of the optimization tool, this analysis also seeks to evaluate and establish general trends related to criticality and the power distribution profile in LEU-fueled cores.
Another objective of this work is to analyze the predicted behavior of the core during the transition from HEU to LEU. The current plan for this conversion is to slowly introduce LEU into the HEU fueled reactor over a series of sequential cores of mixed fuel. The two fuel types have very different properties, and it is the objective of this analysis to verify that the transition cores can be employed without violating the safety constraints of the reactor, particularly power peaking.
1.2 MITR Description
The MIT Reactor is employed for a number of experimental purposes, including neutron activation analysis, neutron scattering, and the study of dose reduction, coolant chemistry, and irradiation effects [4]. It was initially designed as a D20 cooled and moderated core, and it first
achieved criticality in July of 1958 (MITR-I). The reactor was redesigned following optimization analysis and a re-evaluation of the facility needs, and the current MITR-II began operating in 1975 [1],[4]. The reactor was uprated from 5MW to 6MW in November of 2011. It can achieve maximum thermal and fast fluxes of 7.0E 3 n/cm2
-s and 1.7E14 n/cm2
MITR-II is a tank-type research reactor which currently employs HEU plate-type rhomboidal fuel elements. The core itself is hexagonal, with 27 available fuel positions. Typically 24 locations are fueled, and the remaining positions are available for in-core experiments. Core positions are categorized in concentric rings, referred to as the A-, B-, and C-rings. An illustration of the MITR core can be seen in Figure 1-1. The core is cooled and moderated by light water, with a surrounding heavy water reflector and graphite region. There are also a number of beam ports, which provide a neutron flux to experimental facilities [5]. The boron-stainless steel control blades are positioned on the periphery of the core, along each side of the hexagon. There is additional boron-impregnated stainless steel present in fixed absorbers in the radial arms extending from the core [1].
-Vernier Control Rod Core Structure
Core Tank
C l Control Blade
Control Blade Flow 'Relief Hole
Coolant Entrance Channel Fuel Element
1.3 MITR Fuel Elements
The current HEU fuel elements are composed of 93% enriched uranium contained in an aluminide cermet matrix. The plates are aluminum clad, with aluminum longitudinal fins included to enhance heat transfer. The fuel has a density of 3.7 g/cc, with a total loading of 506 g of 235
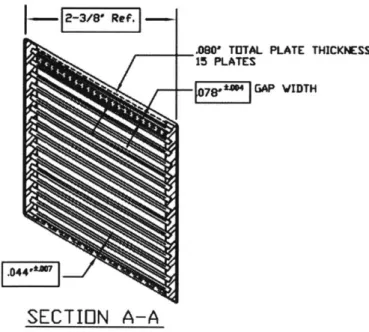
U per element [6]. Each rhomboidal fuel element contains 15 plates. The dimensions of the HEU elements can be seen in Figure 1-2 and Figure 1-3.
Figure 1-2 Engineering Drawing of an HEU Fuel Element 171
.000 TUTAL PLATE THICKNESS 15 PLATES
570'.7M4 GAP VIDTH
SECTION A-A
The proposed LEU fuel elements consist of a monolithic uranium-molybdenum alloy, arranged in 18 aluminum-clad plates. The uranium is enriched to 19.75% U23 5, and the fuel has a density of 17.02 g/cc [6]. The LEU fuel elements contain plates of an identical length and height to that of the HEU elements, but the plates have a thinner width to maintain the overall dimensions of the elements. Because of the significantly higher density, the LEU elements contain more U235 per element than the HEU fuel. A schematic of an LEU element is shown in Figure 1-4, and a comparison of the HEU and LEU fuel element dimensions is documented in Table 1-1.
Ik I
W3
h
flttoa .
Table 1-1 A Comparison of HEU and LEU Element Dimensions 121
Plate and Channel Dimensions HEU LEU
Fuel plate length (inch) 23 23
Fuel meat length (inch) 22.375 22.375
Fuel plates per assembly 15 18
Interior (full) channels per assembly 14 17
End (partial) channels per assembly 2 2
Fuel meat thickness (mil) 30 20
Fuel meat width (inch)a 2.082 2.082
Clad thickness (base of fin to fuel surface) 15 (6061 Al) 10 (6061 Al + Zr)
Plate to plate pitch, CL to CL (mil) 158 132
Interior channel water gap (fin tip-to-tip) (mil) 78 72
Effective interior channel thickness (mil) 88 82
Finned width (inch) a 2.2 2.2
Number of fins per plate 110 per side I 10 per side
Fin depth (mil) 10 10
Fin width (mil) 10 10
Width between fuel meat and side plate (mil) 113 113
Width between fins and side plate (mil) 54 54
Channel width (inch) a 2.308 2.308
Side plate thickness (mil) 188 188
Side plate flat-to-flat, outer edge of one side plate to 2.375 2.375 outer edge of second side plate on element (inch)
Element end flat-to-flat (inch) 2.38 2.38
Outer plate fin-tip to side plate end plane (mil) 44 38
Effective outer plate gap to side plate end plane (mil) 49 43
Outer plate fin-tip to nozzle at full width (mil) 56.5 50.5
1.4 Current MITR Fuel Management
Routine fuel management and bumup analysis calculations for the MITR are currently done using a CITATION-based model developed by Bernard in the 1970's [6]. CITATION is a finite difference diffusion theory code. By evaluating the fission density and burnup (as a percent of the limit) of each element, the elements to be removed are identified. The impact of replacing a burned element with a fresh element or element from storage is evaluated using a set of reactivity coefficients, specified in mili-beta per gram of 2 3 5U (mass difference between the two elements).
There also exists a REBUS-PC model of the MITR. REBUS-PC, a system of codes based upon DIF3D, can be used to solve for cycle-by-cycle operation for a given fuel loading scheme, or for equilibrium conditions of a fixed fuel management scheme. It was developed directly for the analysis of research reactor fuel cycles. To capture the unique geometry of the MITR core, the REBUS-PC model represents the reactor in a series of very small triangular meshes, with circular surfaces modeled by jagged boundaries. The model employs a 7-group neutron cross-section library generated by the ID transport code WIMS-ANL. WIMS produces collapsed cross-sections in a broad group structure, which are then written in ISOTXS format for use by
REBUS-PC. The ISOTXS cross-sections are burnup and spatially dependent [12]. REBUS-PC
was successful in modeling HEU cores. However, in trial analysis for LEU cores, the code was not able to achieve accurate results with the WIMS-ANL cross-sections. The REBUS-PC model is not currently used for fuel management [6].
In recent years, a graphical user interface and fuel management wrapper, called MCODE-FM, has been developed. This tool employs the MCNP-ORIGEN linkage code MCODE to model successive MITR cores [8]. MCODE (MCNP - ORIGEN Coupled Depletion) employs the
predictor-corrector method to calculate nuclide concentrations at each time step of a core lifetime using the continuous energy Monte Carlo Code MCNP5 and the point-depletion code
ORIGEN2.2. MCODE-FM creates MCODE input files for a sequence of fuel loading
configurations, accounting for changes in element positions, orientations, and compositions. Fuel elements can be shuffled, rotated, flipped, and stored. There is also an optional criticality search algorithm, which allows for tracking of the critical blade movement for a series of cores. MCODE-FM also allows the user to specify the per-element segmentation scheme, which is used for material depletion regions within an element and for MCNP cell regions in each plate [9].
MCODE-FM is equipped with a graphical user interface (GUI) for constructing and visualizing an MCODE-FM run for a sequence of core loading patterns. The tool also provides a suite of data analysis and visualization features, which can be used to study MCODE-FM results (including power peaking, 235
U mass changes, and overall power distribution) more closely [9]. The MCODE-FM package was recently enhanced, and has a number of new features including accurate tracking of element flips and rotations, treatment of in-core experiments or custom fuel
dummies, and more robust options for element segmentation. New modules have been introduced to aggregate data from sequential core output files and the code also now offers a function to create a VTK file of output data, which can be used for 3D visualization of core properties including power distribution [9].
Despite the robust nature of the existing core analysis tools, there remains room for additional development in the area of fuel management. Currently, multiple refueling core loading pattern options can only be compared "by hand" by generating a unique input file for each. MCODE-FM can model a particular core in great detail, but this can be a time-consuming process, and the user must specify the precise configuration to run. MCODE-FM is excellent for in-depth analysis once a reload scheme is selected, but is not ideal for evaluating a number of cases very quickly.
2
LEU REFUELING CORE-DESIGN OPTIMIZATION TOOL
2.1 Selected Approach
The optimization tool is intended to serve as an aid in quickly assessing the large number of refueling options available for a given LEU-fueled core. Development of the tool began with a review of many of the existing optimization methodologies [14],[15],[16]. The proposed approach for the tool underwent a great deal of evolution before arriving at the current implementation. A discussion of the
initially-pursued alternative approach makes it clear why this methodology was selected.
The initial plan was to develop a script which would automate the simulation of all available core loading schemes using REBUS-PC Version 1.4. As discussed in Chapter 1.4, there is an existing
REBUS-PC model for the MITR. REBUS-PC is used by the RERTR Program for core design
analysis, and provides neutron flux distribution in space, energy, and time, as well as isotropic changes in both fuel and absorbers with burnup [10]. The code analyzes reactor operating cycles by dividing them into subintervals, and performing burnup calculations over each subinterval using the average reaction rate of the subinterval. These average reaction rates are determined from diffusion theory solutions computed at the beginning and end of each subinterval. The entire process is then iterated until a desired convergence is achieved [11]. Upon completion of the REBUS-PC runs, the optimization program would then identify the best loading pattern based upon user-specified constraints and priorities, such as power-peaking limits and target burnup.
The unique geometry of the MITR core constrains somewhat the available tools for neutronics analysis. Many deterministic transport and diffusion theory codes do not have the capability to accurately treat the rhomboidal fuel elements and overall hexagonal core, while Monte Carlo codes are too time consuming for use in optimization. The CITATION model works well for routine fuel management, but it models the core using a series of concentric ring meshes and triangular radiating segments, creating a pie-like mesh that would not be constructive for comparing power peaking values in fine mesh volumes. For these reasons, REBUS was viewed as the primary code option.
In order to use REBUS for LEU core analysis, it would be necessary to make modifications to the WIMS cross-section model which, as discussed in Section 1.4, do not produce accurate results with LEU. It would also be necessary to create a new input model. The existing input, developed by Argonne National Laboratory (ANL), models the MITR very explicitly, as shown in the cross-sectional image of the model in Figure 2-1. However, simulation of this model takes far too long for it to be run several times in order to evaluate the full set of possible loading schemes.
Figure 2-1 REBUS-PC Model of the MITR-I1 Core 161
The idea was proposed that a new REBUS input structure could be developed which models the reactor much more coarsely, capturing all of the necessary information while running in the shortest time possible. Suggested changes included changing the meshing of the fuel elements and using an albedo to represent the reflector region. At this point, discussions were initiated with ANL RERTR staff members Dr. Arne Olson and Dr. Benoit Dionne to evaluate the feasibility of developing such a model. They raised several key points which led to the abandonment of this approach. To simulate a given fuel management program with a new geometry model, it would be necessary for the RERTR staff to make changes to the source code of the MIT Reactor Laboratory's version of REBUS. In addition, a REBUS model which had sufficiently large meshing for a number of configurations to be
simulated in a reasonable amount of time would not yield detailed information about the power distribution or peaking. Dr. Dionne proposed the idea that a similar degree of accuracy could potentially be achieved by developing a series of correlations for the relationships between burnup, core mass, critical blade position, and power distribution. This is the approach that has been implemented in the MITR refueling optimization tool. By employing a set of correlations and analysis-based loading pattern rules, the code is able to quickly identify an optimal loading pattern without the time-intensive process of explicitly modeling every available fuel shuffling option.
2.2 Analysis and Correlations
A great deal of analysis has been done in support of the optimization tool development. By examining
data from MCODE-FM simulations, fixed rules regarding fuel shuffling can be established and correlations which represent the relationships between reactor performance properties can be developed. Using this information, it is possible to approximate how a particular core will behave over a given bumup. The correlations that are discussed in this section are evaluated in Section 2.5 with MCODE-FM results.
The sequence of equilibrium cores initially modeled by Horelik were used as an analysis starting point [9]. In the "equilibrium" core run, MITR core configurations #178 through #190 were simulated, with cores 185 to 190 considered to be operating in pseudo-equilibrium, as captured in the control blade motion shown in Figure 2-2 [2]. The LEU element masses for this run were selected based upon a scaling of the target CITATION masses for each core. In all cores, locations Al, A3, and B3 were loaded with dummy elements. Each core was run at 0 power for 5 days prior to a full power run to simulate refueling, and the LEU cores were each burned for 47 days at 7MW. The simulation was done for a wide range of fuel element meshing schemes [9].
Core
179 180 181 182 183 184 185 186 187 188 189 190
Depletion detail effects developing Pseudo- equilibrium
C 50 0 o 3: 40 *~30 E 20 20 010 0 0 500 1000 1500 2000 2500 3000 3500 MWdays
2.2.1 Criticality, Cycle Length, and Control Blade Movement
The maximum full power burnup that can be achieved by a given core is dictated by the excess reactivity present at the beginning of the cycle (BOC). This excess reactivity is controlled by the mass of U235 present in the core, and is reflected in the control blade position needed to achieve criticality. The available reactivity can be monitored as the core bums by observing the movement of the control blade over the course of the core life, an example of which is shown in Figure 2-3.
50 --45 40 35 30 25 20 r-0 0 0 rU C Cu -C *6-' E U 50 100 150 200 Burnup (MWd) 250 300 350
Figure 2-3 Critical Blade Position, LEU Equilibrium Run, Core 190 (7 MW)
Over the first few days of operation, there is a relatively large withdrawal of the control blades to compensate for the poisoning effect of the fission products which begin to accumulate. As the major fission products reach equilibrium concentrations, there is a significant decrease in the rate of withdrawal. The size of this initial rapid control blade removal jump is related to the reactor power. In order to develop a full set of relationships for this, each of the final four cores of the equilibrium run were re-run at a set of powers.
As shown below in Figure 2-4a, for a given mass of initial U 23 in a core, the rate of U235 depletion is
linear when evaluated against the days of operation, and is dependent upon the reactor power - a higher power corresponds to a higher rate of fuel depletion. When compared against total burnup, the rate of depletion is also linear, and does not depend upon the reactor power (Figure 2-4b). Regardless of power, a given core will have roughly the same mass after a given burnup. Figure 2-4b still captures the fact that the cores at lower power experience a smaller total U235 loss, since for a given time period, a core has less total burnup at a lower power.
10 20 30 40 5 Days Operating at Full Power
17400 17300 17200 4 17100 17000 16900 16800 (a) Core18 9 Cor 8 I PMWV 6 rMw 7MW 100 150 200 Burnup (MWd) ---250 300 350 (b)
Figure 2-4 U235Mass in Core as a Function of (a) Time and (b) Burnup
-187,7 MW - 187,6 MW -- 187,5 MW 187, 4 MW 188, 7 MW 188,6 MW -188,5 MW -188,4 MW -189, 7 MW -189,6 MW 189, 5 MW 189, 4 MW -190,7 MW 0 - 190,6 MW - 190, 5 MW - 190,4 MW bb a) L-0 -16700 16600 16500 ---0 17500 17400 17300 17200 17100 17000 16900 16800 16700 16600 16500 bb 0 Un C 0 I--0 50
-To remove the dependence on initial core mass, this data can be plotted as the U235 mass lost vs. burnup (Figure 2-5). This yields a single linear trendline (Table 2-1), which is applicable to any core. This relationship is utilized by the optimization tool when assessing the initial mass of U235 needed to achieve a desired burnup.
450 400 350 300 250 200 150 100 50 0 0 50 100 150 200 Burnup (MWd) 250
----Figure 2-5 U2 Mass Lost as a Function of Burnup
Table 2-1 Linear Fit to Mass Loss vs. Burnup
300 35 X 190, 7 MW @190,6 MW + 190, 5 MW - 190, 4 MW 189, 7 MW *189,6 MW E 189, 5 MW A 189,4 MW X 188,7 MW X 188, 6MW 188, 5 MW 188, 4 MW *187, 7 MW * 187, 6 MW A 187, 5 MW 0 X 187,4 MW 0 -j in rn C4 0
When the tool evaluates the behavior of a particular core loading pattern, it is necessary to consider the depletion of the individual elements. To support this, two different types of relationships were developed. When the optimization tool evaluates the potential usefulness of each element prior to designing a new core, it does not yet know where the elements will be placed, or how their mass will compare to the core average - therefore the final masses of the elements must be approximated by using a linear fit to the average mass loss vs. burnup data for all elements in all rings of the core. However, when the tool is evaluating the behavior of a particular loading scheme, it knows where each of the elements is placed as well as how the element's mass relates to the average element mass in the core. Therefore more refined correlations can be applied that capture the effects of an element's location and relative mass.
Figure 2-6, below, documents the mass of U235
lost in each element of core 190 as a function of core burnup. As this plot demonstrates, each element in the core has a unique mass loss rate.
- 190 A2 *190 B2 A 190 B4 X 190 B6 l 190 B8 -190 B9 + 190 C1 * 190 C2 10 -- A190 C3 X 190 C4 X 190 C5 5 190 C6 + 190 C7 5 190 C8 '190 C9 190 Cl0 1J90 C11 190 C12 0 -190 C13 0 50 100 150 200 250 300 350 190 C14 Burnup (MWd) 190 C15
Figure 2-6 U235 Mass Lost by an Individual Element vs. Core Burnup, for LEU Equilibrium Core 190
To generate a complete set of correlations for individual element depletion, the depletion rate for each of the elements loaded in cores 187 to 190 has been plotted against its BOC element mass peaking factor (Figure 2-7), where the element mass peaking factor is defined as:
Element M ass Peaking F actor = U235 Mass in an Element Average Element U235 Mass
The depletion data is separated by ring. The optimization tool uses linear fits to these data sets to approximate the depletion of each element in a particular loading pattern. As discussed in further detail in Section 2.2.2, the locations with more initial U235 mass will have a larger fraction of the core
power distribution. Consequently, these locations deplete more, and have a larger loss in mass over a given burnup. In addition, for a given mass peaking factor, the global power shape within the core causes a larger depletion rate in A- and B-ring elements. Each of the depletion rate data points shown in Figure 2-7 represents a fit to the mass loss vs. bumup data for an individual element at burnup points 0, 7, 21, 70, 280, and 329 MWd. 0 Lfl r*J C 0 0W 0. 0 W3 0.07 0.06 0.05 0.04 0.03 0.02 0.01 0 0.7 * A - ring mB-ring A C -ring 0.8 0.9 1 1.1 1.2
Element U235 Mass Peaking Factor
Figure 2-7 Element Depletion Rate vs. Element Mass Peaking Factor (Data from Cores 187-190)
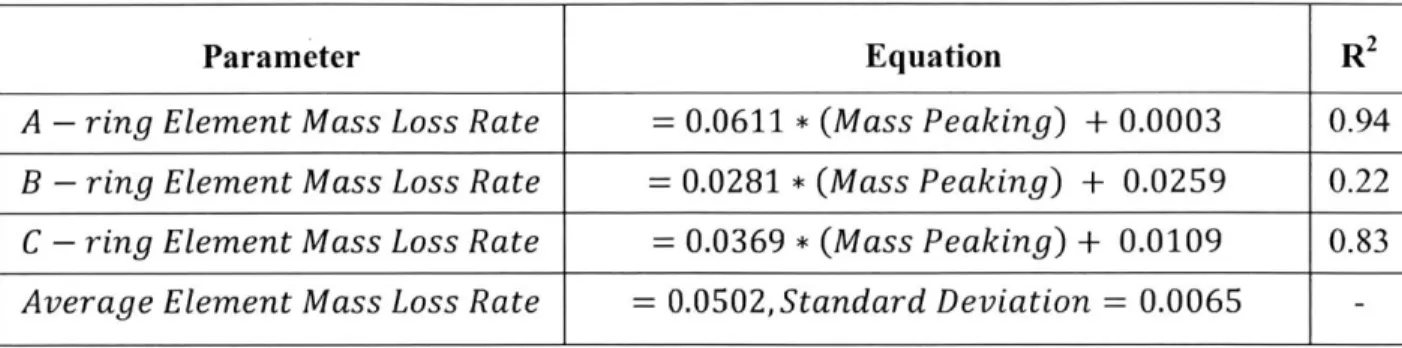
The parameters of the mass loss linear fits are shown in Table 2-2. It should be noted that while the linear fit for the B-ring mass loss rate has a very poor R2 value, this does not translate to a large spread in the mass loss values themselves. As Figure 2-7 demonstrated, the elements in the B-ring data all have a Um depletion rate that falls between 0.0506 and 0.0636 grams of U235 lost per MWd
of burnup. Among the individual B-ring elements in LEU cores 187-190, all of the elements with a mass peaking of 1.0 to 1.1 had a total mass loss in the range of 16.65 to 19.16 grams, with a standard deviation of 0.689, and all of the elements with a mass peaking of .I to 1.2 had a total mass loss in the range of 17.94 to 20.911 grams, with a standard deviation of 0.821. When evaluated in terms of their BOC element masses, all of the B-ring elements lost between 2.25% and 2.61% of their initial mass over the 329 MWd bumup.
Table 2-2 Linear Fits to Individual Element Mass Loss Rates vs. Element Mass Peaking; Loss Rates in g/MWd
Parameter Equation R
A - ring Element Mass Loss Rate = 0.0611* (Mass Peaking) + 0.0003 0.94
B - ring Element Mass Loss Rate = 0.0281 * (Mass Peaking) + 0.0259 0.22
C - ring Element Mass Loss Rate 0.0369 * (Mass Peaking) + 0.0109 0.83
Average Element Mass Loss Rate = 0.0502,Standard Deviation = 0.0065
-The equilibrium run mass data was also used to define allowable individual LEU element U235 mass ranges for each of the rings. Shown in Figure 2-8, these limits are used by the optimization tool to determine where an element may be placed and to identify elements that need to be removed. This process is discussed in greater detail in Section 2.3.3. Essentially, this approach establishes burnup limits for each ring, with the assumption that element mass is a reasonable indicator of burnup. The maximum allowed bumup for any element in the core is represented by the minimum allowable C-ring mass. Note that the bumup limits can be overridden in the optimization tool by specifying that an element must remain in the core. These constraints were developed based upon the shuffling done in the equilibrium core runs. Their usage helps to ensure that the target mass is properly distributed between the rings and that power peaking is constrained. Note that these ranges apply to LEU only; as discussed in Section 0, the HEU and LEU fuel elements have very significant property differences, including density, and the fresh LEU elements have much more U23 mass than the HEU elements. For example, HEU Core 190 had BOC B-ring masses of 445-490 grams U235, while the BOC B-ring
elements in LEU core 190 were in the range of 730 to 810 grams. A more refined treatment of element burnup could be implemented in the future.
- BOC A-ring
BOC B-ring anm BOC C-ring
O EOC A-ring EOC B-ring EOC C-ring
500 600 700 800 900
Allowable Element U235 Mass (g)
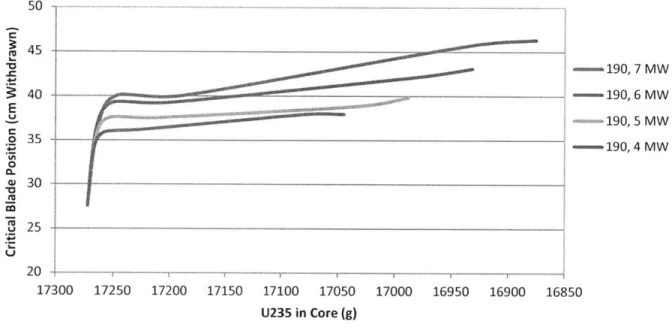
Because the relationship between burnup and U235 mass can be accurately correlated, it is then possible to evaluate how the control blade position changes with burnup by correlating this parameter to the U235 mass in the core. As mentioned above, the rate of blade withdrawal is dependent upon reactor power. This can be seen below in Figure 2-9, which shows the control blade position vs. U2 3 5
mass profile for LEU equilibrium core 190 burned at a series of powers.
5 0
~
. ...- .. . --.--- . . . 45 i-190,7 MW -40 - - - 190,5MW 35 .- 190,4 MW 1.0 CO 30 25 17250 17200 17150 17100 17050 U235 in Core (g) 17000 16950 16900 16850Figure 2-9 Critical Blade Position as a Function of U235
Mass in the Core, LEU Equilibrium Core 190
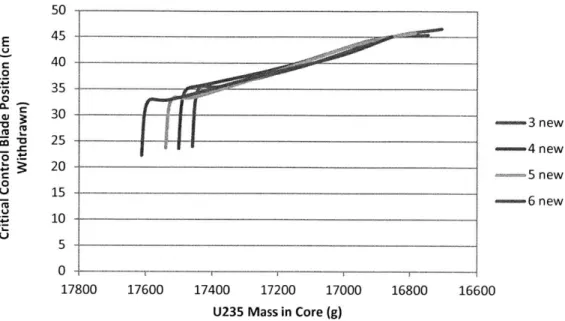
For a given operating power, the relationship between blade position and core U mass is relatively consistent once the fission products reach equilibrium, regardless of initial core mass. For example, Figure 2-10 below shows the critical control blade position profiles relative to core U235 mass for the same test core with 3,4,5, and 6 new LEU fuel elements introduced. Inserting additional U235
necessitates increased control blade insertion to suppress the added reactivity, but the relationship between critical position and mass is consistent once the fission products reach equilibrium - all four cases join essentially the same control blade position line.
20
E 0 LA 0 0. 50 -45 -40 -35 -- 3 new : 20 --- new 6 new 00 -6 new 5 0 17800 17600 17400 17200 17000 16800 16600
U235 Mass in Core (g)
Figure 2-10 Critical Control Blade Position for 3,4,5, and 6 New LEU Fuel Elements Added to the Same Core
Utilizing this fact, a linear fit was applied to the critical blade position vs. U mass data from the time steps at equilibrium fission product values (MCODE-FM Step 2 (3 days) to the end of cycle (EOC)), for each of the simulated powers. An example of the data points for the 7
MW
cores can be seen below in Figure 2-11. Similar data sets to Figure 2-11 were generated for the cores run at 4MW, 5MW, and 6MW ( Table 2-3). 55 E 0 0 CL cu C-, , 50 4-~----_ _ 45 4- - - -_ _ _ 404-
--- .-- * -_ 35 25 17400 17300 17200 17100 17000 16900U235 Mass in Core (g)
16800 16700 16600
Figure 2-11 Critical Blade Position vs. Mass, LEU Equilibrium Cores 187-190, 7 MW, steps 2 to EOC 16500
--Table 2-3 Linear Fits to the Blade Position vs. Core Mass Values for LEU Equilibrium Cores 187 to 190, for MCODE-FM time steps Step 2 to EOC
Parameter Equation R2
Blade Position,Step 2 to EOC,4MW = -(0.0127) * (Core Mass) + 253.74 0.86 Blade Position,Step 2 to EOC,5MW = -(0.0143) * (Core Mass) + 282.74 0.87
Blade Position,Step 2 to EOC,6MW = -(0.0164) * (Core Mass) + 320.35 0.90
Blade Position,Step 2 to EOC,7MW = -(0.0195) * (Core Mass) + 373.66 0.94
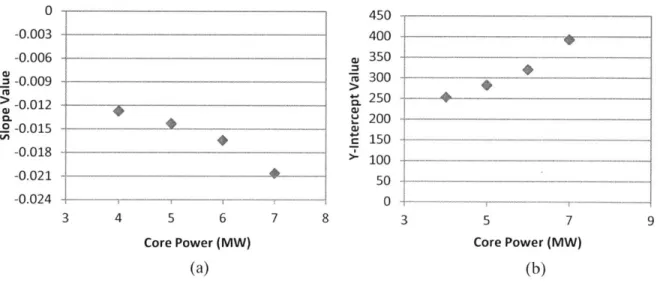
To expand the data set for application across all possible core powers, the properties (y-intercept and slope) of the individual power fits were then correlated. Both of these parameters vary linearly with power (Figure 2-12). The optimization tool can therefore create an equilibrium fission product critical position vs. core mass equation for any target power between 4 and 7 MW. The parameters of the critical blade position equation fit are documented in Table 2-4.
-rn 4 5 6 Core Power (MW) (a) CU a) 450 400 350 300 250 200 150 100 50 0 7 8 3 5 7 9 Core Power (MW) (b)
Figure 2-12 Data Fits for the Power-Dependent Critical Blade Position vs. Core U2
35 Mass Equations, Steps 2 to EOC, for
Equation Parameters (a) Slope and (b) Y-Intercept 0 -0.003 -0.006
E
-0.009 -0.012 o2-0.015 -0.018 -0.021 -0.024 3,
Table 2-4 Linear Fits against Core Power to the Slope and Y-intercept of the Blade Position vs. Mass Equations
Parameter Equation R2
Equation Slope = -(0.0026) * (Core Power) - 0.0018 0.95
Equation Y - Intercept = (45.599) * (Core Power) + 61.713 0.95
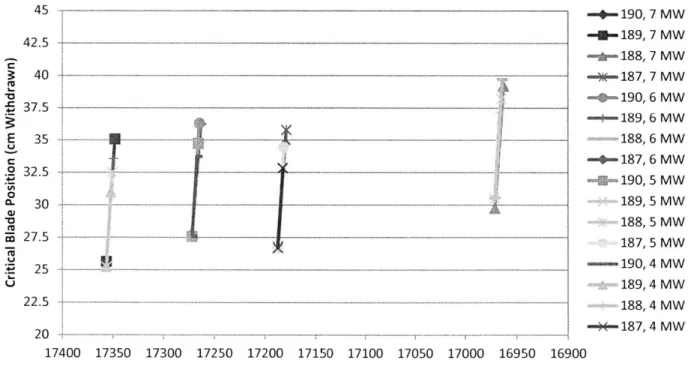
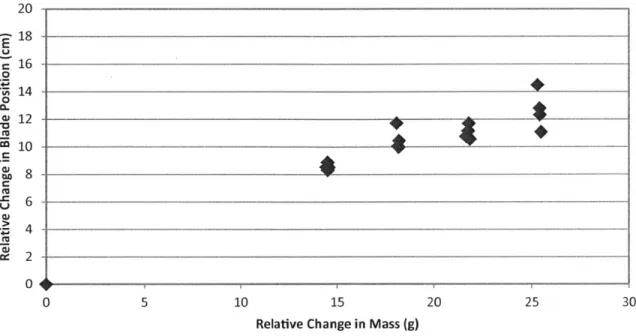
While a given core is building up to equilibrium fission product levels, the critical control blade position is consistent as a function of U2 3 5 mass regardless of core operating power, as captured in the Figure 2-13 plot of critical position vs. U 2 mass for steps 0 to 1 (0 to 1 days). Essentially, the impact of the operating power is captured in the value of the mass change for the time step - higher power cores will have a larger change in mass, and consequently a larger jump in control blade position. As Figure 2-13 also demonstrates, the rate of blade withdrawal is relatively the same for all cores regardless of the initial U235 mass (as captured by the similar slopes of the individual core position vs. mass lines). Therefore, it is possible to use a single data fit to the relative change in blade position vs. relative change in core mass for all cores at all powers. This was done to capture the blade motion over steps 0 to 2 (Figure 2-14,Table 2-5).
45 42.5 40 37 5 --- ---- - - - - - ---. -35 -32.5
I
30 - - - -- --- .- -27.5 ~-- -- - --25 -.... --- --- --- --- -.-....-- - - - -- -- - -- _ 22.5 - - - -20 .. .. . .. 17400 17350 17300 17250 17200 17150 17100 17050 17000 16950 16900Core U235 Mass (g)
-4-190, 7 MW -- 189, 7 MW -- A-188, 7 MW -- 87, 7 MW -0- 190, 6 MW -0--189, 6 MW - 188,6 MW -4--187, 6 MW -- 190, 5 MW 189,5 MW 188, 5 MW 187, 5 MW - 190, 4 MW 189,4 MW 188,4 MW --0- 187, 4 MW
Figure 2-13 Critical Control Blade Position vs. Core U235Mass, Steps 0 to I
c
E
0
~0
20 18 E 16 0 14 0 12 O 10 S 4J 0 5 10 15
Relative Change in Mass (g)
20 25 30
Figure 2-14 Relative Change in Control Blade Position vs. Relative Change in Mass for All Cores, All Powers (Both Parameters are Relative to BOC Values)
Table 2-5 Linear Fit to the Change in Critical Control Blade Position vs. Change in Core Mass Data for LEU Equilibrium Cores 187-190, MCODE-FM steps 0 to 2
Parameter Equation R2
Change in Control 0.5223 * (Change in Mass) + 0.1415
0.98
Blade Position
These correlations will all be affected if there is an experiment present in the core which adds some reactivity (positive or negative). To treat this case, a series of blade worth curves were generated. The BOC and EOC MCNP input files for the final four cores of the LEU equilibrium run were re-run with a sequence of control blade positions. The resultant worth curve data is below in Figure 2-15. With the blade worth data, the optimization tool can evaluate how a given reactivity insertion would impact the control blade motion, and can extrapolate from there the change in core mass that is needed to compensate using the blade position vs. mass relationships discussed above.
1.06 1.04 - --- 190 BOC 1.02 - - - - --- - ---- 190 EOC 1.02 WE______________________ 1 --- 189 BOC 0 __98_
----
189 EOC 9'0.98 0.96 -188 BOC 0.94 -- 188 EOC 0.92 --- 187 BOC 0.9 --- -187 EOC 0 10 20 30 40 50Control Blade Position (cm Withdrawn)
Figure 2-15 Blade Worth Curves for LEU Equilibrium Cores
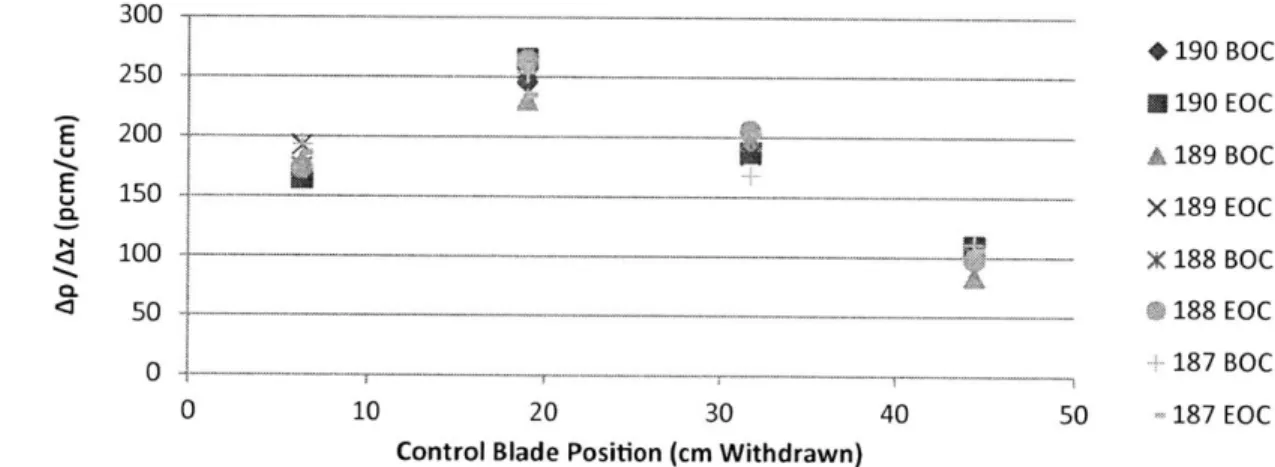
As Figure 2-15 demonstrates, the slopes of the worth curves are fairly consistent - a given change in blade position has roughly the same impact on every core, at both beginning and end of life. This is confirmed by the differential worth curve data, shown in Figure 2-16 for the BOC and EOC of cores
187-190. The optimization tool uses a third-order polynomial fit to this data (Table 2-6).
U E C.N 300 250 200 150 100 50 0 K----* 190 BOC U190 EOC A 189 BOC X 189 EOC X 188 BOC
@188
EOC 187 BOC 0 10 20 30 40 50Control Blade Position (cm Withdrawn)
Figure 2-16 Differential Blade Worth Curves for LEU Equilibrium Cores, LEU Cores 187-190, (Ap/Az values are plotted at the mid-point position value for the segment)
-187 EOC
BOC and EOC
Table 2-6 Polynomial Fit to the Differential Blade Worth Data, LEU Cores 187-190
Parameter Equation R 2
lAp\
Blade Worth - 0.0091 * - 0.9524 * z2 + 25.3827 * z + 53.1686 0.98
CAZ
(z = Control Blade Position, cmn Withdrawn)
---2.2.2 Power Distribution
There are three fission power peaking factor quantities of interest for thermal-hydraulic safety analysis:
e
Radial Peaking Factor
= Power in a PlateAverage Plate Power in the Core
e
Axial Peaking Factor
= Power in an Axial Segment of a PlateAverage Axial Section Power in that Plate
* Lateral Peaking Factor = Power in a Lateral Stripe of an Axial Segment of a Plate
Average Lateral Segment Power in that Axial Segment of that Plate
(2)
(3)
(4)
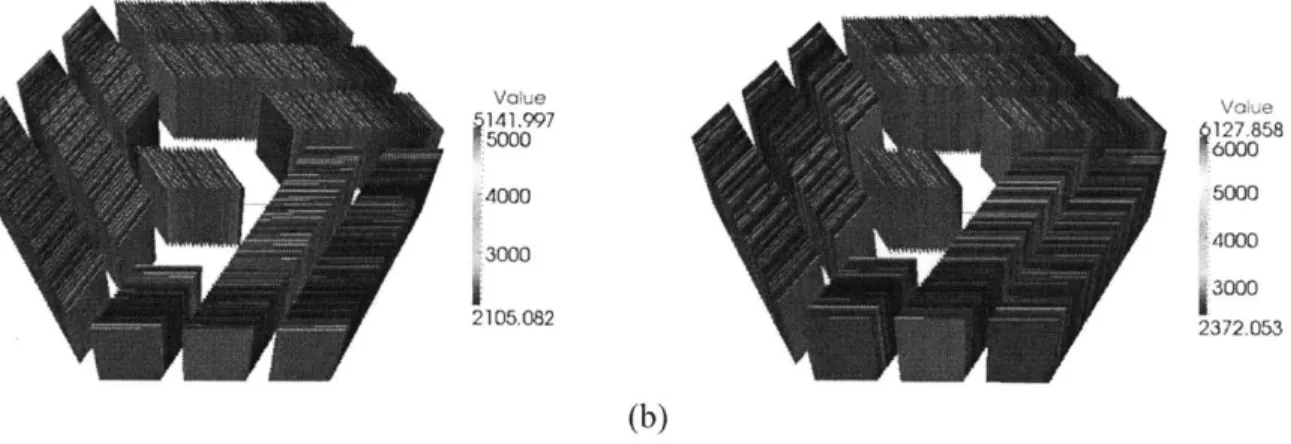
The shape of the core, as well as the peripheral positioning of the control blades, leads to a natural global power profile within the core, which evolves as burnup occurs and the blades withdraw. At BOC, when the control blades are closer to full insertion, there is a power shift to the center of the core, resulting in larger peaking in the A- and B-rings. As the blades withdraw, there is less suppression of fission in the C-ring elements, and power shifts outward, resulting in a flatter profile in the A- and B-rings, and increased peaking in the C-ring [6]. This is demonstrated in Figure 2-17, which shows the BOC and EOC power distributions in axial zone 3 (of 6) for a test core that was loaded with an identical element in all locations to isolate this effect. At BOC, the most significant peaking was in the innermost plates of the elements in A2, B6, and B9, while at EOC, peaking is more pronounced in the outermost plates of the C-ring elements. Because of this behavior, it is necessary to have separate peaking factor correlations for BOC and EOC.
Value 141.997 4000 3000 2105.082 S127,858 ,6000 5000 4000 -3000 2372,053 (b)
Figure 2-17 Power Distribution (W) at (a) BOC and (b) EOC at Axial Level 3 (of 6) for a Core Loaded with the Same Element in Every Location
2.2.2.1 Radial Power Peaking
Because radial peaking is defined relative to the total average plate power in the core, the maximum radial peaking value in an element can be related to the element's mass peaking factor. The elements with a larger mass peaking have a larger portion of the total core power, and a larger power in their hottest plate. For some locations in the core, power peaking is also strongly influenced by plate orientation. In addition, for all locations, the power peaking in an element is influenced by the mass of U235 in its neighboring elements. The impact of neighbors was not captured in this analysis. However, the optimization search tool methodology (discussed in Section 2.3) has logic in place that attempts to prevent extreme improper mass loading, such as the placement of fresh elements next to each other.
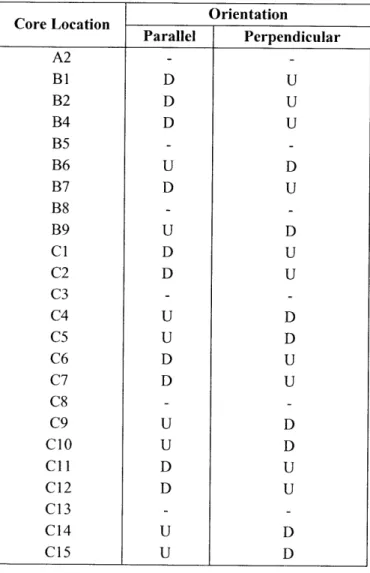
In this analysis, the majority of the data has been classified according to whether the plates in an element are parallel or perpendicular to the center of the core. An example case can be seen in Figure 2-18. These classifications are not relevant for locations B2, B5, and B8; However, because of the dummy element generally placed in B3, location B2 is still characterized by its orientation relative to this neighboring location. Orientation does not matter significantly for the A-ring element radial peaking, and because Elements C3, C8, and C13 have two edges exposed to the reflector region, orientation does not significantly impact their maximum peaking value either. The orientations shown in Figure 2-18 are for an element loaded upright in each location. A flipped element will have the opposite plate orientation. Table 2-7 documents the relationship between element orientation (up/down) and plate orientation (parallel/perpendicular) for each core location.
Table 2-7 Summary of Individual Core Location Element Orientation / Plate Orientation Relationships
Radial peaking analysis was done using the final four equilibrium run cores from the case with a 1 radial /1 lateral /6 axial depletion mesh. As demonstrated by Horelik, this coarser mesh is more conservative for radial peaking analysis [9]. To develop a more complete set of correlations for the B-ring locations, each of these cores was also re-run with all of the B-B-ring elements flipped. Based upon trends observed in preliminary analysis, the elements in each ring were separated into behavioral groups. For each group, a linear fit was then developed which correlates the maximum expected radial peaking factor in an element to the element's mass peaking factor (Table 2-8 and Table 2-9
)
The data for these correlations is shown in Figure 2-19, Figure 2-20, and Figure 2-21 for BOC elements, and Figure 2-22, Figure 2-23, and Figure 2-24 for EOC elements. Note that the data sets are grouped by plate orientation (perpendicular/parallel, or "par"' and "per"), rather than element orientation (up/down). In general, for a given element mass in a given core, the radial peaking will be larger if the element is in a parallel orientation.1.95 - - - -E LU 1.75
----*
,
0 1.55 *A2, all bo orientations a, 1.35 a-c 1.15 - - - -E E 0.95 0.9 0.95 1 1.05 1.1Element U235 Mass Peaking Factor
Figure 2-19 Data for Linear Fits to Element Maximum Radial Peaking Factors vs. Element Mass Peaking Factors for location A2, BOC 1.9 C 1.8 - --- --- --E 1.7 - *B1 par A BI per S 1.6
1
---Z
--- B2 par A B2 per .1. a B4 par A B5 - B6 par A A B6 per 1.3 - - -- --- .B7 par AB7 perc:
1.2 d - - - + B8 E B9 par .- 1. - - -- - -- - - -B 9 p e r 1 1.02 1.04 1.06 1.08 1.1 1.12 1.14 1.16 1.18Element U235 Mass Peaking Factor
Figure 2-20 Data for Linear Fits to Element Maximum Radial Peaking Factors vs. Element Mass Peaking Factors for B-ring Locations, BOC
1.9 A C1, C5, C6, C10, E C11, C15, 1.7parallel A C1, C5, C6, C10, - 1.5 __AAA
C11,
C15, 2 1perpendicular 1 C2, C4, C7, C9, * C12, C14, CL parallel (C2, C4, C7, C9, E C12, C14, E perpendicular 0.9 -EC3, C8, C13, all orientations 0.7 0.65 0.75 0.85 0.95 1.05 1.15 1.25Element U235 Mass Peaking Factor
Figure 2-21 Data for Linear Fits to Element Maximum Radial Peaking Factors vs. Element Mass Peaking Factors for C-ring Locations, BOC 1.95 1.75
1.55
--- -*
1.35 --1.15 -- - - - --- - - - -__ ___ __ 0 n*A2, all orientations
U . -r - - - r - - - -r - - -
-0.9 0.95 1 1.05 1.1
Element U235 Mass Peaking Factor
Figure 2-22 Data for Linear Fits to Element Maximum Radial Peaking Factors vs. Element Mass Peaking Factors for location A2, EOC C> E U.' CU 0 U M a-C E X