Development of a Porous Piezoresistive Material
and its Applications to
Underwater Pressure Sensors and Tactile Sensors
ByMun Ee Woo
B.S., Materials Science and Engineering University of Minnesota, Twin Cities, 2010
SUBMITTED TO THE DEPARTMENT OF MATERIALS SCIENCE AND ENGINEERING IN PARTIAL FULFILLMENT OF THE REQUIREMENTS FOR THE DEGREE OF
MASTER OF SCIENCE IN MATERIALS SCIENCE AND ENGINEERING
AT THE MASSACHUS
MASSACHUSETTS INSTITUTE OF TECHNOLOGY OF TEC
JUNE 2013
C 2013 Massachusetts Institute of Technology. All rights reserved.
JUN
Signature of Author
CHIME
ETTS INST E HNOLOGY5 2013
A RIES
Mun Ee WooDepartment of Materials Science and Engineering
Submitted on May 2 4 th, 2013; Presented on May 1 5 th ,2013
Certified by
Vladimir Bulovid Professor of Electrical Engineering Thesis Supervisor
Certified by
Accepted by_
Accepted by _
/Q)
U
Jeffrey H. LangProfessor of Electrical Engineering T essupervisor
1 cieTF. Rubner TDK Professor of Polymer Materials Science and Engineering
Thesis Reader
-- ~G--rbrand Ceder R.P. Simmons Professor of Materials Science and Engineering
Chair, Department Committee on Graduate Students r
Development of a Porous Piezoresistive Material and its Applications to
Underwater Pressure Sensors and Tactile Sensors By
Mun Ee Woo
Submitted to the Department of Materials Science and Engineering
on May 2 4 th 2013 in Partial Fulfillment of the
Requirements for the Degree of Master of Science in Materials Science and Engineering
ABSTRACT
MEMS (Microelectromechanical System) pressure sensor arrays are gaining attention in the field
of underwater navigation because they are seen as alternatives to current sonar and vision-based systems that fail to navigate unmanned undersea vehicles (UUVs) in dark, unsteady and cluttered environments. Other advantages of MEMS pressure sensor arrays include lower power consumption and that their passive nature makes them covert. The goal of this work focuses on the development of a flexible pressure sensor array for UUVs, where the sensor array is inspired
by the ability of fish to form three-dimensional maps of their surroundings. Fish are able to
decipher various pressure waves from their surroundings using the array of pressure sensors in their lateral line sensory organs that can detect minute pressure differences. Similarly, by measuring pressure variations using an engineered pressure-sensor array on the surface of an
UUV, this project hopes to aid UUVs in the identification and location of obstacles for
navigation. The active material of the pressure sensor array is a porous polydimethylsiloxane (PDMS)-carbon black composite made out of a sugar sacrificial scaffold that shows great promise for satisfying the proposed applications. The proposed device structure is flexible, easily fabricated, cost efficient and can be implemented on a large-area and curved UUV surface. Although hysteresis occurs during the electromechanical test, the piezoresistivity of this porous PDMS-carbon black composite is reversible and reproducible. Compared to its non-porous counterpart, this porous composite shows a six-times increase in piezoresistivity and a greatly reduced Young's Modulus. When tested underwater, this porous composite was able to differentiate water waves that had a frequency of 1 Hz and 2 Hz, which is promising for its underwater application. This porous composite was also extended to the application of tactile sensors using a different device architecture, which showed excellent response under mechanical testing.
Thesis Supervisor: Vladimir Bulovid Title: Professor of Electrical Engineering
Thesis Supervisor: Jeffrey H. Lang Title: Professor of Electrical Engineering
Acknowledgements
I would like to express my gratitude to my supervisors Prof. Jeffery Lang and Prof. Vladimir
Bulovid for their constant guidance throughout the project. I have gained immensely from working with them and they made me realize my strengths and weaknesses during the course of this project. Additionally, I would like to thank Prof. Michael Rubner for being my thesis reader. Prof. Rubner has given me so much advice and support in completing this work and I am very fortunate to have such a knowledgeable and supportive thesis reader. Besides that, I would like to thank Prof. Michael Triantafyllou and his student Jeff Dusek from MIT Centre for Ocean Engineering for the fruitful collaboration. Special thanks to Jeff Dusek for all his time and patience during every underwater field test that I could not have done without him. Furthermore,
I would like to thank Ajay Kottapalli, a graduate student from Singapore Nanyang Technology
University for his advice and support, and Frank Yaul from the Department of Electrical Engineering and Computer Science for introducing this project to me.
I would also like to thank my friends Lionel Moh, Jayce Cheng, Zhaohong Han and
Binghong Han from the Department of Materials Science and Engineering for all their help and support throughout these two years of my masters. Without their friendship, my graduate studies would not have been so enjoyable. Special thanks to Lionel and Jayce for the advice in characterizing my materials in this project. I have gained so much from all of you, especially during this last semester, and words cannot describe how grateful I am to have you to be my closest friends here in MIT.
I would also like to thank Patrick Boisvert from MIT Centre for Materials Science and
Engineering, William F. DiNatale from MIT Institute of Soldier Nanotechnology, Nicholas Antoniou and Adam Graham from Harvard Center of Nanoscale Systems for their help and advice during all SEM sessions.
Apart from that, I would like to thank my group members from ONELab and Triantafyllou Group for being such great people to work with. Although I have only interacted with them for about two years, I have learnt a lot from all of them and I am very grateful for everything they have taught me.
Finally, I would like to thank my funding sources, Sea Grant and Singapore-MIT Alliance for Research and Technology for all the funding that is provided throughout my project.
Table of Contents
Chapter 1 Introduction... 1
1.1 Problem Statements & Objectives ... 1
1.2 Design Considerations ... 2
1.3 Previous W ork on Active Materials for Sensors... 3
1.3.1 Polymer with Metal Composites ... 5
1.3.2 Conductive Polymer Composite ... 7
1.3.3 Polymer with Carbon Microcoils Composite... 8
1.3.4 Polymer with Graphite Nanosheets Composite ... 9
1.3.5 Polymer with Carbon Nanotubes Composite ... 10
1.3.6 Polymer with Carbon Black Nanoparticles Composite ... 11
1.3.6.1 Ethlyne-Octene Elastomer with Carbon Black ... 11
1.3.6.2 Polyisoprene with Carbon Black... 12
1.3.6.3 Silicone with Carbon Black... 14
1.3.7 Conclusions ... 16
1.4 Examples of Different Sensors ... 17
Chapter 2 MEM S Sensor I: Versions I & II ... 19
2.1 MEM S Sensor Version I... 19
2.3 Kayak Test ... 24
2.4 Problem s & Improvem ents ... 25
Chapter 3 M EM S Sensor 11: ... 26
M aterials Properties & Fabrications ... 26
3.1 M aterial Properties... 26
3.2 N ew Active M aterial... 27
3.3 Fabrication ... 29
3.4 Effects of Solvents on Swelling PDMS & Dissolving Sugar ... 31
Chapter 4 MEMS Sensor II: Characterization & Results of Solid PDMS-Carbon Black Com posite... 34
4.0 Solid PDM S-Carbon Black Com posite ... 34
4.1 Electrical M easurem ents ... 34
4.2 Electrom echanical Response ... 39
Chapter 5 MEMS Sensor II: Characterization & Results of Porous PDMS-Carbon Black Com posite ... 47
5.0 Porous PDM S-Carbon Black Composite... 47
5.1 Sugar Composition... 47
5.2 M echanical Test... 48
5.3 Electrom echanical Tests ... 50
5.5 Encapsulation M ethods... 58
5.5.1 Encapsulation using pure PDM S... 58
5.5.2 Encapsulation using Sticky W rap ... 60
5.5.3 Encapsulation using Electrical Insulating Spray... 62
5.5.4 Reproducibility of Porous PDMS-Carbon Black Composite ... 64
Chapter 6: Underw ater Test... 66
Chapter 7: Tactile Sensor... 76
Chapter 8 Sum m ary, Conclusion and Future W ork... 80
8.1 Sum m ary & Conclusions... 80
8.2 Future W ork... 81
References... 82
Chapter 9 Appendices ... 87
9.1 Appendix I: Poisson Ratio and Resistivity... 87
Chapter 1 Introduction
1.1 Problem Statements & Objectives
Current sonar and vision-based systems fail to navigate unmanned undersea vehicles (UUVs)
in turbid, unsteady and cluttered environments"2. A sonar system suffers from multipath
propagation issues3'4 and there have been reports suspecting the death of marine animals caused
by the use of sonar due to interference with whale and dolphin echolocation5. Vision based
systems, on the other hand, suffer from poor image quality due to light scattering and light
absorption issues in the turbid surf zone4. Both sonar and vision-based systems must emit energy
in the form of acoustic signals or light waves and this active sensing behavior makes them
non-covert and less energy-efficient. Therefore, the development of a new type of navigation sensor
is desired for UUVs.
Individual sensor node
Figure 1: The lateral line distribution of a Lake Michigan Mottled sculpin is shown6. The black
dots are individual neuromasts which act as individual sensor nodes on the surface of the fish.
MEMS (Microelectromechanical System) pressure sensor arrays are gaining attention in the
covert. These MEMS arrays have individual sensors that closely mimic the biological
neuromasts on the body of many fish2
,3,6-", as shown in Figure 1.
Fish are able to decipher various pressure signals from their surroundings using the array of
pressure sensors in their lateral line sensory organs that can detect minute pressure differences
(AP's) with respect to a reference pressure. For instance, when a fish is moving closer to an
object, the AP's increase and vice versa. Inspired by the ability of fish to form a
three-dimensional map of their surroundings, this project is taking a biomimetic approach to develop
an engineered pressure-sensor array to measure pressure variations on the surface of an UUV in
order to aid UUVs to accurately identify and locate obstacles during underwater navigation.
1.2 Design Considerations
A few key design considerations must be taken into account when designing an ideal
underwater pressure sensor that is functional as a navigation sensor on the curved surface of an
UUV.
(i) High chemical resistance and stability under sea water so the pressure sensors are
robust enough to withstand the harsh seawater environment when performing
underwater surveillance.
(ii) Flexibility and conformity in order for the pressure sensor array to wrap around the
doubly curved hull of an UUV.
(iii) Scalable and cheap fabrication so large-area pressure sensors can be used for
various sizes and dimensions of UUVs.
(iv) High sensitivity in order for the pressure sensor to detect pressure variation as low as
12 10OPa
(v) A dynamic range typically in the range of 103 Pa with a maximum of
104 Pa is
needed to fulfill the requirement of underwater pressure sensing.
To fulfill the above design considerations, a suitable matrix is polydimethylsiloxane (PDMS)
polymer. PDMS is known for its flexibility, ease of wide area fabrication, and high chemical
resistance which are keys to implementation on a large-area and curved UUV surface. In order to
achieve a conductive active material, conductive and cost-efficient carbon black particles are
used as filler particles in the PDMS matrix. This active material is utilized in a device which
consists of an array of sensing points that wraps around the hull of UUV. Pressure variation on
the hull can then be detected for accurate mapping of the surroundings. More detailed
information can be found in Chapters 2 and 3.
1.3 Previous Work on Active Materials for Sensors
Polymer composites are made by adding conductive fillers into insulating polymer matrices.
Most common conductive fillers13 are (i) metal nanoparticles 14-16; (ii) conductive polymer
nanoparticles' 7-19; (iii) carbon microcoils20,21; (iv) graphite nanosheets22-24; (v); carbon
nanotubes25; and (vi) carbon black nanoparticles23,26-34. These polymer composites have been
widely studied and used as active materials for mechanical sensing. Their figure of merit for the
application of sensors is piezoresistance, AR/Ro, which is defined by the change of resistance (R)
under tensile or compressive strain as a result of the destruction or formation of conductive
micro-channels of conductive particle network 3
Conduction of such composites has been widely understood by the percolation theory. This
composite on the weight percent of the conductive filler particles 14,35-3. For small weight percent of conductive filler particles, the resistivity of the composite is high. With increasing weight
percent, the conductive filler particles come into contact with each other and form a conduction
path, leading to a significant drop in the resistivity at a critical threshold. The weight percent
where the resistivity drops by many orders of magnitude is termed the "percolation threshold".
The percolation threshold is important as it strongly affects the piezoresistivity of the composite.
Just below the percolation threshold, the conducting filler particles are not in contact, resulting in
a high resistivity. Under an applied stress, the elastic polymer matrix deforms and the conductive
filler particles will be brought closer or further away, depending on the direction of applied stress.
The deformation of the matrix causes the composite to move past the percolation threshold and
causes orders of magnitude change in piezoresistance. To exemplify, when conductive particles
are brought closer, the resistivity will decrease by many orders of magnitude, and vice versa.
Thus, to achieve a higher sensitivity, the composite needs to undergo a greater deformation
under the same applied load and the material property that governs this is the Young's Modulus.
A composite with low Young's modulus is desirable as it will undergo a larger deformation
under the same load, resulting in a larger change in the conduction path between filler particles
and hence a greater change in resistance. Thus, understanding the Young's Modulus of the
polymer matrix with and without the addition of the conductive particles is important in the
design of pressure sensor.
Here, a brief overview of different polymer composites with their response under different
mechanical deformations will be given. At the end, some examples of different sensors will be
1.3.1 Polymer with Metal Composites
Ishigure et al. studied a variety of polymer-metal composites": (i) epoxy resin filled with
copper (Cu) or antimony (Sb)-doped tin dioxide (SnO2) particles; (ii) silicone rubber with
Lao.5Sro.5CoO3, Sb-doped SnO2 particles, Cu, or nickel (Ni) particles; (iii) polypropylene with Sb-doped SnO2 particles; and (iv) polyethylene with Sb-doped SnO2 particles. Among all, the
largest piezoresistive effect was demonstrated in silicone rubber mixed with 15 volume percent
(vol %) of fine (particle size = 100 nm) Sb-doped SnO2 particles: the resistance decreased close
to three orders of magnitude with less than 5 MPa of pressure under compression, as shown in
Figure 2. Additionally, a polymer matrix with lower Young's Modulus gave a greater
piezoresistive effect to the composite. However, the electrical measurement was taken using a
two-point probe where silver electrodes were adhered on the surface of the specimen. As a result,
contact resistance was included in the measurement and the reproducibility and accuracy of the
results were questionable.
Another example of reducing Young's Modulus to improve the piezoresistivity of a
polymer-metal composite was demonstrated by Zhang et al. where the compressive modulus of
epoxy was reduced with the addition of dibutylphthalate5. The polymers that were used were
polyethylene, polystyrene, and epoxy while the metal fillers included tin-lead (Pb) alloy powder,
Cu powder, and aluminum (Al) powder. Similar to the results obtained from Ishigure et al., the
resistance of the composite diminished with increasing compressive stress but the change in
resistance was significantly smaller. It was shown that the time dependence of piezoresistance
originated from the creep behavior of the polymer matrix. Under a constant stress, the
interparticle distance reduced as the polymer matrix crept, causing the composite resistance to
silver paste was used to adhere brass electrodes to the active materials. Again, contact resistance
was included in the measurement and the author did not address or discuss this issue in the
publication.
0
3 IPolypropylene (1800 MPa ) -15 vot*. SnO2 CL
0' Q
E poxy A (1200 MPa )-25 vol*/. S nO2
-2-Epoxy B(970MPa)-25vol*/. SnO2 Silicone rubber (1.3 MPa )- 15 vol *1. SnO2
_I I I I
0 5 10 15 20 25 Pressure (MPa)
Figure 2: Electromechanical response of different polymer matrix with fine Sb-doped SnO2
particles'4. The Young's Modulus of each polymer matrix is stated in the bracket.
Bloor et al. reported the observation of unusual properties in nickel (Ni) particle-silicone
matrix composite: the resistance was very high although the Ni composition was above the
percolation threshold16. The explanation for this phenomenon was that the adhering polymer
coated the Ni particles, separating the particles from each other. From Figure 3, one can observe
that the change in piezoresistivity was incredibly large as the resistance declined by about eight
orders of magnitude under compression of less than 25%. Furthermore, the results were
reproducible for about one million cycles of deformation. The exponential dependence of
carriers tunneling between the filler particles. Unlike Ishigure et al. and Zhang et al., this work
used a four-point measurement for all electrical characterizations, eliminating the issue of
contact resistance. 10 107 10 10 .8 10 0 10 102 101 5 10 15 20 25 30 Percentage compression
Figure 3: Resistance as a function of uniaxial compression for silicone-Ni composite"6. The
circles represent the experimental errors. The insert shows the schematic of the electromechanical measurement.
From the literature, it can be concluded that the general trend in the electromechanical
response of polymer-metal composite is that the resistance reduces as the metal particles are
brought closer together under compression, forming more conductive network in the composite.
Additionally, lower Young's Modulus composite was favorable for better piezoresistance.
1.3.2 Conductive Polymer Composite
Conductive polymer composites are not widely used for the application of sensors due to
their complicated synthesis processes. Examples of such composites include: (i) Polyaniline
(PAn)/styrene-butadiene (SBS) triblock copolymer1 7; (ii) insulating latex of a styrene-butil
acrylate copolymer with a colloidal suspension of intrinsic conducting polymer (polypyrolle)
copolymer(SEBS)/polyaniline doped with dodecylbenzenesulfonic acid (Pan.DBSA) blends19.
Among all, the best piezoresistance effect was demonstrated in 70/30 (wt %) blend of
SEBS/Pan.DBSA where the relative conductivity increased by 15-fold with up to 200 MPa of
compressive stress. According to Olmedo et. al, the conductive polymer composite formed
multiple interpenetrating networks that allowed conduction to occur3 8. The electrical
measurement was taken using a four-point measurement. Although this material can be
potentially used for future flexible tactile sensors, but the pressure range to achieve that
sensitivity is too high for the application of underwater pressure sensors.
1.3.3 Polymer with Carbon Microcoils Composite
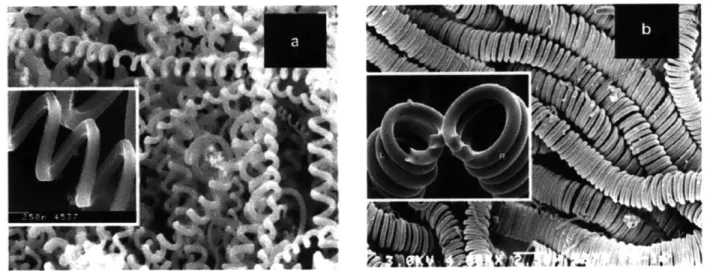
Yang et al. and Yoshimura et al. built an artificial skin-biomimetic tactile sensor using
spring shaped carbon microcoils (CMCs) 2 0,2 1.The structures of single-helix CMCs (SH-CMCs)
and double-helix CMCs (DH-CMCs) can be found in Figure 420. The change in resistivity of the polysilicone-CMCs composites relied on the change between the gaps of carbon coils when they
joined together to form a conductive network. Under compression, the resistivity of the
composites was reduced and polysilicone-SH-CMCs composites had higher sensitivity than
DH-CMCs. The changes in resistivity, AR, for SH-CMCs DH-CHCs were 70 kE and 10.5 kQ
respectively, under the applied load of 50 gram force. Under compression, the higher sensitivity
of SH-CMCs was attributed to the fact that the CMCs were brought closer together in the
direction parallel to the applied load while elongating simultaneously in the perpendicular
direction to form a conductive network. On the other hand, the DH-CMCs were closely packed
and the change of distance between the CMCs in the direction parallel and perpendicular to the
response of a compressive load. The electrical measurement was taken using two-point
measurement, where contact resistance was included in the resistance measurement.
~
I
Figure 4: SEM Images of carbon microcoils (CMCs): (a) spring-like single-helix CMCs and (b) DNA-like double-helix CMCs20
1.3.4 Polymer with Graphite Nanosheets Composite
Silicone rubber and graphite nanosheets (GNs) composite tactile sensor displayed a
phenomenal and reversible piezoresistivity24. This composite had a low percolation threshold of
0.9 vol% and it had a positive piezoresistivity under low uniaxial compressive pressure of 0.3-0.7 MPa, equivalent to the pressure applied by human finger. For 1.36 vol% of GN in silicone,
change in resistance, R/Ro, increased by 5 orders of magnitude starting from 0.56 MPa to 0.7
MPa. High density polyethylene (HDPE) with 7 vol% GN exhibited similar positive
piezoresistance effect, but the increase in resistance was approximately 3 orders of magnitude at
pressure of about 35MPa and its percolation threshold is 6 vol%2 2. Electrical measurements for
both works were carried out using two-point measurement.
Polymer-GN composite generally has a low percolation threshold. It also has high sensitivity
relatively lower composition, effectively avoiding deterioration of mechanical properties, a
problem that is prevalent at higher filling concentration. The increase in resistance under
compression was explained as a consequence of the destruction of conductive network between
GNs in the direction perpendicular to the uniaxial pressure. In the case of HDPE-GN composite, the resistance decreased at pressure below 7 MPa and increased above 7 MPa22. The author
explained that the formation and disruption of conductive network were two competing
mechanisms under compression. Under small compression, the distance between particles
decreased and the formation of conduction path dominated, therefore the reduction in resistance.
At higher pressure, the disruption of conduction network dominated and GNs reoriented, leading
to the increase of inter-particle distance. The main contribution of the remarkable piezoresistivity
and reversibility was explained to be a result of stronger adhesion of the GNs to the polymer
matrix compared to the cohesion between the nanosheets and regular changes in the conductive
network under cyclic
compression-1.3.5 Polymer with Carbon Nanotubes Composite
Knite et al. investigated polyisoprene and multi-walled carbon nanotube (MWCNT)
composite for the application of strain sensors25. At 40% stretch, 4 orders of magnitude change
in resistivity was observed in the composite with 8.305 weight percent (wt. %) and the effect was
irreversible due to the entangled structure of the nanotube. However, polyisoprene-MWCNT
(14.5 wt%) performed remarkably under compressive strain and the response was reversible, as
shown in Figure 513. The resistance decreased with compression and the change in resistance, AR/Ro was approximately -0.7% per kPa. The negative piezoresistance effect was due to the
electrical measurements were taken with a two-point probe technique and the author did not
address or discuss the effect of contact resistance in the total resistance measured.
0
0,1
0,2
--0,3 - Max compressive strain 5 % -0,4 -0,5-0,00 0,03 0,06 0,09 0,12 0,15 0,18 0,21 pressure, MPa (a) 0 0,0 0,5 1,0 1,5 2,0 2,5 3,0 3,5 4,0 4,5 5,0 V. % (b)
Figure 5: Electromechanical response of polyisoprene-multiwalled carbon nanotube (14.5 wt%)
composites under compression: (a) single cycle of compression; (b) cyclic loading'3.
1.3.6 Polymer with Carbon Black Nanoparticles Composite
Carbon black nanoparticles are common filler particles of insulating elastomer because they
are abundant and cost-effective.
1.3.6.1 Ethlyne-Octene Elastomer with Carbon Black
Flandin et al. investigated the electromechanical properties of ethylene-octene (EO)
elastomer mixed with 45 vol% of low structure carbon black (LSCB) and 20 vol% of high
structure carbon black (HSCB)26. The diameters and surface areas of LSCB and HSCB are 300
nm, 8 m2/g, 27 nm and 80 m2/g respectively. The elecromechanical response of these composites
four-point probe technique. EO-LSCB composite increased in resistivity with strain and
hysteresis was observed even at low strain. On the other hand, the resistivity of EO-HSCB
composite decreased approximately by 10 times with 20% stretch and reversibility in resistivity
was observed upon cyclic deformation. The authors explained that the reduction in resistivity of
EO-HSCB composite was due to rotation, translation and possibly the shape changes of the
smaller and asymmetric aggregates of the HSCB. The small particles of HSCB had higher
mobility compared to the larger LSCB. During elongation, the particles of HSCB moved and
were incorporated into new conductive networks and hence deformations led to a decrease in
resistivity of EO-HSCB composites.
1.3.6.2 Polyisoprene with Carbon Black
The electromechanical response of polyisoprene and 10 wt % of highly structured carbon
black nanoparticles composites (HSCB, surface area = 950 m2/g) were extensively studied under tension and compression 23,25,28,29,31. The resistance increased by 104 times up to 40% tensile
strain as well as under uniaxial compression of 0.16 MPa, and the response was reversible. From
Figure 6, when the composite was constrained in the direction perpendicular to the compression, the resistance also increased by 3 orders of magnitude up to 0.30 MPa. In other words, the
highest piezoresistance effect (AR/Ro) exhibited from polyisoprene-HSCB composite was
approximately 6000% per kPa under compression2 3
Resistance increased with stretching due to the destruction of conduction path between
carbon black particles28. In the case of uniaxial compression, transverse slippage of the polymer
matrix in the direction perpendicular to the applied strain or pressure led to the occurrence of two
small pressures; and (ii) the destruction of electrically conductive channels under large pressures.
This effect was still prevalent even when the composite was constrained in the direction
perpendicular to the applied pressure. HSCB has an exceptional high structure, which provides
extremely entangled conductive grid structure and prevents new conductive pathways from
developing in the direction parallel to the applied strain or pressure.
10- 9,5 . . . .
10cycle
10 incr 999 -- cycle 10 decr ~-incr
--cycle 1 incr 8,5- - -deer
8 e cycle 1 decr 8- C; 890-- 7,5- o>7-7,0 6 6,5 5 - , - . -0 1-0 0 14 018 0,12 0,16 000 0,05 0,10 0,15 0,20 0,25 0,30 p,MPa pMPa (a) (b)
Figure 6: Resistance as a function of uniaxial compression for polyisoprene and 10 wt% of highly structured nano-size conductive carbon black composite: (a) Deformation is not
constrained in the direction perpendicular to the acting force; (b) Deformation is constrained in the direction perpendicular to the acting force23
Desirable reversibility and huge changes of electric resistance under both tensile and
compressive strain were attributed to relatively higher mobility of HSCB compared to
LSCB 3,25,28,29. As a result, smaller tensile or compressive strain was required to destroy the
electro-conductive network of HSCB in the elastomer matrix. Besides that, fine branching
structure and larger surface area of HSCB compared to LSCB allowed HSCB to adhere better to
the polymer chains, and such adhesion was stronger than the cohesion between carbon particles.
taken using a two-point terminal technique, the results obtained were consistent and reproducible.
Knite et al. also successfully demonstrated that the addition of plasticizer increased strain
sensitivity as the plasticizer decreased cohesion force between carbon particles and increased
their mobilities30.
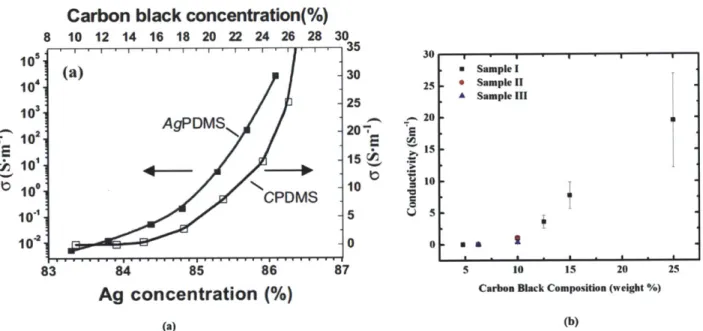
1.3.6.3 Silicone with Carbon Black
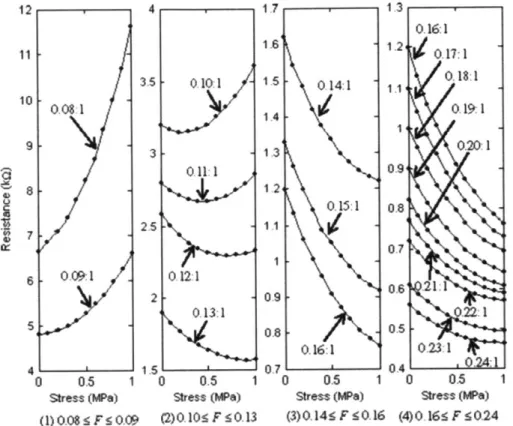
The electromechanical response of silicone-carbon black composites was investigated and it
was concluded that the piezoresistance of silicone-carbon black composites was strongly
dependent on the composition of carbon black3 2,3 3. The carbon black particles had a specific
surface area of 780 m2/g and they were considered as high structure carbon black. The
percolation threshold of carbon black in silicone was about 9 wt%. According to Figure 7, the
resistance increased with uniaxial compression for carbon black composition below the
percolation threshold. Between 10 wt% and 13 wt%, the resistance decreased initially and
increased after surpassing a critical pressure. Above 14 wt%, the resistance diminished with
increasing pressure. The electrical data were taken using a two-point probe measurement, where
contact resistance was included in the total resistance measured. As a result, the reproducibility
and accuracy of the results reported are questionable.
Above percolation threshold, most common conducting mechanisms were conductivity
through direct contact between conducting filler particles and tunneling or hoping through the
polymer matrix that separated adjacent filler particles32,33. The resistance reduced due to the
decrease of inter-particle distance between carbon black particles. For existing conduction
network, the gaps between adjacent carbon black particles minimized, thereby increasing the
composition above the percolation threshold. Below the percolation threshold, the resistance
increased with compression due to the reduction of effective conduction paths as a consequent of
the transverse slippage of carbon black aggregates.
12 4 17 1.3 0.16:1 111.6 1.2 11 IS0.17:1 3.5 0 10:1 1.5 0 14:1 1.1 0.18:1 10 0.081 14 0.19:1 9 3 1 3 0.2- &1 0.11:1 0.9-8 12 0.15:1 0.8 2.5 11 7 0.7 1 6 0.09 1 0.12:1 2 0.90.6 .21.1 2 09r 0.13:1 .22:1 0.8 0.16:1 . 0.5 0.23:1 4 1.5 0.7 0.4. 0.24:1 0 0.5 1 0 0.5 1 0 0.5 1 0 0.5 1
Stress (MPa) Stress (hPa) Stress (MPa) Stress (hWe)
(1)0.08sFs0.09 (2)0. 10F s0.13 (3)0,145F 50.16 (4)0 16! F50.24
Figure 7: Electromechanical response of silicone-carbon black composite under uniaxial compression3 3. F represents mass fraction of carbon black.
Lacasse et al. expressed their perspectives as to whether the resistance of silicone-carbon
black composite should increase or decrease under uniaxial compression3. In their work, they
observed both phenomena. However, they concluded that the composite should increase with
compression and that the reduction in resistance that was observed by many was due to the
existence of contact resistance. The explanation proposed for the reduction of resistance was
through the incompressive matrix model: under compression, silicone was deformed but it was
broken. This work also suggested that sensitivity of the composite increased when composition
of carbon black decreased.
1.3.7 Conclusions
From the above literature review, several ideas can be derived to aid the design of a sensitive
piezoresistive polymer composite as the active material of an underwater pressure sensor.
Highest sensitivity is expected around the percolation threshold. Thus, a composition around the
percolation threshold should be chosen when designing a polymer composite. Apart from that, a
low Young's modulus polymer matrix is desirable because smaller compressive pressure is
required to deform the composite and cause a large change in the resistance. High structure
carbon black or multiwalled carbon nanotube is excellent candidate for filler particles as their
electromechanical responses are reproducible. Therefore, a polymer composite filled with high
structure carbon black or multiwalled carbon nanotube can be considered to be the active
material of an underwater pressure sensor.
Contact resistance should be avoided during all characterizations because of the convolution
of the change in resistance contributed from contact resistance and the resistance of the
composite. Contact resistance and the resistance of the composite are arranged in series, and
contact resistance might dominate if the magnitude is larger than the composite's. To avoid
contact resistance, a four-point probe technique should be used when taking electrical
measurements. Many publications discussed in this chapter used two-point measurement when
taking the electrical output of the polymer composite under deformation. With this two-point
probe technique, contact resistance was included and the resistance obtained was not an accurate
that, contact resistance is not reproducible. Hence, the results that were obtained using a
two-point probe technique are questionable.
1.4 Examples of Different Sensors
The state of the art is the flexible capacitive pressure sensor fabricated with microstructured
rubber dielectric layers from Bao's group40. The active material was made out of a
microstructured thin film of PDMS. According to the authors, PDMS in the range of millimeter
to several hundred micrometers was nearly fully elastic in the <1OOkPa regime. Thinner PDMS
in the range of few micrometers in thickness will suffer from significant viscoelastic creep,
resulting in higher relaxation time after compression due to irreversible arrangement of polymer
chains and the lack of deformable surfaces. In other words, thin PDMS is not able to displace
material under an applied load. To minimize viscoelasticity, PDMS thin films can be
microstructured to provide more voids for the microstructure surfaces to elastically deform in
response to external pressure, thereby storing and releasing the energy reversibly. This sensor
was able to detect pressure as low as 3Pa and the highest demonstrated sensitivity was 5.50 %
change in capacitance (AC/Co) per kPa. The pressure range for all the elecromechanical test was
less than 7kPa and this sensor had a fast response and relaxation time of less than 1s.
Another work of Suh's group in creating a flexible and highly sensitive strain-gauge sensor
using reversible interlocking of nanofibres is also interesting41. This sensor is based on two
interlocked arrays of high-aspect-ratio Platinum-coated polyurethane based nanofibres that are
supported on thin PDMS layers (thickness = 500 pm). This sensor has demonstrated its ability in
superhydrophobic surface. However, this sensor is more suitable for the application of tactile
sensors rather than underwater pressure sensors because it might not have the required dynamic
range to operate under water.
An example of underwater polymer MEMS pressure sensor arrays was exhibited in the work
of Kottapalli et all. Each sensor utilized liquid crystal polymer as the membrane material for high
robustness and reliability. The sensing elements were gold strain gauges deposited on the surface
of the membrane in a serpentine pattern. When an object moved around the sensor under water, the membrane deflected in response to the flow variation and caused the resistance of the strain
gauge to change, which was reflected as voltage change by an external Wheatstone bridge circuit.
The sensor was capable of detecting steady-state flow and underwater object with the highest
sensitivity of 90mV/(m/s) and a high resolution of 25mm/s. This sensor was an ideal pressure
sensor for its high sensitivity and reproducibility without the problems of viscoelasticity in the
problems of polymer composites. However, the fabrication was complicated and was not suitable
for large area application.
The goal of this thesis work is to develop an active material for the application of
underwater pressure sensor using a fabrication process that is simple and suitable for large area.
Therefore, cost-effective materials, time-efficient fabrications, and materials with excellent
piezoresistivity (or sensitivity) and reversibility are keys to making a low-cost and functional
Chapter 2 MEMS Sensor I: Versions I & II
2.1 MEMS Sensor Version I
The first generation of MEMS underwater pressure sensor array was developed by Yaul et
al2,10,1. Each sensor array consisted of four pressure sensors and the active material of each
sensor cell in the array was a strain-concentrating diaphragm molded from PDMS (Sylgard 184),
on which a piezoresistive PDMS-carbon black (Cabot XC 72) strain gauge was patterned. A pressure difference across the diaphragm caused it to deflect, and this deflection was transduced
by the strain gauge. PDMS was chosen because of its chemical resistance and waterproofing
characteristics are desirable for long term underwater usage. Additionally, its flexibility allows
the sensor array to be compatible With the doubly-curved streamlined bodies of underwater
vehicles, making it amenable to wide-area fabrication and deployment. PDMS-carbon black
composite was chosen because it is cost-effective, compatible with the main body of the sensor
array, highly piezoresistive, and provides for repeatable operation2,1
Figures 8 and 9 shows the design and fabrication flow2,11. Initially, PDMS was poured into
two different molds and cured for 15 minutes at 120 'C. One mold was used to make the top and
bottom layers while another mold was used to make the middle layer. The middle substrate
comprised four square strain-concentrating PDMS diaphragms, as seen in Figure 8, connected to
a common plenum; hence each sensor array had four pressure sensors. The center edge of the
diaphragm experienced the maximum strain during diaphragm deflection, and was thus chosen
for the strain gauge location. After removing the cured PDMS substrates from the molds, the
piezoresistive PDMS-carbon black composite (14.3 wt% of carbon black)2,11 was
gauge and the whole assembly was cured for 20 additional minutes at 120 *C. Subsequently, a
tapered tip (with the end connected to a Tygon tube) was inserted into the common plenum
before the top and bottom substrates were bonded together for waterproofing. Finally, a syringe
was connected to the other end of the Tygon tube to control the pressure in the diaphragm during
operation and calibration.
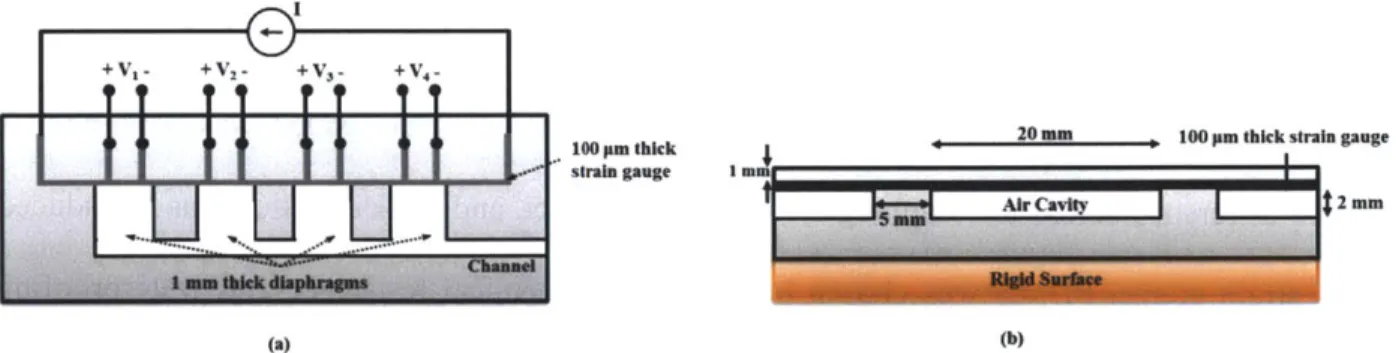
100 pm thick 20 mmn 100 pas thick strain gauge
-- strain gauge Iu
5
H.
AIsUr Cavity $2 mm(a) (b)
Figure 8: (a) Top view and (b) side view of the first generation of MEMS underwater pressure
2,11
sensor using PDMS-carbon black composite2
Top layer PDMS substrate
PDMS substrate
four cavities
Bottom layer PDMS substrate Screen print carbon black + PDMS
Insert wirestu
Figure 9: Fabrication flow of the first generation of MEMS underwater pressure sensor2,11.
All sensors were connected to a common plenum used to equilibrate the array against large
pressure fluctuations due to hydrostatic variations2,10,11. Equilibration was actuated through the
the plenum and this pressure biased the strain gauges into their most sensitive operating range.
When there is a pressure difference between the internal cavity and the external environment, the
diaphragm deflects and causes the strain-gauge to increase in resistance due to the breaking of
conductive carbon chains in the PDMS-carbon black composite. All four strain gauges in an
array were connected in series and driven with a common current. The output from each strain
gauge was the voltage measured across it. A four-point probe structure, as seen in Figure 8 (a),
was used to measure these voltages without the influence of contact resistance. Upon calibration,
the measured voltage was readily converted to the deflecting pressure difference.
This MEMS pressure sensor array was tested in air and underwater". Certain volume of air
was pumped into the array using the syringe that was connected to the Tygon tube. After
completing the test in air, the array was attached on a curved hull with a 0.5m curvature. The
highest sensitivities demonstrated in air and underwater were 1.9% and 1.1% change in
resistance AR/Ro per kPa respectively. The highest pressure resolution achieved was 1.1 Pa in air.
To further demonstrate the capability of this pressure sensor array, the pressure sensor was
tested in a tow tank, as shown in Figure 10 (a) and (b). However, the test was not successful
during this attempt because the whole assembly was not robust enough. To exemplify, the thin
copper wires were too fragile and most of them broke during hydrostatic test, see Figure 10 (c).
Additionally, the tapered tip that was inserted to the common plenum broke frequently when the
sensor was moved from one depth to another. Although the air cavities contributed to the high
sensitivity of the sensor array, the fabrication was time-consuming as isolating one sensor cell
from another can be difficult. Furthermore, encapsulation can be problematic as air bubbles were
the layers air-tight. Therefore, the design and fabrication of this sensor were evaluated and
improved to make MEMS sensor Version II.
(a) (b)
(c) Figure 10: (a) and (b): Setup of tow tank test
Copper wires during hydrostatic test.
for MEMS sensor version I. (c) The breakage of
2.2
MEMS Sensor Version II
MEMS sensor Version II was part of this thesis, and utilized a new design and fabrication,
However, thicker wires increased the difficulty of encapsulating all three layers together. To
simplify the fabrication while increasing the robustness of the sensor array, a new mold was
being designed. This mold incorporated the middle and bottom layers oV version I together so
the fabrication can be reduced from bonding three layers to two layers. Additionally, this mold
created equally spaced grooves on the bottom layer so thicker wires can be accurately and easily
inserted to make strain gauge connections. Additionally, the grooves kept the wires in place
while bonding the top and bottom layers together. The tapered tip was eliminated in this process
and a thinner Tygon tube (~~mm in diameter) was used instead. The fabrication process was
similar to Version I but it was simplified and more straightforward with an approximate
fabrication time of 3 hours0. On top of that, the material cost per sensor array was less than $ 3.
PDMS substrate With four cavities
Bottom layer PDMS substrate Screen print carbon black + PDMS
Insert wires + tube
Figure 11: The fabrication flow of MEMS sensor Version II and the actual device is shown on
2.3 Kayak Test
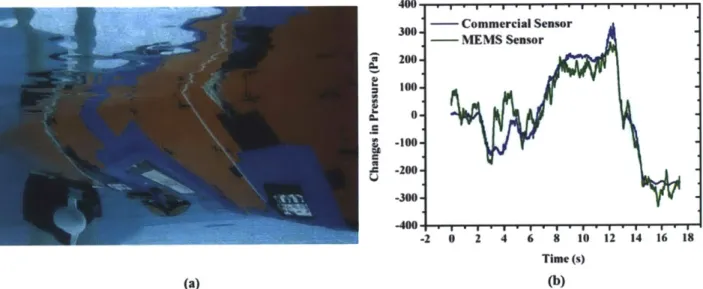
To demonstrate the capabilities of the polymer-based pressure sensor array, two arrays were
mounted on the hull of a kayak, and their pressure signals were recorded during kayak
maneuvers in the Singapore's Pandan Reservoir 10, see Figure 12 (a). For reference, the kayak
hull was also instrumented with commercial pressure sensors at nearby locations. Figure 12 (b)
shows two pressure signals recorded during one kayak maneuver. The pressure measured by a
commercial sensor is shown in blue, and that measured by a polymer-based sensor is shown in
green. 400 . , . . . . .,.,. .. - Commercial Sensor -MEMS Sensor 200 S100 0 -100 -200 -300 .00 .,...,.,.,., -2 0 2 4 6 8 10 12 14 16 18 Time (s) (a) (b)
Figure 12: (a) MEMS sensor mounted on the hull of a kayak for reservoir test. (b) Pressure
recorded by the commercial sensor and the MEMS sensor'0.
During the kayak experiments, the polymer-based sensor demonstrated a sensitivity of 1.21
pV/Pa with a 12 V supply voltage and the array power dissipation was approximately 2 pW per
sensor. Note that to create Figure 12 (b), the pressure signal from the polymer-sensor has been
shifted in time so as to best match the pressure signal from the commercial sensor as they were
polymer-sensor has been filtered using the fastsmooth function in Matlab. The smooth width
chosen is 80, the smooth type is rectangular, where the smooth edge is 1. The figure shows that
the pressure response of the polymer-based sensor was similar to that of the commercial sensor,
demonstrating the promising functionality of the polymer-based sensor in uncontrolled
environment. The measured pressure represented the difference between the pre-biased pressure
in the array and the pressure applied on each sensor when the array was underwater.
2.4 Problems & Improvements
Although MEMS Version II had a more simplified fabrication that produced a low-cost
pressure sensor array, the robustness of the sensor was still less than satisfactory. During the
kayak test, a total of eight sensors (four sensors on an array) were attached on the hull of the
kayak but only one sensor was functional underwater due to the breakage of Copper wires with
the sensor outputs when the kayak was being transported from the lab to the reservoir. Besides
that, the tube and cavities should be eliminated to further simplify the fabrication. The sensitivity
of the sensor ~1.21 mV/kPa still required improvement to make it comparable to commercially
available piezoelectric pressure sensors, such as the Model 106 B by PCB Piezotronics which
Chapter 3 MEMS Sensor II:
Materials Properties & Fabrications
3.1 Material Properties
To build an improved underwater pressure sensor compared to the first generation of MEMS
sensor, the active material needs to have the following material properties.
(i) Higher piezoresistivity: this new active material needs to demonstrate a
piezoresistivity that is higher than 1.1% AR/Ro per kPa in air and 1.9% AR/Ro per
kPa under water. Additionally, it needs to exhibit a resolution of 10 Pa.
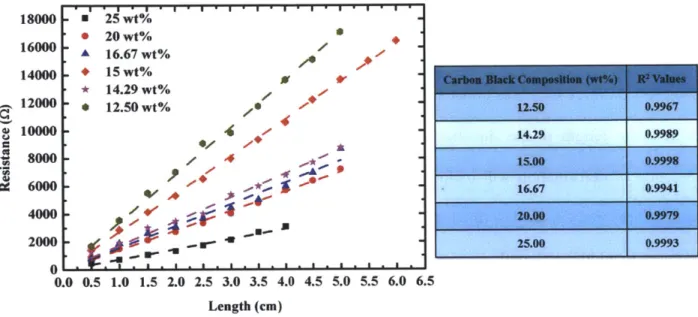
(ii) Homogenous resistance: for the sensor array to behave like the lateral line on the
body of many fish, the resistance across the array needs to be homogenous. In other
words, the relationship between resistance and length should be linear.
(iii) Reversibility: the electromechanical response of the active material needs to be
reversible under cyclic loads so the measured voltage that corresponds to a pressure
difference is consistent after multiple loads. Otherwise, the calibration will be
complicated and the device might result in wrong object detection during underwater
navigation.
(iv) Cost-effective, simple, large-area fabrication: the fabrication of the active material needs to be simple and reproducible. The presence of cavities in the
previous generation of MEMS sensor2,n complicates the fabrication, but it does
increase the sensitivity of the sensor array because of the large deflection on the
improve the sensitivity of the new sensor either with a new material or with some
optimizations so the cavities can be removed from the new sensor.
3.2 New Active Material
For this second generation of MEMS sensor, PDMS-carbon black composite will still be
used as the active material. Carbon black is an inexpensive filler and it has been supported from
the literature that high structure carbon black has high piezoresistivity and reproducibility3.
PDMS is a suitable candidate for the insulting matrix because if it is considered as one of the
most flexible polymer with one of the lowest glass transition temperature of -125 C43.
Additionally, it has low curing temperature, allowing it to be very suitable for large area
fabrication. Furthermore, it has no significant change in shear elastic modulus and Young's
modulus with respect to frequency, which makes its material property to be very stable under
multiple deformations.
From Chapter 1, this active material needs to have a lower Young's modulus and a lower
carbon concentration34 in order to have a higher sensitivity. To reduce the Young's modulus, the
relative amount of crosslink agent to base material can be reduced. However, this method is not
preferable because this will cause the PDMS to have less crosslinks, which lead to reduced creep
resistance of PDMS. Creep causes the polymer to plastically deform when placed under a
constant load for a long time or as the temperature rises. With less crosslink agent, the polymer
chains will have less entanglement and they will slide past each other easier when it is under an
applied load. The temperature effect just speeds up the plastic deformation as this mechanism
phenomenon is the irreversibility in the electromechanical response of the polymer. Thus, this
active material needs to be made softer without having to compromise its reversibility.
Another major parameter space that can be explored is the concentration of carbon black in
the composite. The concentration of carbon black will have a direct impact on the
piezoresistivity, sensitivity and the Young's modulus of the PDMS-carbon black composite.
Consequently, the carbon black concentration needs to be optimized and a new fabrication
method needs to be proposed in order to develop a PDMS-carbon black composite that has a
higher sensitivity with lower Young's modulus.
Other than the electromechanical response of the composite, lowering the Young's modulus
of the active material can increase its sensitivity. There have been several publications on using
sugar as the sacrificial scaffolds to create a porous PDMS structure44 7. Among these
publications, King et al. had demonstrated a porous PDMS-carbon black force sensitive
sensor4748. When a PDMS solution was prepared in a petri dish, a sugar cube was dipped in the
PDMS solution until it became saturated with PDMS. The PDMSE-coated sugar cube was then
cured and soaked in water to dissolve the sugar. Using scanning electron microscopy (SEM)
imaging, the resulting PDMS matrix was porous and it had a continuous percolation porous
matrix, resulting in PDMS that was as soft as a sponge. Carbon black particles were suspended in
water and it was added dropwise to the water saturated PDMS structure. Once the PDMS sponge
became saturated with carbon black, the whole structure was dried. Other methods of mixing
PDMS into sugar have also been demonstrated. Yuen et al. mixed PDMS directly into sugar45, Choi et al. and Cha et al. used sugar leaching technique by allowing pre-cured PDMS to infiltrate
infiltrate through sugar without using any pumps46 . Besides using water to dissolve the sugar, Bellan et al. and Yuen et al. used water and ethanol to dissolve the sugar structure45,46.
Using the aforementioned ideas, the active material for this new MEMS sensor will be made
out of porous PDMS-carbon black composite with the aim of achieving higher sensitivity
through a lower Young's modulus and a better piezoresistivitity.
3.3 Fabrication
Before fabricating a MEMS sensor array, the electromechanical response of the active
material had to be fully investigated. First, a study on the Young's modulus, piezoresistivity and
reversibility of the solid PDMS-carbon black composite was conducted to find the optimal
carbon black composition that should be added into the PDMS matrix. Using the resulting
optimal composition, the effect of sugar composition in the Young's modulus, piezoresistivity
and reversibility of the porous PDMS-carbon black composite was further characterized. After
that, the porous PDMS-carbon black composite was fabricated into an underwater pressure
sensor and a tactile sensor. Here, the fabrication steps of solid and porous PDMS-carbon black
composite are shown in Figures 13 and 14 respectively.
The PDMS was Sylgard 184 from Dow Coming and the filler particles were acetylene
carbon black (99.99%) catalog number 06-0026 from Strem Chemicals. From the materials data
sheet, the average particle size of carbon black was approximately 42 nm, and the surface area
was 80 m2/g, which is a high structure carbon black. Firstly, a PDMS base was prepared and it
was degassed in a desiccator. Next, the carbon black particles were added into the PDMS base
and the whole mixture was inserted into a mechanical mixer (Mazerustar KK 250 Planetary
base:crosslink agent ratio of 10:1 in mass and the whole mixture was again mixed uniformly
using a mechanical mixer. The PDMS-carbon black composite was then casted into a mold and
was cured at 90 'C for at least 30 minutes.
Mix using
mechanical tester
Cast Into shape
cure at 1200C for more than 30 mins PDMS
Figure 13: Fabrication process of solid PDMS-carbon black composite.
Mix manually
Cast into shape
cure at 1200C for more than 30 mins
Dissolve In water (800C) for 24 hours
Figure 14: Fabrication process of porous PDMS-carbon black composite.
When the PDMS-carbon black composite was prepared, fine sugar (Domino sugar) was
added into the mixture and was mixed uniformly through stirring. The mixture was then casted
into shape and cured at 90 'C for more than 30 minutes. The sugar scaffold was dissolved in a
water bath at an elevated temperature of 80 'C. Throughout the dissolving process, water was
changed frequently to maintain a high concentration between the sugar mixture and water. To
check if all the sugar has been removed, acetone was used to infiltrate the porous composite.
Since acetone precipitates sugar49, the solution will appear to be cloudy if the PDMS-carbon
black composite contains sugar, otherwise, the solution will appear to be clear.
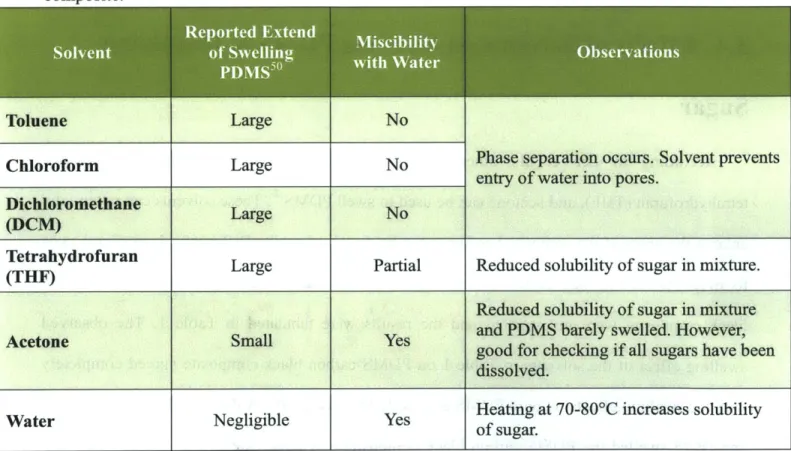
3.4 Effects of Solvents on Swelling PDMS & Dissolving
Sugar
According to Lee et al., other solvents like chloroform, dichloromethane (DCM),
tetrahydrofuran (THF), and acetone can be used to swell PDMS50. These solvents can potentially enlarge the pores of the composite so sugar can be dissolved easily. Different solvents were used
to swell PDMS and their effects on swelling PDMS and dissolving sugar from PDMS-carbon
black composite were investigated and the results were tabulated in Table 1. The observed
swelling effect of the solvents in Table 1 on PDMS-carbon black composite agreed completely
with the swelling effects on pure PDMS as reported by Lee et al5 . Although toluene, chloroform
and DCM swelled the PDMS-carbon black composite to a large extent, they did not mix with
water or dissolve sugar. In fact, they prevented water from entering the pores to dissolve the
sugar. Although the solution was stirred using a magnetic bar on a stirrer, sugar was not
swelling. THF too swelled the composite to a large extent and it mixed partially with water, however, the solubility of sugar in the water was reduced. There was no observable swelling of
the composite when it was soaked in acetone. Acetone mixed with water and this solvent was
used to check if there was any sugar remaining in the composite. The composite did not swell in
water at all, but the solubility of sugar increased when the water was heated to 70-80 'C.
Therefore, water was chosen to be solvent of the choice because it did not swell the PDMS but it
dissolved sugar effectively.
Table 1: Effects of solvents on swelling PDMS50 and dissolving sugar from PDMS-carbon black composite.
Solvent5 ofSelg Obevain
Toluene Large No
Chloroform Large No Phase separation occurs. Solvent prevents
entry of water into pores.
Dichloromethane Large No
(DCM)
Tetrahydrofuran Large Partial Reduced solubility of sugar in mixture. (THF)
Reduced solubility of sugar in mixture
Acetone Small Yes and PDMS barely swelled. However,
good for checking if all sugars have been dissolved.
Heating at 70-80*C increases solubility
Water Negligible Yesofsgr
of sugar.
Although poly(methyl methacrylate) (PMMA) or polystyrene (PS) beads can be used to
create the porous structure in PDMS, they can only be dissolved by organic solvents which will
PDMS. Sugar is preferred over PMMA and PS beads because it is inert and does not react with
PDMS, and it can easily be removed using water, which contributes to an inexpensive and
Chapter 4 MEMS Sensor II: Characterization &
Results of Solid PDMS-Carbon Black Composite
4.0 Solid PDMS-Carbon Black Composite
Before determining the optimal carbon black composition for porous PDMS-carbon black
composite, the electromechanical response of the solid counterpart must be well understood. The
ideal PDMS-carbon black composite that is desirable should have homogeneous resistance, better piezoresistivity than 1.9% AR/Ro per kPa, reversibility, and a low Young's modulus.
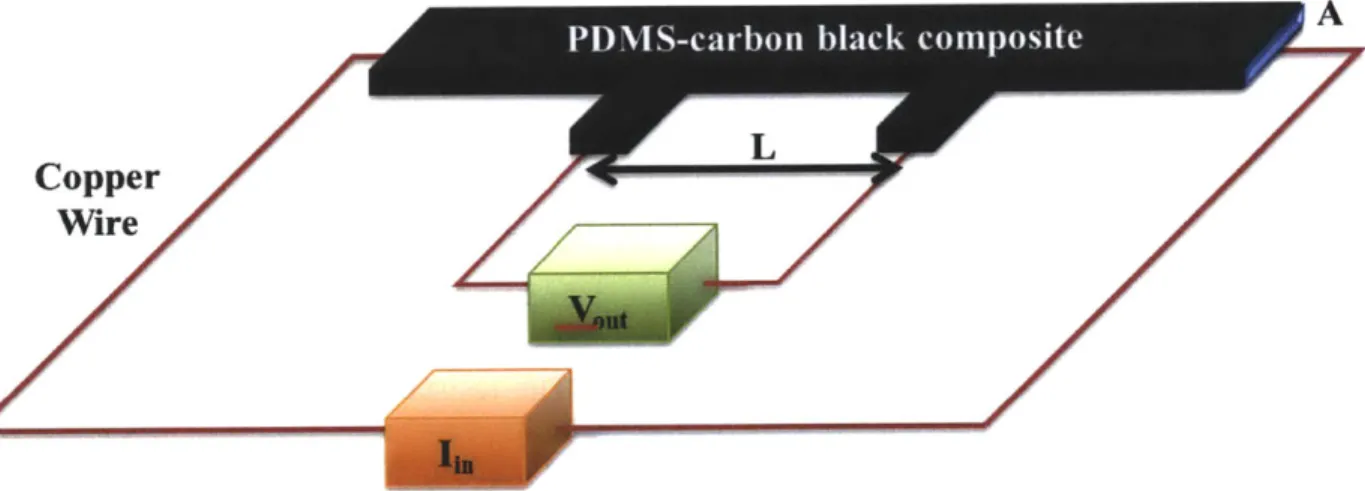
4.1 Electrical Measurements
According to Chapter 1, the biggest piezoresistivity occurs in compositions just below the
percolation threshold where the composite has a high resistivity due to the separation between
conducting filler particles. Under an applied stress, the deformation of the polymer matrix causes
the composite to move past the percolation threshold, causing many orders of magnitude change
in resistance. To find the percolation threshold, the dependence of resistivity on carbon black
composition was studied. PDMS-carbon black composites with multiple carbon black
compositions were fabricated using the method described in Figure 13. Each composite was
measured using a four-point probe measurement where a constant current was applied and the
output voltage was measured, as shown in Figure 15. This method separates the contact
resistance from the total resistance change and the explanation is depicted in Figure 16. Different
currents were applied and the output voltages were measured. The I-V plots for PDMS-carbon
black composite of different compositions were plotted in Figure 17 (a) and the slope of the I-V
RA
using the equation p = -, where A is the cross-sectional area and L is the length of the
composite. Figure 17 (b) shows the resistivity of the composite as a function of carbon black
concentration.
Figure 15: Resistivity measurement of the PDMS-carbon black composite with a four-point
probe technique.
Voltmeter
A
Rcoutact2
Constant Current Source Figure 16: Schematic of circuit diagram for Figure 15.