HAL Id: hal-01128782
https://hal.archives-ouvertes.fr/hal-01128782
Submitted on 4 Feb 2021HAL is a multi-disciplinary open access archive for the deposit and dissemination of sci-entific research documents, whether they are pub-lished or not. The documents may come from teaching and research institutions in France or abroad, or from public or private research centers.
L’archive ouverte pluridisciplinaire HAL, est destinée au dépôt et à la diffusion de documents scientifiques de niveau recherche, publiés ou non, émanant des établissements d’enseignement et de recherche français ou étrangers, des laboratoires publics ou privés.
To cite this version:
Nelson Ibaseta, Éric Climent, Béatrice Biscans. SFGP 2007 - Ultrafine aerosol generation from free falling nanopowders: Experiments and numerical modelling. International Journal of Chemical Reac-tor Engineering, De Gruyter, 2008, 6, pp.A24. �hal-01128782�
SFGP 2007 - Ultrafine Aerosol Generation
from Free Falling Nanopowders:
Experiments and Numerical Modelling
Nelson Ibaseta
∗Eric Climent
†B´eatrice Biscans
‡∗Laboratoire de G´enie Chimique CNRS UMR 5503, [email protected] †Laboratoire de G´enie Chimique CNRS UMR 5503, [email protected]
‡Laboratoire de G´enie Chimique CNRS UMR 5503, [email protected]
Nelson Ibaseta, Eric Climent, and B´eatrice Biscans
Abstract
In the last few years, the interest on nanomaterials and their applications have increased in a considerable way. Hence, the knowledge of the possible hazards on human health becomes necessary. Besides the description of the toxicological effects of nanomaterials, the exposure level on the worksites is one of the key data of the problem. The present work aims at studying the resuspension of ultrafine particles in the air during the falling of nanostructured powders.
A numerical approach has been developed aiming at simulating the free falling of a powder cluster. The results show that a resuspension of particles occurs fol-lowing the powder cluster deformation during the free fall of the particles in the air. Isolated particles remain suspended in the air for a long time.
Free falling experiences have been carried out in a 180*50*80 cm chamber with TiO2and SiO2nanostructured powders. An Electric Low Pressure Impactor (ELPI)
has been used for measuring the particle number concentration as well as the size distribution of the generated aerosols (particle suspension in the air). The ag-glomerates constituting the original powder were resuspendend in the air. The presence of ultrafine aggregates of TiO2 and SiO2 nanoparticles in the air has
been checked by ELPI measurements and SEM visualizations of the ELPI stages. The aerosol size distribution is bimodal with two populations, concerning a crometric nanostructured agglomerates, and ultrafine aggregates coming from mi-crometric agglomerates break-up. The influence of the height of the fall upon the
∗The authors want to acknowledge the CNRS (French National Scientific Research Centre) and
the INRS (French National Research and Security Institute) for their financial support within the framework of the ACI DINANO project. Lucien Datas and St´ephane Le Blond du Plouy, from the TEMSCAN Service of Paul Sabatier University of Toulouse, are gratefully acknowledged for the images obtained by SEM.
1. INTRODUCTION
In the last few years, there was a growing interest in the study of nanomaterials, applications and production. Nanomaterials are defined as having at least one dimension in the nanometric scale (less than 100 nm). Their peculiarity comes from the large amount of atoms which are presents on the particle surface (grain boundaries) compared to their relative small volume. It is the reason of the different properties (mechanical, optical, electronic and much more) of nanomaterials when comparing to the raw materials (Brune et al., 2006).
Some works have been devoted to the toxicological (Maynard, 2006; Oberdörster et al., 2007) and environmental (Moore, 2006) risks of nanopowders. These works have shown that for equivalent substance, the effect on the human health can be more severe for nanoparticles than for coarser particles. The respiratory deposition depends on the particle size. Smaller sizes enhance the access into the blood streams through the alveoli and through the nose. Contrary to coarser particles, the toxicological effect of nanoparticles is not determined by the total inhaled mass. Surface area, particle number and shape seem to be more pertinent parameters.
Table 1. Measured physical properties of the tested powders.
TiO2 SiO2
Primary particle size
(given by the manufacturer) 5-10 nm 12 nm Agglomerate mass median diameter
(Mastersizer 2000) 1.6 μm 11.5 μm Agglomerate number median
diameter (Mastersizer 2000) 0.93 μm 5.1 μm Particle density (Helium pycnometry) 3 100 kg/m3 2 300 kg/m3 Tapped density
(Hosokawa Micron Powder Tester) 620 kg/m3 58 kg/m3 BET Surface 340 m2/g 200 m2/g Fractal Dimension (Mastersizer
2000) - 2.09
Despite the existence of toxicological works, studies concerning the nanoparticle exposure levels in worksites are still very scarce. To the best of our knowledge, few analyses are only concerned with the carbon nanotube release (Baron et al., 2003; Maynard et al., 2004). This work aims at giving new data to
describe and understand the undesirable nanoparticle release during the free fall of a nanopowder.
In our experimental facility, a 180*50*80 cm stainless steel chamber has been used with two High Efficiency Particulate Air (HEPA) filters in both the air inlet and outlet. The powder was stored in a silo which can be located at a variable height in the chamber. The silo has a vibrated rotating beaker to enforce the powder fall in a reproducible way. The size distribution and concentration of the generated aerosol have been measured with an Electric Low Pressure Impactor (ELPI) during and after the powder fall.
The selected nanopowders were titanium dioxide (G5, Millennium Inorganic Chemical ®) and fumed silica (Aerosil 200, Degussa ®). The properties of both powders are reported in Table 1.
2. DIMENSIONLESS NUMBERS
The free fall of a particle cluster through air, which is initially at rest, will be studied by means of numerical modelling. The temperature is assumed to be constant and uniform in the domain. Hence, the airflow is only induced by the falling powder. In that case, the powder aerodynamic behaviour can be described by some dimensionless numbers which concern an isolated particle (Reynolds, Stokes and Peclet numbers) or the collective motion of the particle cluster. The particulate Reynolds number, Rep, characterises the ratio between the inertial forces and the viscous forces acting on an isolated particle. It is given by Equation (1), where the settling particle velocity, the particle radius and the kinematic viscosity are respectively Up, a and ν.
ν a U
Re p
p = (1)
Viscous forces acting over very small particles are much more significant than inertial forces (Rep<<1). In that case, the particle settling velocity, Equation (2), is obtained by using the Stokes’ law. Up depends on the density ratio (ρ*=
ρp/ρf) and the acceleration of the gravity (g); it scales with the square of the radius.
ν a g ) 1 ρ ( 9 2 U 2 * p ⋅ ⋅ − ⋅ = (2)
Due to collective effect, the particle cluster can have a different dynamics. It is then desirable to define the cluster Reynolds number (Red), Equation (3). Even at low concentrations, aerosols have a strongly inertial behaviour. This is due to the large difference between the density of the air and the equivalent density of the cluster. The Stokes’ law is no longer relevant for estimating the settling speed of the cluster. It is more appropriate to use a drag coefficient equal
to 0.45 (Crowe et al., 1998), assuming that the spherical shape of the cluster is maintained during the fall. Hence the particle cluster settling velocity can be approximated by the Equation (4). This equation is valid for cluster Reynolds numbers in the range 103 to 2·105. (Note that the cluster Reynolds number given by Equations (3) and (4) is only approximate, because the particle cluster is deformed during its fall and hence its velocity is continuously changing).
ν R U
Re d
d = (3)
The classical drag coefficient experienced by a solid sphere at high Reynolds number is roughly equal to 0.45. This can give an estimation of the mean settling velocity (eq. 4) of the cluster considered as a non-deformable solid sphere. Based on the results of Vanni (2000), a more appropriate estimation of the drag coefficient may be used while the cluster can be considered as a solid porous media (collection of aggregates of primary nanoparticles). Although such an estimation of the settling velocity of the cluster as a whole is probably more accurate, the dominant phenomenon is the deformation of the cluster along the falling path which leads to the aerosol generation together with a strong variation of the mean velocity. The Reynolds numbers Red in Table 2 are only indicative pointing out that the hydrodynamic regime of the flow around the cluster is more likely to be turbulent.
(
)
45 . 0 R g ε 1 ) 1 ρ ( 3 8 U * d ⋅ ⋅ − ⋅ − ⋅ = (4)The Stokes number, St, characterises the ratio between the particle
relaxation time, τp, Equation (5), and a fluid flow characteristic time. In the case of the free fall of a particle cluster, the characteristic time is the ratio between the radius of the cluster and its settling velocity.
ν a ρ 9 2 τ 2 * p = ⋅ (5)
When the Stokes number, Equation (6), is high (St>>1), the particle
relaxation time is high compared to the fluid flow characteristic time. Hence, the particle behaviour is strongly inertial (the particles need a long time to respond to a velocity fluctuation in the fluid). On the other hand, when the Stokes number is small (St<<1), the particle relaxation time is small and the particles will adapt
quickly to the fluctuations in the fluid motion (this is the typical case of nanopowders in air). R U τ St d p = (6)
Finally, the Froude number (Fr) gives the ratio between the inertial forces
and the gravitational force acting on the particle cluster, Equation (7).
R g U Fr d ⋅ = (7)
For very small particles (particle size of the order of 1 μm or smaller), the Brownian diffusion due to thermal agitation must be taken into account. For an isolated particle, the diffusion coefficient can be estimated by the Stokes-Einstein prediction, Equation (8), where the Boltzmann’s constant k=1.381·10-23 Nm/K,
the fluid temperature T, and the dynamic viscosity μ:
a πμ 6
kT
D= (8)
Aiming at quantifying the respective role of diffusion on the global behaviour of the aerosol, the Peclet number (Pe) is defined, as the ratio between
the settling motion of an isolated particle and its diffusive motion. A small Peclet number implies that the diffusive motion is significant.
D a U
Pe= p (9)
The dimensionless numbers corresponding to the selected nanopowders are reported in Table 2.
Table 2. Dimensionless numbers corresponding to the tested nanopowders.
TiO2 SiO2 ReP 3·10-6 3·10-4 Red 5·10+4 2·10+4 St 7·10-3 5·10-2 Fr 4·10+1 1·101 Pe 6 1·10+3 3. PHYSICAL MODEL
An Eulerian-Lagrangian approach has been used to simulate the fall of the particle cluster. The air flow can not be known a priori because it is induced by the
collective particle motion. Hence the motions of the two phases (particles and air) are intimately coupled through the local and instantaneous momentum transport. In the numerical model, the air flow is obtained by direct numerical solution of the Navier-Stokes equations, Equations (10) and (11), where a source term (φs) has been included.
(10)
0 =
u
s φ u u u u =−∇ + ⋅ + ⎥⎦ ⎤ ⎢⎣ ⎡ + ⋅∇ ∂ ∂ ⋅ P μ Δ t ρf (11)
The source term takes into account the interactions between the particles and the fluid, Equation (12). Its spatial distribution depends on the particle positions and on the particle-fluid forces. The first term in Equation (12) corresponds to the forces applied on the fluid by the particles. The second one models the effective reduction of the local inertia and weight of the fluid when a fraction of the volume is occupied by the particles.
∑ = ⎥⎦ ⎤ ⎢ ⎣ ⎡ ⎟ ⎠ ⎞ ⎜ ⎝ ⎛ + ⋅∇ − ∂ ∂ ⋅ ⎟ + ⎟ ⎠ ⎞ ⎜⎜ ⎝ ⎛ − ⋅ = Np 1 i f , p p f p t ρ dt dU ρ V V g u u u g φ i s (12)
Equations (10), (11) and (12) are directly solved using a finite volume method for the discretization on a staggered grid. Second order accuracy in time and space are achieved using a third order Runge-Kutta scheme together with the use of an auxiliary potential to enforce incompressibility. Simultaneously, the trajectories of the particles are determined by the force balance acting on each individual particle. This balance takes into account the buoyancy, drag and inertial forces, Equation (13). Particles are assumed to be free of electric charges; therefore the particle-particle interactions are neglected. As a first approximation, we assume in the modelling approach that aggregates of nanoparticles which correspond to the Lagrangian elements of the simulation are not experiencing any colloidal or chemical bonds. This assumption is presumably very restrictive for strongly cohesive powders (TiO2) but may be acceptable for loose clusters of
softly linked particles (SiO2).
(
)
g U u(
U u)
U -- 2 p p D f p f p p p p πa 2 1 C ρ V ρ ρ dt d V ρ = ⋅ (13)Equation (13) is integrated by a 4th order Runge-Kutta scheme. The time step is at least 10 times smaller than the particle relaxation time τp. At each time step, a Brownian motion contribution, Equation (14), is added. ξ is a random
vector following a Gaussian distribution with a standard deviation equal to one.
dt D 2
dr= ξ⋅ ⋅ ⋅ (14)
The system of coupled equations has been solved only in 2-D configurations. In some cases, the particle falls through a fixed domain. In other cases, the particle cluster is fixed in the centre of the domain, by setting a fluid velocity of the same intensity as the particle motion, but in the opposite direction. This corresponds to a uniform translation of the referential.
4. NUMERICAL RESULTS 4.1 Code Validation
The free fall of a particle cluster without Brownian diffusion (Pe→∞) has been
already studied for small and moderate Reynolds number, Red<100 (Nitsche and Batchelor, 1997, Machu et al., 2001, Bosse et al., 2005). Aiming at validating our approach, we have carried out some simulations with physical properties similar to those of Bosse et al. (2005). Initially, the particles are randomly seeded within a cylindrical shape (or spherical in three-dimensional simulations). Within the cluster, the overall particle concentration is homogeneous at the initial state. The origin of the deformation and break-up of the cluster is only related to the coupled dynamics of the carrying gas flow and the particle trajectories.
0
0.5
-0.5
-0.5
0
0.5
4.5
5.0
5.5
4.5
5.0
5.5
0
0.5
-0.5
-0.5
0
0.5
4.5
5.0
5.5
4.5
5.0
5.5
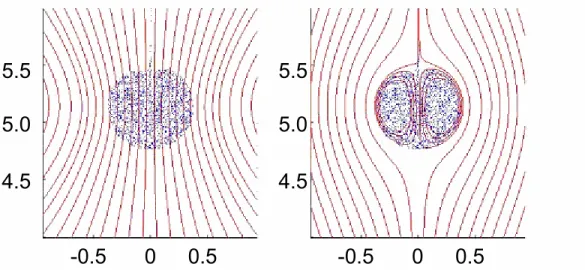
Figure 1. Streamlines of the flow, Red=10-2, St=10-3, Fr=0.448, ρ*=1 000. Left: Steady frame of reference. Right): Frame of reference moving with the centre of
the particle cluster. Each box is 2*2 cm size.
Figure 1 shows the streamlines of the fluid in a fixed frame of reference and in the frame of reference moving with the centre of the particle cluster (Red=10-2, St=10-3, Fr=0.448, ρ*=1 000). The agreement between our results and those of Bosse et al.(2005) is good. It is important to note that even for small particle Reynolds number there is a particle leakage in the wake of the drop. This release leads to a loss of stability of the drop, which is going to break during its fall (Metzger et al., 2007).
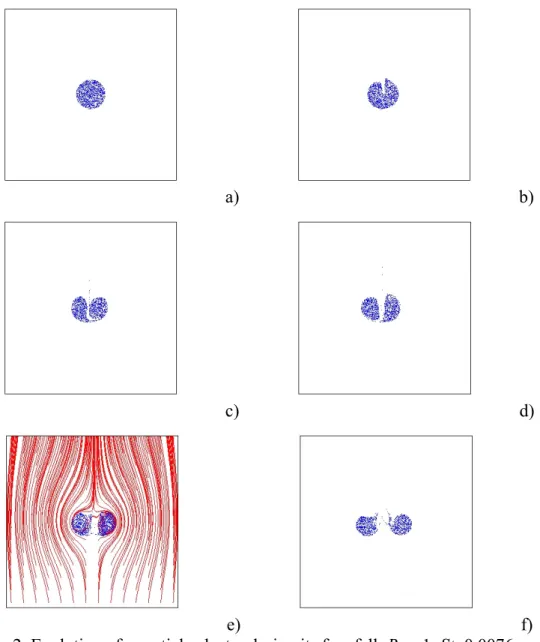
The Figure 2 shows the unsteady evolution of the particle cluster for
Red=1 (St=0.076, Fr=4.47 and ρ*=1 000). The shape of the particle cluster is unsteady and breaks into two distinct clusters. The two clusters evolve separately
and continue to break up into smaller clusters. This behaviour is due to the particle leakage in the wake of the particle cluster; the continuous release of particles depopulates the centre of the cluster and provokes the cluster separation when the fluid is able to flow through the cluster.
This second result is also in agreement with those of Bosse et al. (2005). We can conclude that for similar values of the Reynolds number, the qualitative behaviour of the break-up process of the particle drop is properly simulated.
a) b)
c) d)
e) f)
Figure 2. Evolution of a particle cluster during its free fall. Red=1, St=0.0076,
Fr=4.47, ρ*=1 000. a) t=0 s; b) t=0.1 s; c) t=0.2 s; d) t=0.3 s; e) t=0.4 s; f) t=0.5 s.
g) h)
i) j)
Figure 2 (continuation). . Red=1, St=0.0076, Fr=4.47, ρ*=1 000. g) t=0.6 s; h) t=0.7 s; i) t=0.8 s; j) t=0.9 s. Each box is 2*2 cm size.
4.2 Impact of a Particle Cluster onto a Plane Solid Surface
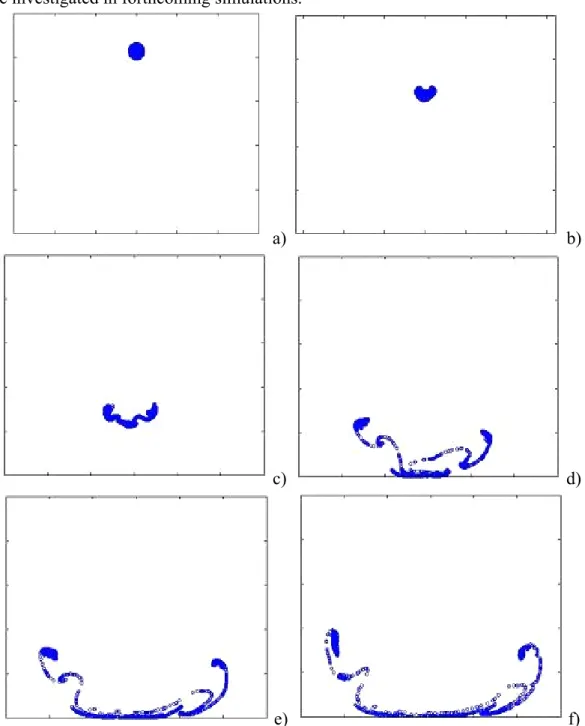
Then, we used our numerical model for studying the impact of a particle cluster onto a solid surface. The corresponding dimensionless numbers are Red=96.3,
St=0.739, Fr=44.0 and ρ*=1 000. In this case, the particle cluster deforms very quickly and spreads over the horizontal direction, especially after the impact. It is clearly possible to observe isolated particles which may be suspended in the air for a long time.
Some simulations taking into account the Brownian diffusion have also been carried out. However, the diffusion coefficient corresponding to the considered physical properties is barely 2·10-13 m2/s (Pe=105). Hence, there are not remarkable differences between the results with and without diffusion.
When the particles of the cluster are impacting on the flat horizontal surface at the bottom of the simulation domain, we assume that the rebound is purely elastic (normal velocities before and after rebound are opposite while the tangential velocity is unchanged). This assumption is presumably not realistic while the aggregates of nano-particles may release fine aerosol originating from
the breakage of the fractal structure of the powder. This aspect of the model will be investigated in forthcoming simulations.
a) b)
c) d)
e) f)
Figure 3. Temporal evolution of the particle cluster when impacting onto a solid surface. a) t=0 s; b) t=0.05 s; c) t=0.10 s; d) t=0.15 s; e) t=0.20 s; f) t=0.25 s. The
g) h)
i) j)
Figure 3 (continuation). g) t=0.30 s; h) t=0.35 s; i) t=0.40 s; j) t=0.45 s. The box dimensions are 5*6 cm. Red=96.3, St=0.739, Fr=44.0, ρ*=1 000.
5. EXPERIMENTAL RESULTS
As shown in Table 2, the cluster Reynolds numbers for the tested powders are in the order of 104. This indicates that the particle cluster behaviour is strongly
inertial. Hence, it is going to rapidly deform, leading some particles to be isolated. Since the settling velocity of the isolated particles is very small, they can stay in the air for a long time. This fact is checked by visual observation of the fall and by the measurements carried out with the ELPI in our experimental set-up (Ibaseta and Biscans, 2007).
Figures 4 and 5 show the size distribution of the generated TiO2 aerosols,
for different heights of fall and two dropped masses. In these distributions, the particle size is measured in terms of aerodynamic diameters. Aerodynamic diameter is defined as the diameter of the sphere having a unit density of 1 000 kg/m3 and the same settling velocity as the particle. It is the particle property that
0 1000 2000 3000 4000 5000 6000 7000 0.04 0.07 0.12 0.20 0.31 0.48 0.75 1.22 1.93 3.05 5.11 8.05 Aerodynamic diameter (μm) Nu m b er co n cen tr at io n ( p art icl es /c m 3) 160 cm 120 cm 80 cm 50 cm
Figure 4. Size distribution of the TiO2 aerosols at a height of sampling of 50 cm from the bottom, for different heights of fall and a same dropped mass (49.5 g)
0 50 100 150 200 250 0.04 0.07 0.12 0.20 0.31 0.48 0.75 1.22 1.93 3.05 5.11 8.05 Aerodynamic diameter (( m) Nu m b er c o n ce n tr at io n ( p ar ti cl es /c m 3) 160 cm 120 cm 80 cm
Figure 5. Size distribution of the TiO2 aerosols at a height of sampling of 50 cm
determines the particle deposition in airways. The generated aerosols have a bimodal distribution, independently of the experimental conditions. Maxima are at 38 nm and 1.22 μm. When the aerodynamic diameter is converted to the mobility diameter (the diameter of the particle having the same velocity to driving force ratio), these maxima correspond to 27 nm and 998 nm. Hence, the first maximum seems to indicate that there is a resuspension of ultrafine aggregates of TiO2 during the fall of the powder or during the impact against the impact solid
surface, whereas the second one indicates the resuspension of the micrometric nanostructured agglomerates constituting the powder.
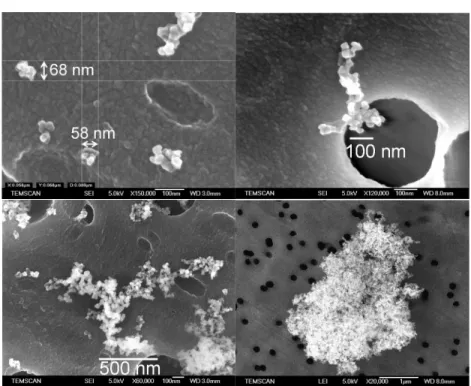
100 nm 100 nm 63 nm 57 nm 100 nm 100 nm 1 μm 1 μm
Figure 6. TiO2 aggregates collected on the ELPI stages and observed by SEM.
Aiming at verifying the existence of ultrafine aggregates in the air, the ELPI stages have been observed by Scanning Electron Microscopy (SEM). Figure 6 show some TiO2 agglomerates and aggregates which are present in the air after
the powder fall. Ultrafine aggregate concentration seems to depend on the experimental conditions.
On the other hand, nanostructured micrometric agglomerate concentration (second peak of the size distribution) seems to be strongly influenced by experimental conditions. Since particle mass can be neglected in the case of ultrafine aggregates, resuspension of micrometric agglomerates can be studied by analyzing the influence of the experimental conditions on the mass concentration
of the aerosol. Figure 7 shows the total mass concentration estimated from the ELPI measurements, for different heights of fall and dropped masses. For a given
c = 1E -07h2.09 R2 = 0.9278 c = 2E -06h1.28 R2 = 0.8369 c = 2E -06h1.57 R2 = 0.8357 0 0.001 0.002 0.003 0.004 0.005 0.006 0.007 0.008 0.009 0 20 40 60 80 100 120 140 160 He ight of fa ll (cm ) Ma ss c o n ce n tr at io n p er d ro p p ed m as s (-/m 3) TiO2, 45.9 g TiO2, 5.5 g S iO2, 5.5 g
Figure 7. Mass concentration of the generated aerosol as a function of the height of fall at 50 cm from the impact surface. Aiming to compare both powders,
experiences have been carried out for a same volume of powder
height of fall, the aerosol mass concentration is higher for higher mass of powder, even when concentrations are normalized by the dropped mass. For a given mass of powder, the aerosol mass concentration increases with the height of fall (h)
following a power law. Exponent values are 1.28 for 5.5 g of dropped TiO2 and
2.09 for 49.5 g. They are in good agreement with previous works concerning micrometric powders (Cheng, 1973; Sutter et al., 1982; Plinke et al., 1991; Heibrink et al., 1992), where the fractional mass loss resuspended in air depends on hα, with α values ranging between 0.58 (Cheng, 1973) and 2.0460 (Sutter et al, 1982). In our case, an interaction of both parameters, dropped mass and height of fall, is observed. This kind of interaction has been already observed by Suttler et al. (1982) for micrometric TiO2.
Figure 8 shows the size distribution of the SiO2 aerosol, when dropping
5.5 g of powder. The size distribution is bimodal, with a maximum at 38 nm and another at 8.05 μm, when sizes are represented by the aerodynamic diameter. When the particle size is represented by the mobility diameter, these maxima correspond to 38 nm and 7.97 μm. The second maximum indicates that there is a resuspension of the micrometric nanostructured agglomerates of the powder, whereas the first one indicates the presence of ultrafine aggregates coming from the break-up of the micrometric agglomerates. The existence of ultrafine aggregates has been checked by SEM visualization of the particles collected on the ELPI stages, as shown in figure 9. Figure 9 also shows that SiO2 particles
have a fractal structure.
The effect of the experimental conditions on the nanostructured micrometric agglomerates can be analyzed by considering the aerosol mass concentration. Figure 7 shows the total mass concentration estimated from the ELPI measurements of SiO2 aerosols, for different heights of fall. As it was the
case for TiO2, aerosol mass concentration depends on the height of fall following
a power law. Exponent value has been found to be 1.57, in good agreement with previous works.
Comparing TiO2 and SiO2, for a same volume of dropped powder, the
mass concentration (normalized by the dropped mass) is almost the same for both powders, although a little higher for fumed silica. For a same mass of dropped powder, fumed silica generates a much more concentrated aerosol. This indicates that SiO2 powder is dustier than the TiO2 one.
6. CONCLUSION
There is a resuspension of particles in the air during the free fall of nanopowders. Some particles are actually micrometric agglomerates already present in the original powder. The resuspension of these agglomerates agrees qualitatively
previous works for micrometric particles. However, there is also a release of ultrafine aggregates, coming from the breakage of the micrometric agglomerates.
A numerical code has been used to simulate the fall of a particle cluster for small and moderate drop Reynolds number by an Eulerian-Lagrangian approach. It has been shown that a particle resuspension is possible, due to the deformation of the particle cluster during the fall and during the impact against a solid surface. Some numerical improvements (in development) are still required to extend the simulations to the same aerodynamic conditions of the experiments.
NOTATION
a particle radius, m
C coefficient
D diffusion coefficient, m2/s
Fr Froude number, -
g acceleration of the gravity, m/s2
h height of fall, m
k Boltzmann’s constant, 1.381·10-23 Nm/K
N number, -
P pressure, Pa
Pe Peclet number, -
R particle cluster radius, m
r position, m Re Reynolds number, - St Stokes number, - T temperature, K t time, s U velocity, m/s u fluid velocity, m/s V volume, m3 Greek Letters ε void fraction, -
φ source term, Pa/m
μ viscosity, Pa·s ν kinematic viscosity, m2/s ξ random value, - ρ density, kg/m3 τ relaxation time, s Superscripts * particle-to-fluid ratio
Subscripts D drag d particle drop f fluid p particle s source REFERENCES
Baron, P.A., Maynard, A.D., Foley, M., “Evaluation of Aerosol Release During the Handling of Unrefined Single Walled Carbon Nanotube Material”, NIOSH DART-02-191 (2003).
Bosse, T., Kleiser, L., Härtel, C., Meiburg, E., “Numerical simulation of finite Reynolds number suspension drops settling under gravity”, Phys. Fluids, Vol. 17, No. 3, 037101 (2005)
Brune, H., Ernst., H., Grunwald, A., Grünwald, W., Hofmann, H., Krug, H., Janich, P., Mayor, M., Rathgeber, W., Schmid, G., Simon, U., Vogel, V., Wyrwa, D., “Nanotechnology. Assessment and Perspectives”. Springer Berlin Heidelberg, 67-285, (2006).
Cheng, L., “Formation of Airborne – Respirable Dust at Belt Conveyor Transfer Points”. Am. Ind. Hyg. Assoc. J., Vol. 34, No. 12, 540-546 (1973).
Crowe, C., Sommerfeld, M., Tsuji, Y., “Multiphase Flows with Droplets and Particles”, Boca Raton, CRC Press, 70, (1998).
Heitbrink, W.A., Baron, P.A., Willeke, K. “An Investigation of Dust Generation by Free Falling Powders”. Am. Ind. Hyg. Assoc. J., Vol. 53, No. 10, 617-624 (1992).
Ibaseta, N., Biscans, B., “Ultrafine Aerosol Emissions from the Free Fall of TiO2
and SiO2 Nanopowders”, KONA Powder and Particle, Vol. 25, 190-204 (2007)
Keskinen, J., Pietarinen, K., Lehtimäki, M., “Electrical Low Pressure Impactor”, J. Aerosol Sci., Vol. 23, No. 4, 353-360 (1992).
Machu, G., Meile, W., Nitsche, L.C., Schaflinger, U., “Coalescence, torus formation and breakup of sedimenting drops : experiments and simulations”, J. Fluid Mech., Vol. 447, 299-336 (2001).
Maynard, A.D., “Nanotechnology : Assessing the risks”, Nanotoday, Vol. 1, No. 2, 22-33 (2006).
Maynard, A.D., Baron, P.A., Foley, M., Shvedova, A.A., Kisin, E.R., Castranova, V., “Exposure to Carbon Nanotube Material: Aerosol Release During the Handling of Unrefined Single-Walled Carbon Nanotube Material”, J. Toxicol. Environ. Health Part A, Vol. 67, No. 1, 87-107 (2004).
Metzger, B., Butler, J.A., Guazzelli, E., “Experimental investigation of the instability of a sedimenting suspension of fibres”. J. Fluid Mech., Vol. 575, 307-332 (2007).
Moore, M.N., “Do nanoparticles present ecotoxicological risks for the health of the aquatic environment?”, Environment International, Vol. 32, No. 8, 967-976 (2006).
Nitsche, J.M., Batchelor, G.K., “Break-up of a falling drop containing dispersed particles”, J. Fluid Mech., Vol. 340, 161-175 (1997).
Oberdörster, G., Stone, V., Donaldson, K. “Toxicology of nanoparticles : A historical prespective”. Nanotoxicology, Vol. 1, No. 1, 2-25 (2007).
Plinke, M.A.E., Leith, D., Holstein, D.B., Boundy, M.G. “Experimental Examination of Factors that Affect Dust Generation”. Am. Ind. Hyg. Assoc. J., Vol. 52, No. 12, 521-528 (1991).
Sutter, S.L., Johnston, J.W., Mishima, J. “Investigation of accident-generated aerosols: releases from free fall spills”. Am. Ind. Hyg. Assoc. J., Vol. 43, No. 7, 540-543 (1982).