Lawrence Berkeley National Laboratory
Recent Work
Title
Emissions from Electronic Cigarettes: Key Parameters Affecting the Release of Harmful Chemicals.
Permalink
https://escholarship.org/uc/item/9s90850c
Journal
Environmental science & technology, 50(17)
ISSN
0013-936XAuthors
Sleiman, Mohamad Logue, Jennifer M Montesinos, V Nahuel et al.Publication Date
2016-09-01DOI
10.1021/acs.est.6b01741 Peer reviewedeScholarship.org Powered by the California Digital Library
Emissions from Electronic Cigarettes: Key Parameters A
ffecting the
Release of Harmful Chemicals
Mohamad Sleiman,
†,‡,§Jennifer M. Logue,
†V. Nahuel Montesinos,
∥Marion L. Russell,
†Marta I. Litter,
∥,⊥Lara A. Gundel,
†and Hugo Destaillats
*
,††Indoor Environment Group, Lawrence Berkeley National Laboratory, 1 Cyclotron Road, MS70-108B, Berkeley, California 94720,
United States
‡Institut de Chimie de Clermont-Ferrand (ICCF), Université Clermont Auvergne, Sigma-Clermont, BP 10448, F-63000
Clermont-Ferrand, France
§ICCF, UMR 6296, CNRS, F-63178 Aubière, France
∥División Química de la Remediación Ambiental, CNEA-CONICET, Avenida Gral. Paz, (1650) San Martín, Buenos Aires, Argentina ⊥Instituto de Investigación e Ingeniería Ambiental, Universidad de General San Martín, Campus Miguelete, Av. 25 de Mayo y Francia,
(1650) San Martín, Buenos Aires, Argentina
*
S Supporting InformationABSTRACT: Use of electronic cigarettes has grown exponentially over the past few years, raising concerns about harmful emissions. This study quantified potentially toxic compounds in the vapor and identified key parameters affecting emissions. Six principal constituents in three different refill “e-liquids” were propylene glycol (PG), glycerin, nicotine, ethanol, acetol, and propylene oxide. The latter, with mass concentrations of 0.4−0.6%, is a possible carcinogen and respiratory irritant. Aerosols generated with vaporizers contained up to 31 compounds, including nicotine, nicotyrine, formaldehyde, acetaldehyde, glycidol, acrolein, acetol, and diacetyl. Glycidol is a probable carcinogen not previously identified in the vapor, and acrolein is a powerful irritant.
Emission rates ranged from tens to thousands of nanograms of toxicants per milligram of e-liquid vaporized, and they were significantly higher for a single-coil vs a double-coil vaporizer (by up to an order of magnitude for aldehydes). By increasing the voltage applied to a single-coil device from 3.3 to 4.8 V, the mass of e-liquid consumed doubled from 3.7 to 7.5 mg puff−1and the total aldehyde emission rates tripled from 53 to 165μg puff−1, with acrolein rates growing by a factor of 10. Aldehyde emissions increased by more than 60% after the device was reused several times, likely due to the buildup of polymerization byproducts that degraded upon heating. These findings suggest that thermal degradation byproducts are formed during vapor generation. Glycidol and acrolein were primarily produced by glycerin degradation. Acetol and 2-propen-1-ol were produced mostly from PG, while other compounds (e.g., formaldehyde) originated from both. Because emissions originate from reaction of the most common e-liquid constituents (solvents), harmful emissions are expected to be ubiquitous when e-cigarette vapor is present.
■
INTRODUCTIONIn recent years, consumption of electronic cigarettes (“vaping”) has grown exponentially in the United States and several other countries. While advocates embrace this development as a harm reduction approach to curb consumption of conventional (combustion) cigarettes, many experts have raised concerns about potential harm to public health.1−5E-cigarettes may serve as a gateway to tobacco addiction for a new generation of users, and contribute to the relegitimization and glamorization of tobacco-containing products. Furthermore, there are concerns about health effects associated with vapor constituents. Mists containing propylene glycol, a liquid used to generate the vapor in e-cigarettes, can cause ocular and upper airway irritation.6 Several recent studies have measured harmful pollutants in
vapor generated by e-cigarettes, including fine and ultrafine particles,7−10 reactive oxygen species (ROS),11 and toxic compounds associated withflavorants.12Increased attention is being paid to the presence of aldehydes associated with irritation of the respiratory tract and/or carcinogenicity, such as formaldehyde, acetaldehyde, and acrolein.13−19 While these emissions primarily affect the users of the products, a non-negligible fraction of the toxicants in exhaled vapor may also impact nonusers through secondhand exposures. Due to the
Received: April 8, 2016 Revised: June 21, 2016 Accepted: July 6, 2016 Published: July 27, 2016
growing concerns about such passive exposures, local govern-ments and public and private institutions are increasingly restricting vaping in public spaces.
A typical e-cigarette is powered by a rechargeable battery connected to a reservoir containing an“e-liquid” that the user periodically refills. The user activates the heating coils by holding down a push button during inhalation. The e-liquid is rapidly vaporized by being wicked through one or two coils and aerosolized as the user inhales the vapor and dilution air through a mouthpiece. There are thousands of e-liquids in the market, most of which contain nicotine in varying concen-trations (typically up to 30 mg mL−1) in addition toflavorings and other additives dissolved in propylene glycol (PG), vegetable glycerin (VG), or a mixture thereof. The body of the device is often referred to as a vaporizer, cartomizer, or clearomizer depending on its configuration and the materials used to house the coil(s) and deliver the e-liquid. This study used devices that are best described as clearomizers: their transparent tank enables users to see the liquid content. Figure S1 (Supporting Information) shows a schematic description. Silica wicks deliver the e-liquid to the coil, which is typically wrapped around a middle section of the wick. Devices vary in wick length, coil resistance, number of coils, coil placement, and airflow resistance. Rechargeable lithium ion batteries offer a variety of voltages and storage capacities and provide between 100 and 300 puffs per charge. The temperature at which the e-liquid is vaporized is a function of the power output (as determined by the battery voltage and current through the coil) and geometry. The temperature of the coil and amount of heat transferred to the vapor depend on the puff duration, the puff frequency, and the heat transfer properties around the coil. For the same battery and vaping behavior, the coil temperature can vary widely from device to device. Factors that can impact the coil and vapor temperatures include the size of the coils, the air flow velocities, the amount of liquid carried by the wick, and the heat capacity of the liquid. The temperatures at which e-liquids are vaporized have strong impacts on emissions.15,16,19 Determining the operating temperature of an e-cigarette is a nontrivial heat transfer problem that cannot be predicted from the battery and coil characteristics alone. Accurate measure-ment of the operating temperatures presents significant challenges due to the presence of large gradients and spatial variability inside the device.
In addition to these physical and chemical differences from conventional cigarettes, vaping behavior also differs significantly from traditional smoking, and varies among users (“vapers”). Typical e-cigarette consumption topography accounts for vaping rates during active use periods of 2−4 puffs per minute, puff volumes of ∼50 mL, puff durations in the range of 2−8 s, interpuff intervals of 18−30 s, and puffing flow rates of ∼20 mL s−1.14,20−23A recent survey of 983 vapers reported an average maximum number of puffs of 235 puffs per day.24
This frequency leads to an estimated average consumption rate of ∼15 puffs h−1, which may increase by factors of 5−20 during active vaping periods, consistent with the rates described above. Because smokers and former smokers often make a compensatory use of e-cigarettes, the total volume of vapor inhaled in 10 min of active puffing can be as high as 4 times the amount of smoke from one cigarette inhaled by cigarette smokers, to achieve a comparable nicotine intake.20
This study pinpoints key parameters influencing chemical emissions from e-cigarettes and identifies chemical pathways and vaping conditions that yield harmful compounds. The
predicted health impacts of active and passive exposures associated with these emissions will be investigated in a follow-up paper.
■
MATERIALS AND METHODSChemicals, E-Liquids, and Vaporizers. Carbonyl-free acetonitrile (Honeywell), propylene glycol (>99.5%, Fluka), and glycerol (99.5%, Aldrich) were used without further purification. Authentic standards for 2,4-dinitrophenylhydra-zones of formaldehyde, acetaldehyde, acrolein, acetone, propanal, crotonaldehyde, and methacrolein were obtained from Sigma-Aldrich. Authentic standards for glycidol, acetol, nicotyrine, nicotine, diacetyl, propylene oxide, and 1-bromo-4-fluorobenzene (96%) were also obtained from Sigma-Aldrich. E-liquids, vaporizers, batteries, and chargers were purchased from retail stores in Berkeley, CA.
Temperature Measurements. The temperature profile of the emitted vapor was measured with a K-type thermocouple (Omega Engineering Inc.) connected to a HOBO (Onset Corp.) data logger. The thermocouple was carefully placed inside the mouthpiece of each vaporizer, avoiding contact with the walls or any other internal part of the devices.
Analytical Methods. The composition of volatile con-stituents of e-liquids was determined using headspace gas chromatography with mass-selective detection (HS-GC/MS; Shimadzu HS-20 coupled with QP2010SE) for 5 min of incubation at 80, 200, or 280°C, a sample volume of 0.1−0.5 mL, pressurization at 50 kPa, and injection of 1μL with a 50:1 split. The analytical column (Phenomenex Wax Plus, 30 m× 0.25 mm× 0.25 μm) was operated initially at 75 °C over 0.5 min, followed by a 20°C min−1ramp to reach 245°C, and held for 3 min. Mass spectra were scanned between m/z 35 and m/z 300 with a filament energized at 70 eV. Pure and diluted samples (with PG as the solvent) of ethanol, propylene glycol, glycerin, propylene oxide, acetol, and nicotine were analyzed by HS-GC/MS using the conditions described above at two incubation temperatures (80 and 200 °C) to determine their concentration in the headspace. Additional tests were carried out at an incubation temperature of 280°C to explore possible formation of thermal decomposition byproducts during incubation. Quantification was based on integration of the extracted ion current chromatogram for each compound and compared with calibration curves obtained by direct liquid injection. In addition, mixtures of PG, glycerin, nicotine, and/or ethanol were also measured using HS-GC/MS to closely mimic the partitioning of constituents in the e-liquid during HS incubation, and corrected for density and viscosity variation. To calculate the mass fraction of each constituent in the e-liquid, a liquid density of 1.16 g mL−1 was used, assuming that an approximately 50:50 mixture of PG (density 1.04 g mL−1) and glycerin (1.27 g mL−1) did not deviate significantly from ideal behavior.
Volatile carbonyls present in e-liquids and in the vapor were determined using 2,4-dinitrophenylhydrazine (DNPH)-impreg-nated silica gel cartridges (Waters Corp., United States). The cartridges were extracted with 2 mL of acetonitrile and analyzed by HPLC with UV detection (Agilent 1200), following the EPA TO-11 method.25 A calibration curve was generated for quantification of each analyte using authentic standards of the dinitrophenylhydrazones of the carbonyls of interest.
Volatile organic carbons (VOCs) present in e-liquids and in the vapor were analyzed using Carbopack sorbent tubes (Supelco Analytical, Bellefonte, PA). Quantification of each
Environmental Science & Technology Article
DOI:10.1021/acs.est.6b01741
Environ. Sci. Technol. 2016, 50, 9644−9651
compound was carried out by thermal desorption gas chromatography analysis with mass-selective detection (TD-GC/MS) using bromofluorobenzene as an internal standard.26 An Agilent GC/MS system (model 6890/5973) was operated in electron impact mode, and was interfaced with a thermal desorption inlet with an autosampler (Gerstel, Germany). Calibration curves were created for all VOCs for which authentic standards were available. When standards were not commercially available, the compounds were identified through a NIST database and quantified via a surrogate compound.
Determination of the E-Liquid Composition. Three different methods were used to quantify the presence of major constituents and trace impurities in e-liquids: (a) The composition of volatile constituents in each e-liquid was determined by HS-GC/MS at two incubation temperatures, 80 and 200°C. (b) Volatile carbonyls present in the e-liquids were quantified by dissolving 50 mg of each liquid in 2 mL of acetonitrile, from which 50μL was directly injected into DNPH cartridges. These were extracted and analyzed as described above. (c) For VOC quantification using TD-GC/MS, 40−45 mg of each e-liquid was weighed and diluted in 50 mL of methanol. An aliquot of approximately 880 ng was injected into a Carbopack sorbent tube under a flow of helium at 25 mL min−1 for 5 min to evaporate the solvent. The tube was analyzed by TD-GC/MS.
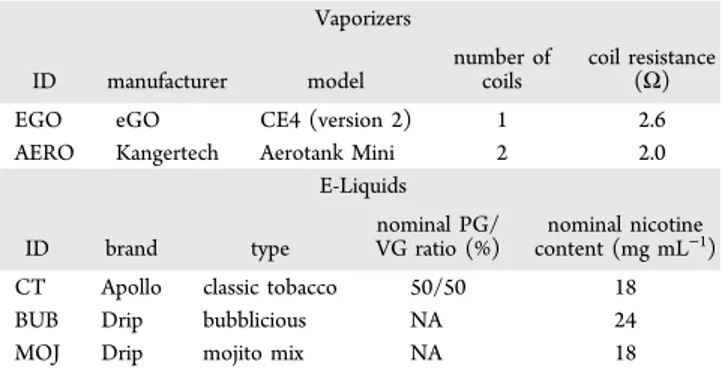
Vapor Generation and Sampling of VOCs and Carbonyls in Mainstream Vapor. A simple laboratory-made “vaping machine”, described in Figure S2 (Supporting Information) was used to generate consistent vapor emissions. Two different vaporizers and three different e-liquids were used in this study. Their main characteristics are summarized in
Table 1. Additional tests were also performed with neat PG and
neat VG to identify emissions associated with heating each of the two solvents. All vaping experiments were carried out using a Vision Spinner II battery with variable voltage from 3.3 to 4.8 V as the power source. The puffing protocol consisted of 5 s duration puffs at 600 mL min−1 (puff volume 50 mL) and interpuff periods of 25 s. Each puffing cycle included a total of 50 individual puffs, performed over a 25 min period.14,22 Peristaltic pumps were used to draw air from the devices at preset flow rates. In each experiment, samples for analysis of VOCs and volatile carbonyls present in mainstream vapor were collected simultaneously at 70 and 200 mL min−1, respectively. An additional pump operated at 330 mL min−1to adjust the total puff flow to 600 mL min−1. DNPH cartridges were used to collect volatile carbonyl samples from 1−5 puffs at different
stages of each experiment. The cartridges were extracted and analyzed as described above. VOC emissions were collected from one or two puffs at regular times onto Carbopack sorbent tubes and quantified by TD-GC/MS as described above. Emission factors were calculated as the ratio of the mass of each compound emitted to the mass change of the e-liquid per puff. The average mass change per puff in each experiment was between 5 and 8 mg.
A separate experiment was carried out to validate the proposed reaction pathways using a solution containing 10μL of glycidol dissolved in 1.4 mL of PG in the EGO vaporizer with the battery at 3.8 V, following the protocols described above.
■
RESULTS AND DISCUSSIONE-Liquid Composition. Several volatile constituents were identified in the three e-liquids at milligram per milliliter levels, including the two solvents (PG and VG), nicotine, propylene oxide (PO, likely an impurity of propylene glycol), ethanol (additive and/or flavoring solvent), and acetol (hydroxyace-tone, a PG decomposition byproduct). In general, incubation at different temperatures did not affect the results. The fact that PO and acetol were found in the headspace at similar concentrations after incubation at different temperatures in the range of 80−280 °C indicates that they were originally present in the liquid, rather than formed during the incubation process at high temperatures. This was further confirmed with an additional GC/MS test in which the diluted e-liquid was directly injected onto a cold injector (40 °C). Comparable levels were observed, thus confirming that PO and acetol were present in the e-liquid, and not generated during HS incubation.Table 2summarizes the concentrations of each of Table 1. Vaporizers and E-Liquids Used in This Studya
Vaporizers ID manufacturer model number of coils coil resistance (Ω) EGO eGO CE4 (version 2) 1 2.6 AERO Kangertech Aerotank Mini 2 2.0
E-Liquids ID brand type nominal PG/ VG ratio (%) nominal nicotine content (mg mL−1) CT Apollo classic tobacco 50/50 18 BUB Drip bubblicious NA 24 MOJ Drip mojito mix NA 18
aPG = propylene glycol, VG = vegetable glycerin, and NA =
information not available.
Table 2. Analysis of E-Liquid Composition by HS-GC/MS with Incubation at 200°Ca Common Constituents compound CT (mg mL−1(%)) BUB (mg mL−1(%)) MOJ (mg mL−1(%)) PG 531 (45.5) 441 (37.8) 472 (39.5) VG 470 (40.2) 414 (35.4) 435 (36.4) nicotine 20.4 (1.74) 25.4 (2.17) 32.1 (2.68) ethanol 135 (11.6) 234 (20.0) 245 (20.5) propylene oxide 4.2 (0.36) 5.5 (0.47) 6.7 (0.56) acetol 5.8 (0.50) 7.7 (0.66) 4.1 (0.34) Flavorings
compound CT BUB MOJ vanillin X ND ND α-isomethylionone ND X ND α-irone ND X ND trans-β-ionone ND X ND 3-hexene-1-ol ND X X isopentyl alcohol ND X X 1-pentanol ND X ND benzyl alcohol ND X ND D-carvone ND ND X linalool ND ND X eucalyptol ND ND X α-terpineol ND ND X acetic acid ND ND X
aPG = propylene glycol, VG = vegetable glycerin, X = detected, and
ND = not detected.
these compounds determined by HS-GC/MS with incubation at 200°C, and lists flavorings present in smaller amounts. Since the incubation temperatures used in this study were comparable to those reported near the heated coil,10these compounds were likely present in the vapor generated by e-cigarettes at significant levels. The higher relative concentration of ethanol in BUB and MOJ with respect to CT is likely associated with the presence of a large number offlavorings in those products, assuming that ethanol was the solvent for the raw materials used in the formulation of the additives. This is also consistent with the relatively lower viscosity of these two e-liquids compared to CT. The presence of PO in all three e-liquids at approximately 1% of the PG concentration suggests that PO was an impurity of the PG used to formulate these products, and thus, PO will likely be present in most e-liquids on the market. This possibility is of particular concern because PO is listed by the WHO/IARC as a group 2B possible carcinogen,27 by the U.S. EPA as a group B2 probable carcinogen,28and as a known carcinogen under California Proposition 65.29 In addition, PO is considered a respiratory and eye irritant.28,30
Table 2also lists compounds (mostlyflavorings) identified at lower levels in the headspace of e-liquids. The only flavor detected in CT was vanillin, while BUB had primarily ketones and alcohols, and terpenoids were the main class offlavorings found in MOJ.
Figure S3 (Supporting Information) illustrates the concen-trations of several VOCs and aldehydes from the analysis of e-liquids carried out by TD-GC/MS and DNPH derivatization, respectively. Two of the common constituents listed inTable 2
(acetol and nicotine) were quantified in the three e-liquids along with nicotyrine (an alkaloid derived from nicotine), and their levels were comparable to those measured by the headspace method. The carbonyl-specific analysis found trace levels (ng mL−1) of formaldehyde, acetaldehyde, and acetone in the three e-liquids, and only one product (CT) contained a small amount of acrolein. These carbonyl concentrations were negligible compared with levels of the same compounds measured in the vapor, as described below.
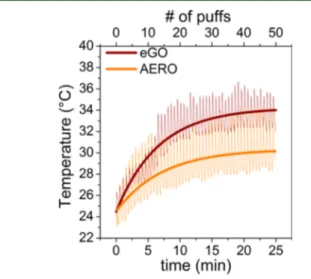
Vapor Temperature and Puffing Regime. The temper-ature profiles for each device operating at 3.8 V are shown in
Figure 1. Vapor temperatures measured for the EGO vaporizer were consistently higher than those recorded with the AERO
system, reaching maximum average temperatures of 34 and 30 °C, respectively. In both devices, the vapor temperature increased quickly over the initial 5−10 min, corresponding to thefirst 20 puffs, and then approached steady state. Emissions were analyzed at two different times corresponding to different sections of the temperature profiles: initial conditions (cooler vapor) during the first 5 puffs, and steady-state conditions (warmer vapor) for puffs taken between the 30th and 40th puffs. Results from these sections are labeled “initial” and “steady-state”, respectively.
Emissions of Vapor Constituents. The emission factors of several vapor constituents, expressed in nanograms of compound emitted per milligram of e-liquid consumed, were determined by quantifying the content of 1−5 puffs collected onto DNPH cartridges and VOC sorbent tubes, in experiments carried out using the CT e-liquid with both vaporizers operating at a battery voltage of 3.8 V. Additional experiments were carried out at 4.8 V using all three e-liquids. A summary of the results corresponding to 31 compounds is presented in Table S1 (Supporting Information). The experimental uncertainty was assessed by performing duplicate determi-nations in a subset of tests. Aldehyde concentrations were determined with a precision better than 10% in most cases for the EGO device operating at 3.8 V or higher settings. However, lower concentrations measured at the lowest setting of 3.3 V had significantly higher errors. VOCs collected on sorbent tubes were determined with a precision equal to or better than 17%. Table S2 (Supporting Information) summarizes the results from duplicate determinations.
Figure 2illustrates initial and steady-state emission factors for the most abundant compounds in the vapor when the CT e-liquid was used in both devices at 3.8 V. Several harmful and potentially harmful compounds were detected, including glycidol, a compound that has not been previously reported in the vapor of e-cigarettes. Glycidol is listed by WHO/IARC as a group 2A probable carcinogen, by the U.S. EPA as a group A anticipated carcinogen, and by the State of California Proposition 65 as a compound known to cause cancer. Other compounds of concern detected at significant levels include acrolein (a severe respiratory and eye irritant, with a very low reference exposure level) and formaldehyde and acetaldehyde (both of which are listed by WHO/IARC as group 2B possibly carcinogens, by the U.S. EPA as group B2 probable carcinogens, and by the State of California Proposition 65). These aldehydes also have low reference exposure levels for respiratory and eye irritation. Emission rates of these aldehydes largely exceedby 3 orders of magnitudethose correspond-ing to evaporation of trace levels present in the e-liquid, suggesting that emissions are the consequence of thermal decomposition of other constituents taking place during the vaping process. In addition to these compounds, diacetyl (2,3-butanedione) has been associated with lung disease.31The TD-GC/MS method was not suitable for the detection of PO, likely due to decomposition in the thermal desorption unit. However, since this compound was present in all three e-liquids at relatively high levels (as determined by HS-GC/MS), it is likely that this compound is also present in the vapor. Partial or complete PO decomposition during vaping is also possible.
As shown inFigure 2, emission rates were significantly higher
for steady-state conditions than for initial conditions, related to higher coil and vapor temperatures. Emissions from the EGO device were significantly higher than those observed for the AERO vaporizer, likely due to the higher temperatures reached
Figure 1.Profiles of the vapor temperature using the EGO and AERO vaporizers at 3.8 V.
Environmental Science & Technology Article
DOI:10.1021/acs.est.6b01741
Environ. Sci. Technol. 2016, 50, 9644−9651
on the single-coil device. Some of these harmful compounds could only be detected using the EGO device, but not the AERO vaporizer. The results inFigure 2are presented in terms of mass of compound emitted per unit mass of e-liquid consumed. The same data are presented in Figure S4 (Supporting Information) in units of mass of compound emitted per puff.
The emissions from the three e-liquids were compared on the EGO device operated at 4.8 V. The same compounds emitted at 3.8 V were released at higher rates when the vaporizer operated at 4.8 V, as expected for more extreme heating conditions. In addition, other compounds that were not detected at 3.8 V were present at the higher voltage (e.g., methyl glyoxal, as shown inTable S1). The results for the EGO device operating at 4.8 V at steady state are summarized in Figure S5 (Supporting Information). Overall, only small variations in emission factors were observed across the three e-liquids, suggesting that the main source of these chemicals was the thermal decomposition of the solvents. Emissions of formaldehyde and acetaldehyde were of the same order of magnitude as those of nicotine. These were the three most prevalent species in the vapor.
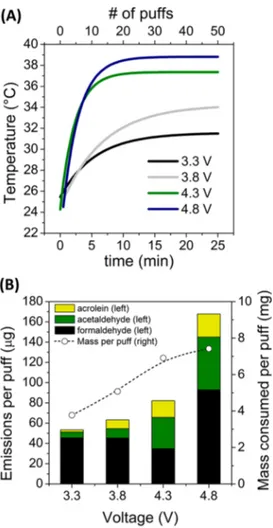
Effects of Voltage on Aldehyde Emissions. The effects of the voltage output on aldehyde emissions were systematically investigated using the EGO devicefilled with the CT e-liquid. The key results are summarized in Figure 3. As the battery power output increased, the mean vapor temperature reached at steady state was higher, as shown inFigure 3A. The average mass of e-liquid consumed per puff increased from 3.7 to 7.5 mg over the range of 3.3−4.8 V; however, the total emissions of volatile aldehydes increased by a factor of 3, as shown inFigure 3B. The amount of liquid consumed per puff increased practically linearly between 3.3 and 4.3 V and remained almost constant for an additional voltage increase to 4.8 V. Aldehyde
emissions also increased linearly between 3.3 and 4.3 V, but the changes fit an exponential curve when 4.8 V was included, consistent with previously reported results for formaldehyde, acetaldehyde, and acetone.18Ourfindings suggest that most of the additional energy provided by increasing the voltage in the range of 3.3−4.3 V was used primarily to evaporate larger amounts of e-liquid, but further voltage increases to 4.8 V led to a marginally higher amount of evaporation combined with greatly enhanced decomposition of the main e-liquid constituents. The amount of acrolein formed at the maximum voltage was an order of magnitude higher than that formed at the lowest voltage. These observations are consistent with the hypothesis that these compounds were formed as byproducts of the thermal decomposition of the e-liquid main constituents, a process that is extremely sensitive to thermal conditions at the coil. If the evaporation was rate-limited by mass transfer and/or the device geometry, the added energy at 4.8 V would be available for reactions that generate aldehydes.
Higher Emissions Due to Device aging. The results described above were generated using a different device of the same type in each experiment, to ensure that the results were not affected by nonreproducible phenomena associated with aging. In a separate experiment, a single device was used repeatedly at 4.8 V over nine consecutive 50 puff cycles. This test allowed for examination of changes in the emissions associated exclusively with device aging (without cleaning) under conditions that may be commonly used by many vapers. The results, presented inFigure 4, indicate that total aldehyde emissions increased by more than 60%, with greater contributions of formaldehyde, acetaldehyde, and acrolein. This effect is consistent with the buildup of polymerization byproducts on or near the coil, leading to accumulation of the sort of residues that are often referred to in the blogosphere as “coil gunk” or “caramelization”. Heating these residues would
Figure 2.Emission factors for two vaporizersfilled with CT e-liquid and operated at 3.8 V during (A) initial puffing and (B) steady-state conditions.
provide a secondary source of volatile aldehydes. Because the temperature profiles for cycles 1 and 9 were identical, the observed increased emissions were not due to changes in heating patterns, but rather to chemical processes taking place inside the device.
Postulated Pathways for the Thermal Decomposition of E-Liquid Constituents. To explore the hypothesis that harmful emissions originate from thermolysis of the main
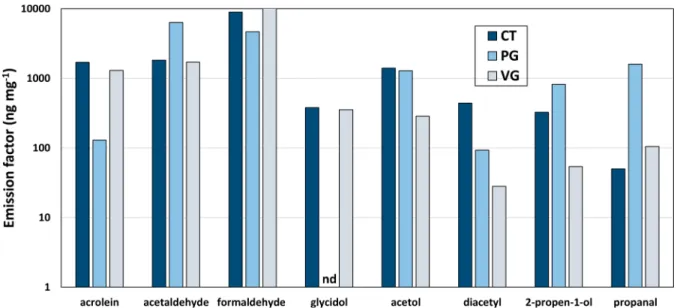
e-liquid constituents, additional experiments were carried out using neat PG and glycerin instead of the e-liquid, and measuring emission factors for the VOCs and aldehydes identified earlier in the study. These experiments were carried out with the EGO device at 3.8 V.Figure 5shows the results, compared with the corresponding data from the CT e-liquid. Certain compounds, such as acetol and 2-propen-1-ol, were produced primarily by PG degradation, but not by glycerin. Similarly, glycidol and acrolein were mostly generated by glycerin degradation, but glycidol was not among the PG decomposition products. Other compounds (e.g., formalde-hyde) originated from the degradation of both compounds.
Figure 6 presents plausible mechanisms for thermal degradation of PG and glycerin. Acrolein and glycidol can be formed by dehydration of glycerin; acetaldehyde and 2-propen-1-ol (allyl alcohol) are primarily byproducts of PG degradation. These reactions are consistent with those described in the literature for thermal degradation of PG and glycerin.32,33
The right side ofFigure 6 shows the proposed pathway for glycerin decomposition. Acrolein can be formed directly by dehydration of glycerin, and glycidol may be formed as an intermediate in this process. An additional experiment was performed to test this hypothesis by using a solution of 5% glycidol in PG as the e-liquid. This strategy could ascertain whether glycidol decomposition could influence acrolein emissions in VG. This is a viable approach because glycidol is not a product of thermal degradation of PG, and PG decomposition yields about 100 times less acrolein than VG. The results presented in Table S3 (Supporting Information) show a 4-fold increase in acrolein emissions for the 5% glycidol solution with respect to neat PG, lending support to the proposed mechanism.
Implications. Chemical analysis of e-liquids and vapors emitted by e-cigarettes led to the identification of several compounds of concern due to their potentially harmful effects on users and passively exposed nonusers. These chemical emissions are associated with both cancer and noncancer health impacts that will be quantitatively evaluated in an ensuing paper. In addition to aldehydes and other VOCs that have been reported previously, this study provides thefirst report of the presence of propylene oxide in e-liquids, and of glycidol in the vapors. Both compounds are considered possible or probable carcinogens. Various design and operating parameters have significant effects on emission levels of toxic compounds, including the choice of the vaporizer and the battery power output, both of which determine the coil and vapor temperatures. Since harmful chemical emissions are primarily due to thermal decomposition of e-liquid constituents, reducing these temperatures is a promising approach to limiting the harm caused by e-cigarettes. Proper maintenance or more frequent replacement of coils may also reduce emissions by avoiding accumulation of polymeric residues. From the regulatory point of view, particularly in light of recent U.S. FDA regulations issued in May 201634 and European Union regulations from 2014,35 it should be highlighted that toxic emissions originate primarily from heating the solvents propylene glycol and glycerin, which are the constituents most commonly found in e-liquid formulations. Thus, potentially harmful chemicals are expected to be present in the vapor regardless of limits imposed to individual additives and/orflavorings.
Figure 3. Effects of the voltage on e-cigarette performance and emission of aldehydes: (A) mean vapor temperature for voltages from 3.3 to 4.8 V (the smoothed curves do not show interpuff fluctuations); (B) aldehyde emissions and mass of e-liquid consumed per puff.
Figure 4.Effect of device aging on aldehyde emissions for an EGO vaporizer operated at 4.8 V with CT liquid.
Environmental Science & Technology Article
DOI:10.1021/acs.est.6b01741
Environ. Sci. Technol. 2016, 50, 9644−9651
■
ASSOCIATED CONTENT*
S Supporting InformationThe Supporting Information is available free of charge on the
ACS Publications websiteat DOI:10.1021/acs.est.6b01741. Schematic descriptions of the vaporizers used in this study and the vaping machine, trace constituents in e-liquids, emission factors of analytes found in mainstream vapor, mass of e-liquid consumed per puff, analyte concentrations in vapor, and emission factors for experiments using both devices and the CT e-liquid, for the three e-liquids consumed in the EGO clearomizer, and for analytes found in mainstream vapor (PDF)
■
AUTHOR INFORMATIONCorresponding Author
*E-mail:[email protected]; phone: (510) 486-5897.
Notes
The authors declare no competingfinancial interest.
■
ACKNOWLEDGMENTSThis research was funded by the University of California Tobacco-Related Disease Research Program (TRDRP) (Grant 23XT-0005). Lawrence Berkeley National Laboratory (LBNL) is operated under U.S. Department of Energy Contract DE-AC02-05CH11231. V.N.M. and M.I.L. also acknowledge CONICET for a postdoctoral fellowship and Grant PIP-CONICET 11220110100467 and the Agencia Nacional de Promoción Cienti ́fica y Tecnológica (Grant PICT-0463). We are grateful to Troy Cados for experimental assistance, and to anonymous reviewers for their helpful suggestions. The authors thank Ximena Larrea for the photograph featured on the cover.
■
REFERENCES(1) Gostin, L. O.; Glasner, A. Y. E-cigarettes, vaping, and youth. JAMA 2014, 312, 595−596.
(2) McNeill, A.; Brose, L. S.; Calder, R.; Hitchman, S. C.; Hajek, P.; McRobbie, H. E-Cigarettes: An Evidence Update. A Report Commissioned by Public Health England; Public Health England: London, 2015;
https://www.gov.uk/government/publications/e-cigarettes-an-evidence-update.
Figure 5.VOC and volatile carbonyl emission factors for the CT e-liquid, neat propylene glycol (PG), and neat vegetable glycerin (VG) under comparable steady-state operation conditions using an EGO vaporizer at 3.8 V (nd = not detected).
Figure 6.Postulated pathways and byproducts formed during thermal dehydration of propylene glycol and glycerin.
(3) Grana, R.; Benowitz, N.; Glantz, S. E-cigarettes: a scientific review. Circulation 2014, 129 (19), 1972−1986.
(4) Etter, J.-F. E-Cigarettes: methodological and ideological issues and research priorities. BMC Med. 2015, 13, 32.
(5) Leventhal, A. M.; Strong, D. R.; Kirkpatrick, M. G.; Unger, J. B.; Sussman, S.; Riggs, N. R.; Stone, M. D.; Khoddam, R.; Samet, J. M.; Audrain-McGovern, J. Association of electronic cigarette use with initiation of combustible tobacco product smoking in early adolescence. JAMA 2015, 314 (7), 700−707.
(6) Wieslander, G.; Norback, D.; Lindgren, T. Experimental exposure to propylene glycol mist in aviation emergency training: acute ocular and respiratory effects. Occup. Environ. Med. 2001, 58, 649−655.
(7) Geiss, O.; Bianchi, I.; Barahona, F.; Barrero-Moreno, J. Characterization of mainstream and passive vapours emitted by selected electronic cigarettes. Int. J. Hyg. Environ. Health 2015, 218, 169−180.
(8) Fuoco, F. C.; Buonanno, G.; Stabile, L.; Vigo, P. Influential parameters on particle concentration and size distribution in the mainstream of e-cigarettes. Environ. Pollut. 2014, 184, 523−529.
(9) Schober, W.; Szendrei, K.; Matzen, W.; Osiander-Fuchs, H.; Heitmann, D.; Schettgen, T.; Jorres, R. A.; Fromme, H. Use of electronic cigarettes (e-cigarettes) impairs indoor air quality and increases FeNO levels of e-cigarette consumers. Int. J. Hyg. Environ. Health 2014, 217, 628−637.
(10) Schripp, D.; Markewitz, D.; Uhde, E.; Salthammer, T. Does e-cigarette consumption cause passive vaping? Indoor Air 2013, 23, 25− 31.
(11) Lerner, C. A.; Sundar, I. K.; Yao, H.; Gerloff, J.; Ossip, D. J.; McIntosh, S.; Robinson, R.; Rahman, I. Vapors produced by electronic cigarettes and e-juices with flavoring induce toxicity, oxidative stress, and inflammatory response in lung epithelial cells and in mouse lung. PLoS One 2015, 10 (2), e0116732.
(12) Behar, R. Z.; Davis, B.; Wang, Y.; Bahl, V.; Lin, S.; Talbot, P. Identification of toxicants in cinnamon-flavored electronic cigarette refill fluids. Toxicol. In Vitro 2014, 28, 198−208.
(13) Bekki, K.; Uchiyama, S.; Ohta, K.; Inaba, Y.; Nakagome, H.; Kunugita, N. Carbonyl compounds generated from electronic cigarettes. Int. J. Environ. Res. Public Health 2014, 11, 11192−11200.
(14) Farsalinos, K. E.; Voudris, V.; Poulas, K. E-cigarettes generate high levels of aldehydes only in″dry puff″ conditions. Addiction 2015, 110 (8), 1352−1356.
(15) Goniewicz, M. L.; Knysak, J.; Gawron, M.; Kosmider, L.; Sobczak, A.; Kurek, J.; Prokopowicz, A.; Jablonska-Czapla, M.; Rosik-Dulewska, C.; Havel, C.; Jacob, P., 3rd; Benowitz, N. Levels of selected carcinogens and toxicants in vapour from electronic cigarettes. Tob Control 2014, 23 (2), 133−139.
(16) Jensen, R. P.; Luo, W.; Pankow, J. F.; Strongin, R. M.; Peyton, D. H. Hidden formaldehyde in e-cigarette aerosol. N. Engl. J. Med. 2015, 372 (4), 392−394.
(17) Uchiyama, S.; Ohta, K.; Inaba, Y.; Kunugita, N. Determination of carbonyl compounds generated from the e-cigarette using coupled silica cartridges impregnated with hydroquinone and 2,4-dinitrophe-nylhydrazine, followed by high-performance liquid chromatography. Anal. Sci. 2013, 29, 1219−1222.
(18) Kosmider, L.; Sobczak, A.; Fik, M.; Knysak, J.; Zaciera, M.; Kurek, J.; Goniewicz, M. L. Carbonyl compounds in electronic cigarette vapors: Effect of nicotine solvent and battery output voltage. Nicotine Tob. Res. 2014, 16 (10), 1319−1326.
(19) Ohta, K.; Uchiyama, S.; Inaba, Y.; Nakagome, H.; Kunugita, N. Determination of carbonyl compounds generated from the electronic cigarette using coupled silica cartridges impregnated with hydro-quinone and 2,4-dinitrophenylhydrazine. Bunseki Kagaku 2011, 60 (10), 791−797.
(20) Behar, R. Z.; Hua, M.; Talbot, P. Puffing topography and nicotine intake of electronic cigarette users. PLoS One 2015, 10 (2), e0117222.
(21) Evans, S. E.; Hoffman, A. C. Electronic cigarettes: abuse liability, topography and subjective effects. Tob Control 2014, 23 (Suppl. 2), ii23−ii29.
(22) Farsalinos, K. E.; Romagna, G.; Tsiapras, D.; Kyrzopoulos, S.; Voudris, V. Evaluation of electronic cigarette use (vaping) topography and estimation of liquid consumption: implications for research protocol standard definition and for public health authorities’ regulation. Int. J. Environ. Res. Public Health 2013, 10, 2500−2514.
(23) Hua, M.; Yip, H.; Talbot, P. Mining data on usage of electronic nicotine delivery systems (ENDS) from You Tube videos. Tob Control 2013, 22, 103−106.
(24) Dawkins, L.; Turner, J.; Roberts, A.; Soar, K.″Vaping″ profiles and preferences: an online survey of electronic cigarette users. Addiction 2013, 108, 1115−1125.
(25) U.S. EPA. Compendium Method TO-11ADetermination of Formaldehyde in Ambient Air Using Adsorbent Cartridge Followed by HPLC [Active Sampling Methodology]; Office of Research and Development, U.S. Environmental Protection Agency (U.S. EPA): Cincinnati, OH, 1999.
(26) U.S. EPA. Method TO-1, Revision 1,0: Method for the Determination of Volatile Organic Compounds in Ambient Air Using Tenax® Adsorption and Gas Chromatography/Mass Spectrometry (GC/ MS); Center for Environmental Research Information, Office of Research and Development, U.S. Environmental Protection Agency (U.S. EPA): Cincinnati, OH, 1984.
(27) IARC. IARC Monographs on the Evaluation of Carcinogenic Risks to Humans. Vol. 60: Some Industrial Chemicals; International Agency for Research on Cancer (IARC), World Health Organization (WHO): Lyon, France, 1994.
(28) U.S. Environmental Protection Agency (U.S. EPA). Propylene Oxide Hazard Summary, 2000.http://www3.epa.gov/airtoxics/hlthef/ prop-oxi.html.
(29) California Office of Environmental Health Hazard Assessment (OEHHA). Proposition 65 List of Chemicals, 2015.http://oehha.ca. gov/prop65/prop65_list/Newlist.html.
(30) California Office of Environmental Health Hazard Assessment (OEHHA). Air Toxicology and Epidemiology, 2013.http://oehha.ca. gov/air/allrels.html.
(31) Harber, P.; Saechao, K.; Boomus, C. Diacetyl-induced lung disease. Toxicol. Rev. 2006, 25 (4), 261−272.
(32) Laino, T.; Tuma, C.; Curioni, A.; Jochnowitz, E.; Stolz, S. A revisited picture of the mechanism of glycerol dehydration. J. Phys. Chem. A 2011, 115, 3592−3595.
(33) Laino, T.; Tuma, C.; Moor, P.; Martin, E.; Stolz, S.; Curioni, A. Mechanisms of propylene glycol and triacetin pyrolysis. J. Phys. Chem. A 2012, 116, 4602−4609.
(34) FDA. Final Rule. US Food and Drug Administration (FDA): Deeming Tobacco Products To Be Subject to the Federal Food, Drug and Cosmetics Act, as Amended by the Family Smoking Prevention and Tobacco Control Act; Restrictions on the Sale and Distribution of Tobacco Products and Required Warning Statements for Tobacco Products. Fed. Regist. 2016,https://federalregister.gov/a/2016-10685. (35) European Union (EU) Parliament and the Council of the European Union. Directive 2014/40/EU of the European Parliament and of the Council of 3 April 2014 on the Approximation of the Laws, Regulations and Administrative Provisions of the Member States Concerning the Manufacture, Presentation and Sale of Tobacco and Related Products and Repealing Directive 2001/37/EC, 2014.http:// ec.europa.eu/health/tobacco/products/revision/index_en.htm.
Environmental Science & Technology Article
DOI:10.1021/acs.est.6b01741
Environ. Sci. Technol. 2016, 50, 9644−9651