COMMENTARY
:—response relaMomsMp and low dose extrapolation in chemical
carcinogenesis
Werner K.Lutz
Institute of Toxicology, Swiss Federal Institute of Technology and University of Zurich, CH-8603 Schwerzenbach, Switzerland
Data supporting various dose-response relationships in chemical carcinogenesis are summarized. General principles are derived to explain the relationships between exposure dose, DNA adduct level, induction of genetic changes, and tumor incidence. Some mechanistic aspects of epigenetic carcinogens (stimulation of cell division and maldifferentia-tion) are analyzed in a similar way. In a homogeneous popula-tion, non-linearities are frequent. They are due to phenomena of induction or saturation of enzymatic activities and to the multi-step nature of carcinogenesis: if a carcinogen accelerates more than one step, the superposition of the dose—response curves for the individual steps can result in an exponential relationship. A fourth power of the dose was the maximum seen in animals (formaldehyde). At the lowest dose levels, a proportionality between dose and tumor induction is postulated independent of the mechanism of action if the carcinogen accelerates the endogenous process responsible for spontaneous tumor formation. Low-dose thresholds are expected only for situations where the carcinogen acts in a way that has no endogenous counterpart. Epidemiological studies in humans show linear dose-response curves in all but two investigations. The difference from the strongly non-linear slopes seen in animal studies could be due to the heterogeneity of the human population: if the individual sensitivity to a carcinogen is governed by a large number of genetic and life-style factors, the non-linearities will tend to cancel each other out and the dose-response curve becomes 'quasi-linear'.
Introduction
The problem of low-dose extrapolation
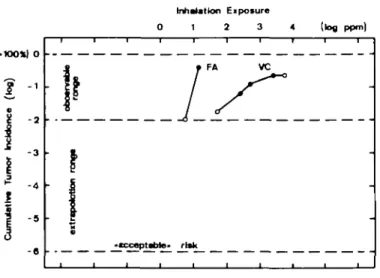
Whenever a chemical to which humans can be exposed has been found to be carcinogenic in animals, the question arises as to an acceptable dose level. In view of a tumor incidence of 30-40% in humans (cumulative for a 75-year life span in white females and males respectively), an increase by one additional tumor in a million exposed is often considered a 'virtually safe' dose. Since an increase of the tumor incidence in an animal bioassay must be of the order of at least a few per cent to become statistically significant, four to five orders of magnitude have to be spanned by extrapolation (Figure 1).
In this 'commentary', different mechanisms of carcinogenic action will be discussed with respect to the shape of the dose — response curve. Special emphasis will be given to the aspect of linear versus non-linear relationships and to the possibilities of thresholds, i.e. true no-effect doses (1). Non-linearities strongly affect the estimation of 'virtually safe' dose levels: if a linear extrapolation from a high-dose point to dose zero is made in a sublinear situation, the risk from exposure to low doses is
overestimated, and vice versa (see Figure 2, top chart, for definitions).
The only variable discussed will be the dose. It would be beyond the scope of this analysis to introduce aspects of time or latency and dose-dependent shifts of target organs. Further-more, chronic exposure and a fixed period of observation will be assumed.
The multi-stage genetic nature of carcinogenesis
The incidence of a number of human cancers rises sharply with age. For stomach and lung, for instance, age-specific tumor incidence rates increase exponentially with age, with exponents of 4—7 for ages between 30 and 65 years. This time —incidence curve is in line with a multi-step process for carcinogenesis requiring 4—7 independent 'events' (2). Because of the heritable nature of cancer, these 'events' are most probably genetic changes. Tumor development in the human colon, for example, appears to require more than one type of genetic change for malignant transformation. These include hypomethylation, gene mutations, recombinations and chromosomal aberrations (3). Some of these changes represent true DNA damage, while others are constitutive processes regulating gene expression. For both aspects, experimental evidence and theoretical considerations will be discussed as far as they affect the dose-response relationships.
Dose response for genotoxk carcinogens
DNA adduct formation as a function of dose
The formation of covalent DNA-carcinogen adducts is a common activity of a large number of chemical carcinogens, including the majority of the known organic human carcinogens. The formation of DNA adducts has been used as a quantitative indicator of carcinogenicity of genotoxic compounds in animals (4).
The data on dose —response relationships have been reviewed before (5 — 7). It emerged that in the lowest dose range the rate of all processes is proportional to the concentration of substrate, generating a linear dose —response curve (Figure 2, top chart). At higher concentrations, many possibilities for non-linearities become apparent (7). These include the saturation or induction of enzymes involved in either metabolic activation and inactiva-tion of the substrate or in DNA repair (Figure 2, top chart). The sublinear dose - response relationships observed with form-aldehyde (7) (saturation of the inactivation with glutathione) and methylating agents (6) (saturation of (Amethylguanine repair) or the superlinear shapes seen with vinyl chloride (Figure 1) and aflatoxin B| (6) (saturation of the activation pathway) or with the tobacco-specific nitroso compound NNK (7) ('dangerous' low-AfM pathway leading to adducts) can all be explained on this basis.
Metabolic activation and inactivation
The enzymatic activation of carcinogens to the ultimate electro-philic metabolite and its detoxification could be modeled mathematically, if the kinetics of all enzymatic and non-enzymatic processes were known (8). With more kinetic parameters
becom-W.K.Lutz
' DNA ADDUCTS
Fig. 1. Dose-response relationship for tumor induction by formaldehyde (FA) and vinyl chloride (VC), snowing ranges of experimental observation and extrapolation. Note: In the double-log plot chosen, proportionality between dose and incidence generates a line of 45° angle (slope = 1; lower part for VC). Higher slopes (slope ~ 4 for FA) indicate an exponential behavior.
ing available in both animals and humans, this type of pharmaco-kinetic modeling might become a valuable tool, especially for comparisons among different animal species (9) and for the prediction of dose-response relationships.
In contrast to the above models based on enzyme kinetics, Cornfield (10) has presented a theoretical concept that is often over-interpreted to state that enzymatic activation and inactivation pathways can generate a true no-effect level. This is not the case. The model produces a thresholded dose—response curve (shaped like a hockey stick) under the assumption of an irreversible protection reaction with indefinitely high rate. This implies that the rate of DNA binding is zero as long as 'toxin-deactivator' is available. This situation is unrealistic for competitive enzymatic and chemical reactions.
Genetic changes as a function of DNA adduct levels
DNA adducts alone are not sufficient to generate heritable genetic changes because adducts themselves are not copied onto the progeny DNA strands. DNA replication can, however, lead to mutations in the new strand opposite an adduct. If this occurs in a critical gene, the daughter cell could form the origin of a transformed cell clone. Since DNA adducts can be repaired (with varying efficiency), the probability of a DNA adduct becoming fixed as a genetic change is dependent on the relative rates of DNA repair and cell division. Any process that accelerates the rate of cell division will therefore have a synergistic effect on the formation of mutations (and tumor incidence).
High levels of DNA adducts can lead to cell death and regenerative hyperplasia in the surrounding tissue. The acceler-ated cell division in the surviving cells can result in an increased probability of genetic changes due to its own adducts. The higher rate of fixing the DNA damage in the form of a mutation will result in a sublinear shape of the dose —response curve in the cytotoxic dose range (Figure 2, middle chart). Below cytotoxic doses, the shape of the dose-response curve is governed by the level of the DNA damage alone and can be linear.
A nice example for such a linear — sublinear shape can be given for the induction of liver tumors in female rats by nitroso-diethylamine. In this study (11), nitrosodiethylamine was
SUPER LINEAR Saturation ol activation Induction of Inactivation Induction of DNA repair
SUBLINEAR LINEAR
Induction of activation Saturation ot Inactivation Saturation of DNA repair
CARCINOGEN DOSE
h CBCTCCHANGES
Stimulation of DNA replication (regenerative cell division;
cell differentiation) DNA ADDUCTS TUMOR INCIDENCE p (genetic change a) p (genttlc change b) DNA ADDUCTS
Fig. 2. Schematic representation of the dose-effect relationship for three consecutive aspects of tumor induction by genotoxic agents.
administered in the drinking water to groups of 60 rats at 15 dose levels (0.033-16.9 p.p.m.). When the ratio observed/expected liver cancer incidence is plotted as a function of dose, a quadratic to cubic shape is seen. However, if only die low-dose data are taken (up to 0.5 p.p.m.), the increase in tumor response appears to be linear with dose and less rapid than the curve fitted to all data points (12). This large experiment, using > 1000 animals, afforded a unique opportunity to detect linearity at low dose levels and a power of the dose in the high-dose range, and is a good example to stress the idea that mode of action and potency of a carcinogen can change with the dose level.
The highest dose level used in a standard bioassay on carcino-genicity is normally chosen as the maximum tolerated dose that is expected to produce slight signs of toxicity (13). In view of the importance of sustained hyperplasia in carcinogenesis, a sublinear dose—response relationship even with genotoxic carcinogens is no longer surprising.
Superposition of the dose—response curves for two genetic changes
As a consequence of the multi-stage nature of carcinogenesis, the probability, P, of cancer induction can be approximated by the product of the probabilities for the various steps (2). Since all steps must have a genetic basis to become heritable, DNA-damaging compounds can accelerate more than one step. The dose—response relationship then appears as a product of the curves for the individual steps. If, for instance, two events are affected, both proportionally with the level of DNA adducts, the product of the lines will be exponential (Figure 2, bottom chart). 1244
Summary for genotoxic carcinogens
The formation of DNA adducts is proportional to dose as long as the concentrations of the carcinogen and of its proximate and ultimate form(s) are below the KM values of the enzymes involved. At higher dose levels, saturation and induction of enzymatic processes often generate non-linear shapes. In addition, the correlation of the level of DNA adducts with the rate of genetic changes shows a non-linearity as soon as regenerative hyperplasia accelerates the fixation of the DNA lesion in the form of a mutation. Finally, an exponential relationship between DNA adduct level and tumor incidence is expected if the DNA adducts accelerate more than one step of the process of carcinogenesis. The three aspects are combined in Figure 2, which illustrates that non-linear parts in the dose —response relationships are the rule rather than the exception for genotoxic carcinogens.
Dose response for epigenetic carcinogens
Definitions
A cancer cell expresses genes that allow autonomous and invasive growth. From a cellular point of view, a cancer cell is a very healthy one. Its various functions can all be useful at some time and are probably expressed individually under specific conditions of differentiation. A cancer cell apparently expresses a combina-tion of these funccombina-tions at an inappropriate time. The process of malignant transformation is therefore not necessarily dependent on gene mutations but can include normal gene regulation. The process of carcinogenesis could thus be called 'epigenetic' if it involves only constitutive genes and mechanisms of expression available also to normal stem cells.
Although every effort is being made to identify the set of genes that must be turned on or off for the expression of the malignant phenorype, this goal has not yet been reached (14). Most examples given below are therefore based on the stimulation of cell division rather than of maldifferentiation.
Sustained hyperplasia appears to be a necessary (but not sufficient?) condition for tumor promotion and progression (15,16). It appears that a stem cell maximally stimulated to divide can fix this differentiation stage permanently after a certain period of time. Stimulated cell division also entails an aspect of genotoxicity because it accelerates the fixation of DNA lesions from endogenous genotoxic agents and processes (17,18). This indirect type of genotoxicity will not be considered, however, for the following discussion of the dose-response curve expected for epigenetic processes.
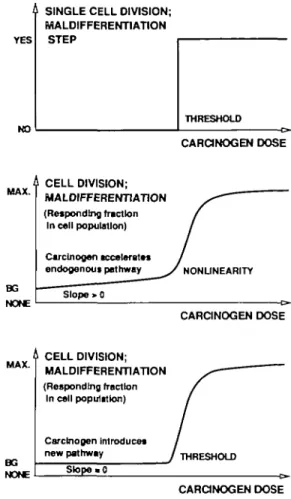
Dose response for a single cell
A cell either divides (or differentiates) or it does not. Therefore, if a chemical stimulates cell division or (mal)differentiation, the dose-response relationship can only be a 'switch' function resulting in a true thresholded curve (Figure 3, top).
Dose response in a cell population
In a cell population, individual cells will differ with respect to their sensitivity to the driving force. This smoothes the edges of the thresholded curve, if the fraction of responding cells is plotted as a function of dose. Furthermore, we can assume that a small number of cells divide or differentiate in the absence of the exogenous agent, as a result of an endogenous background process replacing unavoidably lost cells. In the lowest dose range of an exogenous carcinogen, this idea leads to two possibilities for the dose — response relationship.
Linear low-dose response. If the carcinogen acts competitively with the endogenous driving force, even a single carcinogen
YES
A SINGLE CELL DIVISION; MALDIFFERENTIATION
STEP
THRESHOLD CARCINOGEN DOSE
MAX. CELL DIVISION;
BG NONE MALDIFFERENTIATION (Responding fraction In cell population) Carcinogen tccaleratts endogenous pathway Slope > 0 NONUNEARITY CARCINOGEN DOSE
MAX. CELL DIVISION;
BG NONE MALDIFFERENTIATION (Responding fraction In call population) Carcinogen Introduces
new pathway THRESHOLD
Slope « 0
CARCINOGEN DOSE
Fig. 3. Possible shapes of dose—response curves for carcinogens that affect
the rate of cell division or maldifferentiation. Top, situation for single cell;
middle, situation with cell population and endogenous process accelerated
by carcinogen; bottom, situation with cell population and new process initiated by carcinogen.
molecule could recruit one additional cell for division or maldifferentiation (Figure 3, middle). Such a hormone-like effect of the exogenous compound would be proportional to dose in the lowest range. Tumor induction by estrogenic compounds or 2,3,7,8-tetrachlorodibenzo-/Mlioxin could fall into this category. Thresholded low-dose response. If, on the other hand, the carcinogen affects cell division and differentiation by a mechanism that has no endogenous counterpart, the dose response can even include a true no-effect level. This situation could, for example, be encountered when high concentrations of a compound in the urinary tract lead to crystal formation. If local irritation, inflammation, and regenerative hyperplasia represent the epigenetic stimulus required for an accelerated malignant transformation, no effect will be seen at all below the saturation concentration. The result is a true thresholded situation (Figure 3, bottom).
Summary for epigenetic carcinogens
The common dose—response relationship for epigenetic carcino-gens appears to be non-linear. Whether a true threshold can be postulated or whether a linear low-dose response operates, depends on the absence or presence of an endogenous activity that is competitively acted upon by the exogenous agent.
Dose response for tumor induction
The mechanistic analysis given above indicated a large number of possibilities for non-linear dose —response relationships both
W.K.Lutz
for genotoxic and epigenetic aspects of carcinogenesis, especially at high exposure levels. In this dose range, data on tumor formation in animals and humans are also available. The following paragraphs will show whether the postulated steep slopes are indeed found.
Bioassays on carcinogenicity
A comprehensive and recent review on this topic is available (12). In the observable (high) dose range used in animal studies, several examples from large, well-documented studies suggest that non-linearities are common. For instance, a sublinear curve is seen for bladder cancer caused by sodium saccharin and 2-acetyl-aminofluorene, for liver cancer induced by diethylnitrosamine and dimethylnitrosamine, and for esophageal cancer from diethyl-nitrosamine. In an extreme case, formaldehyde induced nasal tumors in rats with a frequency of 1 and 44% after inhalation exposures of 5.6 and 14.3 p.p.m. respectively (see Figure 1) (19,20). Here, the tumor incidence increased with the fourth power of the dose. In all other examples, the respective exponent was not larger than two.
If a proposed non-linearity is to be used for a low-dose risk extrapolation, the slope and range of the non-linearity must be investigated with relevant biological end-points, such as DNA adduct level, level of sustained hyperplasia and activation of oncogenes. In the absence of such information, a linear extrapol-ation of tumor incidence from the lowest reliable data point to the spontaneous rate has been proposed for all classes of carcinogens (21,22).
Epidemiological evidence in humans
In human studies, significant deviations from linearity are much more difficult to find. Only in two reports, namely lung cancer in smoking British physicians and bladder cancer from /?-naphthylamine exposure, is a sublinear fit clearly better than a linear one. The relationship in these two cases is approximately quadratic; higher exponents have not been observed (12).
The fourth power of the dose seen in an animal experiment is clearly compatible with the mechanistic analysis discussed above. Astonishing at first glance is the fact that epidemiological investigations with humans in general showed a linear dose-response relationship, or, at most, a second order for the dose. One possible reason for a systematic underestimation of the exponent of dose in human studies could be error in dose measurement. Both underestimation of the dose in the high-dose range and overestimation in the low-dose range would result in a flattening of the shape of the dose-response curve. Another explanation for the observed difference between animals and humans might be the heterogeneity of the human population. This idea will be discussed below.
Linearized dose — response relationship in a heterogeneous population
So far, carcinogenesis has been discussed mechanistically, as a process in one individual or in a relatively homogeneous animal population. The relationships between dose and effect have been analyzed as though we could repeatedly test increasing doses of the carcinogen in the same animal. The epidemiological evidence with humans, however, is based on a highly heterogeneous population. Interindividual differences in the metabolism of chemical carcinogens and in repair rates of DNA adducts, for instance, are large and reflect acquired and inherited host factors that may influence an individual's risk for development of cancer (23). As an example, genetically controlled metabolic capacities appear to affect the sensitivity of humans to develop bladder cancer (24).
1246
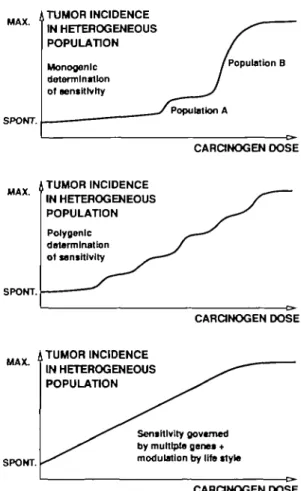
The effect of population heterogeneity on the dose — response relationship for tumor induction would follow the same rules as discussed above for the maldifferentiation of a single cell versus a cell population (Figure 3). While a completely homogeneous population of individuals would show an indefinitely steep slope at one point in the dose —response curve (in analogy to the top chart of Figure 3), heterogeneity will systematically reduce the slope.
Heterogeneity is due to both genetic and life-style factors. Under the preliminary assumption that only one genetic factor, combined with a small number of less important life-style factors, modulate the sensitivity of an individual to a chemical carcinogen, the population could be separated into a population A where a given dose leads to a tumor in almost all exposed individuals, whereas the remaining people (population B) develop a tumor only at higher dose levels (Figure 4, top). More realistic is the situation where the sensitivity is governed by a number of genes: the dose -response curve becomes flatter with each modulatory factor (Figure 4, middle). When the number of factors is increased ad infinitum, linearity results between the 'spontaneous' tumor incidence and the high-dose incidence (Figure 4, bottom). Although this situation cannot be reached in reality, the linearizing effect of population heterogeneity might be sufficiently strong to account for the fact that dose — response curves in most human epidemiological studies do not show significant deviation from linearity. MAX. ' SPOMT. TUMOR INCIDENCE IN HETEROGENEOUS POPULATION Monogenic determination of sensitivity I Population B Population A CARCINOGEN DOSE
MAX. 4 TUMOR INCIDENCE IN HETEROGENEOUS POPULATION Polygenlc determination of sensitivity SPONT. CARCINOGEN DOSE
MAX. A TUMOR INCIDENCE IN HETEROGENEOUS POPULATION
SPONT.
Sensitivity governed by multiple genes + modulation by life style
CARCINOGEN DOSE
Fig. 4. Schematic representation of dose-effect relationships in
heterogeneous populations. From top to bottom the number of genetic and life-style factors affecting the sensitivity to a chemical carcinogen increases.
Conclusions
The foregoing analysis has revealed a large number of mechanisms that generate non-linear parts in the dose-response curve in a homogeneous population. Lowest-dose linearity depends on whether an endogenous process of carcinogenesis is accelerated by the carcinogen. This holds both for genotoxic agents and epigenetic carcinogens.
In a heterogeneous population such as humans, non-linear shapes of the dose — response curve are linearized by the presence of genetic and life-style factors that affect the sensitivity for the development of cancer. The level of linearization depends on the number of modulating factors for a given carcinogen: for carcinogens forming DNA adducts by enzymatic activation, this number is probably higher than for an epigenetic carcinogen with a highly specific, hormone-like mode of action.
For risk assessment in a heterogeneous population, therefore, linear extrapolation from the high-dose incidence to the control rate has to be taken into consideration even if the mechanism of action would result in a non-linear shape of the dose—response curve in a homogeneous population.
17. Lutz,W.K. (1990) Endogenous genotoxic agents and processes as a basis of spontaneous carcinogenesis. Mulal. Res., 238, 287 — 295.
18. Saul.R.L. and Ames.B.N. (1986) Background levels of DNA damage in the population. Baric Life Sri., 38, 529-535.
19. SwenbergJ.A., Barrow.C.S., Borciko.C.J., Heck,H.A., Levine.R.J., Morgan,K.T. and Starr.T.B. (1983) Non-linear biological responses to formaldehyde and their implications for carcinogenic risk assessment. Caranogenesis, 4, 945-952.
20. Bolt.H.M. (1987) Experimental toxicology of formaldehyde. J. Cancer Res. Clin. Oncol., 113, 305-309.
21.Crump,K.S., Hoel.D.G., Langley,C.H. and Peto,R. (1976) Fundamental carcinogenic processes and their implications for low dose risk assessment. Cancer Res., 36, 2973-2979.
22. Crump.K.S. (1984) An improved procedure for low-dose carcinogenic risk assessment from animal data. J. Environ. Pathol. Toxicol. Oncol., 5, 339-348.
23. Harris,C.C. (1989) Interindividual variation among humans in carcinogen metabolism, DNA adduct formation and DNA repair. Carcinogenesis, 10, 1563-1566.
24. Kaisary.A., Smhh.P., Jaczq.E., McAllister.C.B., Wilkinson.G.R., Ray.W.A. and Branch.R.A. (1987) Genetic predisposition to bladder cancer: ability to hydroxylate debrisoquine and mephenytoin as risk factors. Cancer Res., 47, 5488-5493.
Acknowledgements
The author wishes to thank Dr Sarah E.Shephard for her advice in the writing of this commentary.
References
l.Ehling.U.H., Averbeck,D., Cerutti.P.A., Friedman,.!., Greim.H., Kolbye,A.C. and Mendelsohn,M.L. (1983) Review of the evidence of the presence or absence of thresholds in the induction of genetic effects by geno-toxic chemicals. Mutat. Res., 123, 281-341.
2. Armitage.P. (1985) Multistage models of carcinogenesis. Environ. Health Perspea., 63, 195-201.
3. Fearon.E.R., Hamilton,S.R. and Vogelstein.B. (1987) Clonal analysis of human colorectal tumors. Science, 238, 193 — 197.
4. Lutz.W.K. (1979) In vivo covalent binding of organic chemicals to DNA as a quantitative indicator in the process of chemical carcinogenesis. Mutat. Res., 65, 289-356.
5. Neumann,H.G. (1980) Dose - response relationship in the primary lesion of strong clectrophilic carcinogens. Arch. Toxicol., Suppl., 3, 69—77 6. Lutz.W.K. (1987) Quantitative evaluation of DNA-binding data in vivo for
low-dose extrapolations. Arch. Toxicol., Suppl., 11, 6 6 - 7 4 .
7 SwenbergJ.A., Richardson.F.C., BoucheronJ.A., Deal.F.H., Bclinsky.S.A., Charbonneau.M. and Short.B.G (1987) High to low dose extrapolation: critical determinants involved in the dose response of carcinogenic substances. Environ. Health Perspea., 76, 5 7 - 6 3 .
8. Anderson.M.W., Hoel.D.G. and Kaplan.N.L. (1980) A general scheme for the incorporation of pharmacokinetics in low-dose risk estimation for chemical carcinogenesis: example—vinyl chloride. Toxicol. Appl. Pharmacol., 55,
154-161.
9. Andersen.M.E,. Clewell.ni, H.J., Gargas.M.L., Smhh.F.A. and Reitz.R.H. (1987) Physiologically based pharmacokinetics and the risk assessment process for methylene chloride. Toxicol. Appl. Pharmacol., 87, 185-205. 10. ComfiekU. (1977) Carcinogenic risk assessment. Science, 198, 693-699. 11. Peto.R., Gray.R., Brantom.P. and Grasso.P. (1984) Nitrosamine carcino-genesis in 5120 rodents: chronic administration of sixteen different concen-trations of NDEA, NDMA, NPYR and NPIP in the water of 4440 inbred rats, with parallel studies on NDEA alone of the effect of age of starting and of species. IARC Scient. Publ., 57, 627-665.
12. Zeise.L., WUson.R. and Crouch.E.A.C (1987) Dose-response relationships for carcinogens: a review. Environ. Health Perspea., 73, 259-308. 13. Hoel.D.G., HasemanJ.K., Hogan.M.D., HuffJ. and McCormeU.E.E. (1988)
The impact of toxicity on carcinogenicity studies: implications for risk, assessment. Carcinogenesis, 9, 2045-2052.
14. Weinberg.R.A. (1989) Oncogenes, antioncogenes, and the molecular bases of multistep carcinogenesis. Cancer Res., 49, 3713-3721.
15.Butterworth,B.E. and Slaga,T.J. (1987) Nongenotoxic Mechanisms in Carcinogenesis, Banbury Report. Cold Spring Harbor Laboratory, Cok) Spring Harbor, NY, Vol. 25.
16. Moolgavkar.S.H. (1983) Model for human carcinogenesis: action of environmental agents. Environ. Health Perspea., 50, 285-291.