Dietary surveys indicate vitamin intakes below recommendations are
common in representative Western countries
Barbara Troesch
1*†, Birgit Hoeft
1†, Michael McBurney
2, Manfred Eggersdorfer
1and Peter Weber
1 1DSM Nutritional Products Limited, Wurmisweg 576, 4303 Kaiseraugst, Switzerland2DSM Nutritional Products Limited, 45 Waterview Boulevard, Parsippany, NJ, USA
(Submitted 17 February 2012 – Accepted 6 March 2012 – First published online 13 June 2012)
Abstract
Vitamins play a crucial role in health, but modern lifestyles may lead to suboptimal intakes even in affluent countries. The aim of the pre-sent study is to review vitamin intakes in Germany, the UK, The Netherlands and the USA and to compare them with respective national recommendations. Data on adults from the most recently published national dietary intake surveys for the first three countries and data for adults from the US National Health and Nutrition Examination Survey from 2003 to 2008 for the USA were used as a basis for the analysis. The proportions of the populations with intakes below recommendations were categorised as , 5, 5 – 25, . 25 – 50, . 50 – 75 and . 75 % for each vitamin. The data generated are presented in a ‘traffic light display’, using colours from green to red to indicate degrees of sufficiency. The trends found were compared with the results from the European Nutrition and Health Report 2009, even though in that report, only information on mean intakes in the different countries was available. We showed that, although inter-country differences exist, intakes of several vitamins are below recommendations in a significant part of the population in all these countries. The most critical vitamin appears to be vitamin D and the least critical niacin. The variation between the countries is most probably due to differences in recommendations, levels of fortification and local dietary habits. We show that a gap exists between vitamin intakes and requirements for a significant pro-portion of the population, even though diverse foods are available. Ways to correct this gap need to be investigated.
Key words:Vitamin intakes: Nutrition: Dietary surveys
The clinical features of overt vitamin deficiency and its relationship to dietary components have been recognised for centuries (e.g. vitamin A and blindness), but it was only in 1912 that Casimir Funk introduced the term ‘vitamine’ for substances, a deficiency of which would result in beriberi,
scurvy and pellagra(1). Since then researchers have discovered
the importance of vitamins for many biological functions at the molecular and cellular level, and today it is recognised that vitamins have an important role to play in promoting
human health(2). Consequently, daily intake recommendations
for the thirteen vitamins have been established in many countries. Although the concept of intake recommendations is widely recognised, national dietary reference values vary
considerably in terminology and value(3 – 6). However, the
underlying concept of these dietary intake recommendations is similar: previously defined to prevent overt deficiencies, nowadays, dietary reference intakes aim to define the intake at which health, including the reduction of chronic diet-related diseases, is optimal for the majority of individuals (generally
97·5 %) of a given population or group. Despite the existence of these intake recommendations, it is not fully clear how good the nutritional status in Western populations is. On the one hand, a variety of different kinds of foods is available and is accessible for everybody. On the other hand, changed lifestyles, reduced physical activity, indoor living and an increase in fast and convenience food with a low micronutri-ent density may have an impact on the quality of a person’s
daily diet and hence on their nutritional status(7,8). National
surveys try to answer this question and can be seen as a snapshot of the populations’ health and nutritional status. To further investigate and compare the current vitamin status in industrialised countries, large population-based surveys from Germany, the UK, The Netherlands and the USA were selected. The purpose of the present study was to assess and compare the dietary intakes as published in these surveys and to present the vitamin status relative to the respective national dietary reference intakes in a visual way. We chose a ‘traffic light display’, as it allows for a comparison of vitamin
† Both authors contributed equally to this work.
* Corresponding author: B. Troesch, fax þ 41 61 815 80 50, email [email protected]
Abbreviations: IOM, Institute of Medicine; NHANES, US National Health and Nutrition Examination Survey.
qThe Authors 2012
British
Journal
of
status in different populations taking into account local and national dietary habits and cultural specifics of countries and presents a tool to assess the pattern of the vitamin status in a visual way.
Experimental methods
Included cohorts and dietary surveys
The German Nutritional Intake Study (Nationale
Verzehrsstu-die II) 2008(9), the US National Health and Nutrition
Examin-ation Survey (NHANES) from 2003 to 2008(10 – 12), the British
National Diet and Nutrition Survey 2003(13) and the Dutch
National Food Consumption Survey 2007 – 10(14)were selected
for the assessment. These surveys were chosen as they pro-vide a higher level of detail than most other surveys published in industrialised countries. The three European surveys all published either the percentage of a given population below recommendations or the 5th, 25th, 50th and 75th percentiles for vitamin intakes, which is the information the ‘traffic light display’ is based on. The NHANES is unique as the complete datasets are publicly available for download and analysis, allowing the calculation of the required statistics.
The study details and dietary assessment methods for the four nutritional surveys have been described in detail
else-where(9,10,13,14). For the German, British and Dutch surveys,
data as published in the respective report were used. For the US data, we employed the Food and Nutrient Database for Dietary Studies (version 2.0 for the NHANES 2003 – 4, ver-sion 3.0 for 2005 – 6 and verver-sion 4.0 for 2007 – 8) to determine the vitamin content of foods collected during the NHANES. Intake data from the two 24 h recalls were used to estimate usual intake and percentiles of intake from foods using the
National Cancer Institute method(15). Intakes for males and
females in the 19 – 50-year age range were selected to achieve matching age groups for adults from Germany, the USA and The Netherlands. For the UK, only the 19 – 49-year age group was available and therefore used. This age group was also chosen as for each vitamin, country and sex, with a few
exceptions, it is covered by a single recommendation. The vitamins listed in Table 1 were selected, as information was available for all surveys with the exception of niacin for the Dutch National Food Consumption Survey. To maximise comparability between the surveys, the vitamin intakes from dietary sources and, where available, fortification excluding dietary supplements were used. For the Dutch and British surveys, where estimates for intakes from the diet with fortifi-cation alone as well as total dietary intake were available, the impact of vitamin supplements on categorisation according to the ‘traffic light display’ was evaluated.
Traffic light display
To take into account differences in habits and population characteristics, country-specific recommendations estimated to cover the needs of 97·5 % of a specific age group and sex
were used (Table 1)(16 – 26). The population at risk of
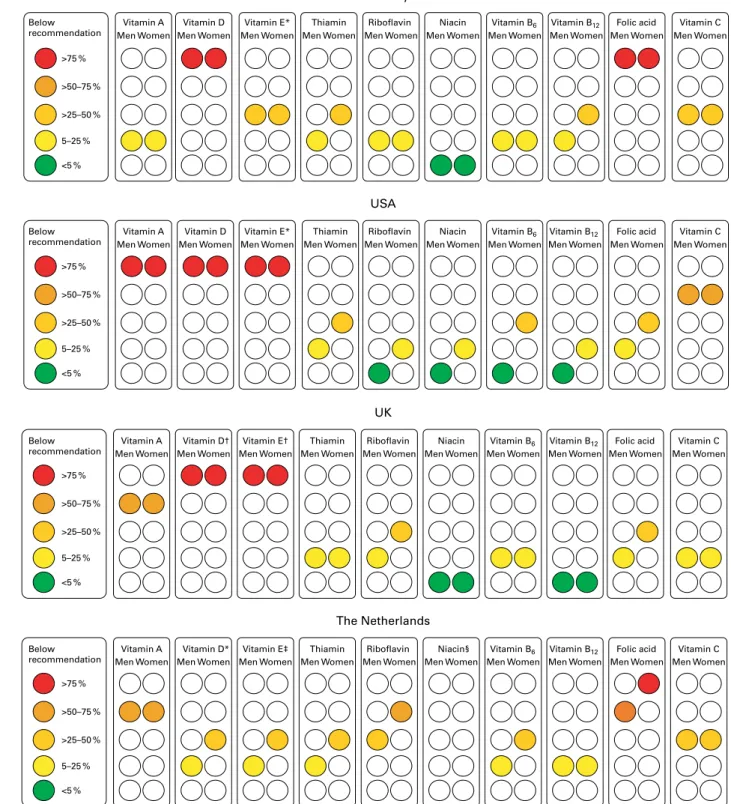
inadequate vitamin intakes was defined as the proportion with intakes below these recommendations. The vitamin intake data from the surveys were grouped into , 5, 5 – 25, .25 – 50, . 50 – 75 and . 75 % of a population having inadequate intakes. Based on these adequacy-of-intake groups, the data are presented in a ‘traffic light display’, using colours from green for the , 5 % group (very good status) to red for the . 75 % group (poor status) (Fig. 1).
Skewness of intake distribution
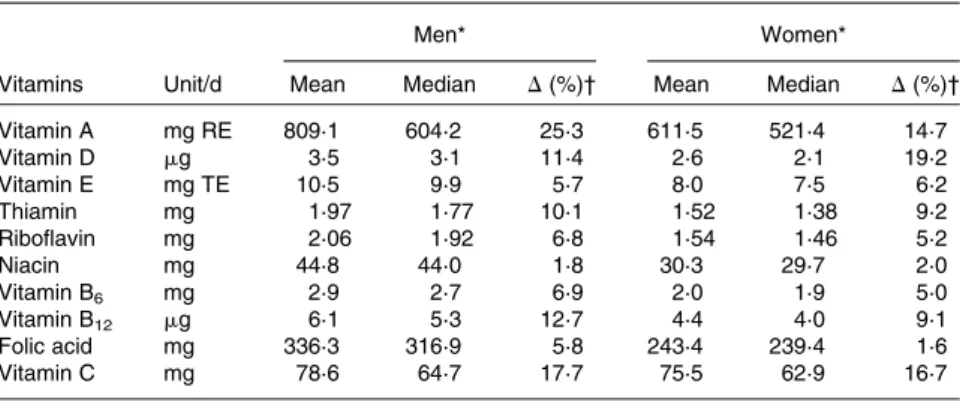
It is frequently assumed that vitamin intakes are normally dis-tributed and that, consequently, the mean intake represents the intake met by 50 % of the population. Therefore, we calcu-lated the relative difference between the mean and the median for each vitamin from the British National Diet and Nutrition Survey, as in that survey both values were available. The magnitude of the difference between these two values was used as an indicator for skewness of intake distribution.
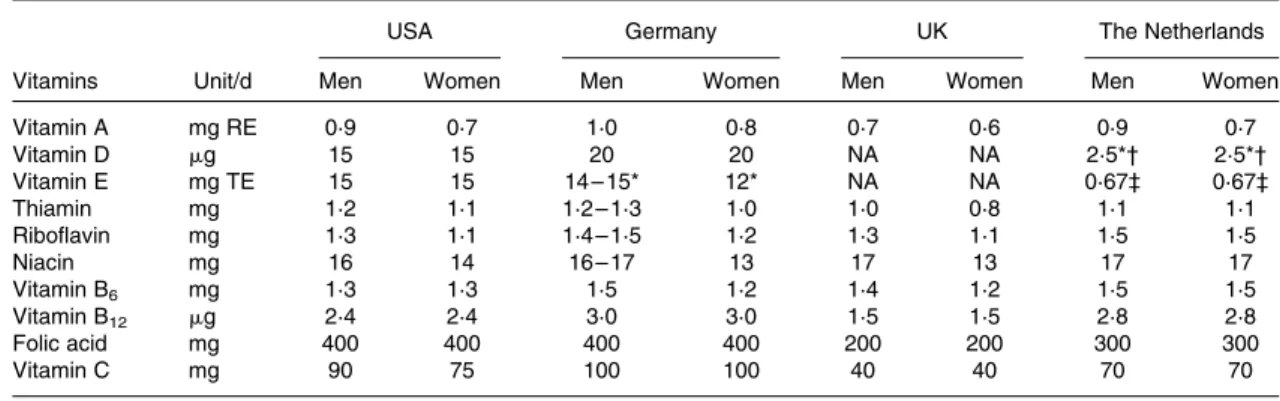
Table 1. Recommended intakes for men and women in the USA(20 – 23), Germany(19,25), the UK(24)and The Netherlands(16 – 18,26)
for the age group from 19 to 50 years
USA Germany UK The Netherlands
Vitamins Unit/d Men Women Men Women Men Women Men Women
Vitamin A mg RE 0·9 0·7 1·0 0·8 0·7 0·6 0·9 0·7 Vitamin D mg 15 15 20 20 NA NA 2·5*† 2·5*† Vitamin E mg TE 15 15 14 – 15* 12* NA NA 0·67‡ 0·67‡ Thiamin mg 1·2 1·1 1·2 – 1·3 1·0 1·0 0·8 1·1 1·1 Riboflavin mg 1·3 1·1 1·4 – 1·5 1·2 1·3 1·1 1·5 1·5 Niacin mg 16 14 16 – 17 13 17 13 17 17 Vitamin B6 mg 1·3 1·3 1·5 1·2 1·4 1·2 1·5 1·5 Vitamin B12 mg 2·4 2·4 3·0 3·0 1·5 1·5 2·8 2·8 Folic acid mg 400 400 400 400 200 200 300 300 Vitamin C mg 90 75 100 100 40 40 70 70
RE, retinol equivalent; NA, not available; TE, tocopherol equivalent. * Average nutrient requirement/approximation.
† 5 mg/d without exposure to sun. ‡ mg TE/g PUFA.
British
Journal
of
Results
The Nationale Verzehrsstudie sample contained 3270 men and 4176 women, the British National Diet and Nutrition Survey 580 men and 632 women and the Dutch National Food Consumption Survey 704 men and 698 women in the relevant
age group. For the NHANES, data from the cycles 2003 – 4, 2005 – 6 and 2007 – 8 were combined, resulting in a dataset of 3944 men and 3641 women. The percentage of a population below the recommended intake levels for men and women in the four countries assessed according to the ‘traffic light display’ is displayed in Fig. 1. The current recommended
Men Women Vitamin A
Men Women Vitamin D
Men Women Men Women Men Women Men Women Men Women Men Women Men Women Men Women Vitamin E* Thiamin Riboflavin Vitamin B12
Germany
Niacin Vitamin B6 Vitamin C
USA >75 % >50–75 % >25–50 % 5–25 % <5 % >75 % >50–75 % >25–50 % 5–25 % <5 % >75 % >50–75 % >25–50 % 5–25 % <5 % Below recommendation
Men Women Men Women Men Women Men Women Men Women Men Women Men Women Men Women Men Women Men Women
Men Women Men Women Men Women Men Women Men Women Men Women Men Women Men Women Men Women Men Women Folic acid
Vitamin A Vitamin D* Vitamin E‡ Thiamin Riboflavin Niacin§ Vitamin B6 Vitamin B12 Vitamin C Below
recommendation
Folic acid
Vitamin A Vitamin D† Vitamin E† Thiamin Riboflavin Niacin Vitamin B6 Vitamin B12 Vitamin C Below recommendation Folic acid Men Women Vitamin A Men Women Vitamin D
Men Women Men Women Men Women Men Women Men Women Men Women Men Women Men Women Vitamin E* Thiamin Riboflavin Niacin Vitamin B6 Vitamin B12 Vitamin C
>75 % >50–75 % >25–50 % 5–25 % <5 % Below recommendation Folic acid UK The Netherlands
Fig. 1. Population with intakes below the specific recommended reference value for the country(16 – 26). The level of recommendation covering the needs of 97·5 % of the population was used where it existed. * Average nutrient requirement/approximation. † No references exist, therefore, the Institute of medicine reference was used. ‡ . 25 – 50 % for men aged 19 – 30 years. § Data not available.
British
Journal
of
intakes of the respective countries are met in more than 95 % of the population in Germany for niacin and in the UK for
niacin and vitamin B12. In the USA, more than 95 % of men
meet the recommendations for riboflavin, niacin, vitamin B6
and B12. Conversely, more than 75 % of the population do
not receive recommended intakes of vitamin D and folate in Germany, vitamins A, D and E in the USA, vitamins D and E in the UK and folate in women in The Netherlands. The intakes of the remaining vitamins show varying degrees of inadequacy within and between the different countries. The impact of vitamin supplements on the categorisation of vita-min intakes according to the ‘traffic light display’ is summar-ised in Table 2. The relative difference between the mean and the median is between 1·6 and 25·3 % and for all vitamins analysed, the median is lower than the mean, indicating a deviation from normality for the intake distribution (Table 3).
Discussion
To assess the nutritional status of a nation is a challenge, and large-scale dietary intake surveys, albeit far from ideal, are considered to provide the most accurate data on populations currently available. Based on studies from Germany, the USA, the UK and The Netherlands, the percentage of the population not meeting the recommended intakes was dis-played according to the ‘traffic light display’ to provide a visual profile of the vitamin status. This shows that, for an appreciable number of vitamins, more than three-quarters of the population do not achieve the recommended intakes. The fat-soluble vitamins and folate show the most pronounced inter-country variation. This is most probably due to differ-ences in national recommendations, local dietary habits and
fortification programmes. The Dutch recommendations
propose to use 2·5 mg/d vitamin D in general and 5 mg/d for people without exposure to sun. Using the higher levels,
which are still well below the Germany, Austria and Switzer-land (DACH) and Institute of Medicine (IOM) levels, more than 75 % of the Dutch adults would be categorised as having inadequate intakes. The DACH very recently increased their recommendations from 5 to 20 mg vitamin D/d with the rationale that these amounts are needed to achieve optimal
25-hydroxyvitamin D serum concentrations(25). For vitamin
E, the authors of the Dutch National Food Consumption Survey propose to use the IOM recommendations as the
Dutch reference value has not been reviewed since 1989(14).
This would shift the level of inadequacy from 25 to 50 % for men and . 75 % for women.
Inadequate intake prevalence and deficiency for folate is common in the European countries, but less so in the USA(5,27). The high prevalence of inadequate intakes in the UK is masked by significantly lower recommendations (Table 1). The IOM recommendation for women of childbear-ing age is 400 mg/d of folic acid, as congenital malformations occur before most women know they are pregnant. Periconcep-tional folic acid supplementation has been shown to reduce
the incidence of neural tube defects by 20 – 60 %(28 – 31).
In Europe, the mean intakes for women are less than
300 mg/d(32) and approximately 4500 babies or fetuses are
affected by neural tube defects every year(33). The incidence
of neural tube defects in Germany is even higher still(29),
and although two-thirds of pregnancies are reportedly
planned, only about 4 % use an adequate prophylaxis(34).
Fortification increased the average woman’s intake by 100 mg/d in the USA, and it has been reported that countries with mandatory folic acid fortification achieved a significant
decrease in the prevalence of neural tube defects(35 – 38). The
hypothesis that very high folic acid intake might promote the growth of pre-neoplastic lesions has not been proven by consistent study findings. In addition, the masking of perni-cious anaemia, which has concerned people, has not been
observed in countries with mandatory folate fortification(39).
Germany is at the upper and the USA at the lower end of intakes for total vitamin A and b-carotene compared with
other western countries(32). The differences are partially due
to the conversion factor of 1:12 used for b-carotene in the
USA(20) and 1:6 used in Germany, The Netherlands and the
UK(9,13,14). This is due to different interpretations of the evi-dence for the relative absorption of provitamin A and its
con-version by b-carotene mono-oxygenase(19,20,24). There are no
official recommendations for b-carotene intakes, but 2 – 4 and 3 – 6 mg/d were proposed as advisable by the Nationale
Ver-zehrsstudie II and IOM, respectively(9,21). Given the small
con-tribution of preformed retinol even in affluent countries, levels
of 7 mg/d have been suggested elsewhere(40). While a
signifi-cant proportion of German adults have b-carotene intakes in
the range of these proposed recommendations(9), in the
USA, most people are even below the lowest level of 2 mg/d (data not shown). This highlights the importance of the contri-bution of b-carotene to the overall vitamin A status. The
situ-ation in the UK is similar to the USA(13), while in the Dutch
survey, information on b-carotene intakes was not available(14).
As only a small proportion of vitamin A is taken up as preformed retinol, even individuals at the high end of intakes
Table 2. Change in categorisation according to the ‘traffic light display’ if total intake including supplements is used and the estimated average requirements (EAR) is used as a cut-off point for adequacy of vitamin intake*
Total intake including vitamin
supplements EAR cut-off
UK The Netherlands USA
Men Women Men Women Men Women
Vitamin A 0 0 þ 1† þ 1† þ 1 þ 1 Vitamin D 0 0 0 0 0 0 Vitamin E 0 0 0 þ 1† 0 0 Thiamin 0 0 0 0 þ 1 þ 1 Riboflavin 0 0 þ 1 þ 1 0 þ 1 Niacin 0 0 NA NA 0 þ 1 Vitamin B6 0 0 0 þ 1 0 þ 1 Vitamin B12 0 0 0 0 0 0 Folate 0 0 þ 1† þ 1 þ 1 þ 1 Vitamin C 0 0 þ 1 þ 1 þ 1 þ 1
NA, not available.
* 0: no difference in categorisation, þ 1: prevalence of inadequate intake for the vitamin is one category lower if the contribution of vitamin supplements is included or if the EAR is used as a cut-off point.
† Difference only exists for the age group 31 – 50 years, but not for 19 – 30 years.
British
Journal
of
in Germany are below the upper intake still regarded as safe by
the IOM(9,20). A similar conclusion was reached by an evaluation
of retinol intakes in adults from food and, where information was available, fortification and supplementation in various
European countries(41).
Vitamin intakes are comparable in other European countries as reported in the European Nutrition and Health Report
2009(32). However, that report only compares mean intakes
with the respective RDA, an approach thought to
underesti-mate the number of individuals with low intakes(42). Still,
the majority of the countries do not reach even this low threshold for a number of vitamins. The comparison of mean and median from the UK survey shows that the intakes are not normally distributed as is often assumed, resulting in a further underestimation of the problem (Table 3). One limi-tation of the present study is that the cut-offs used to define adequacy could not be chosen freely, but according to availability for all four surveys. While the US and Dutch rec-ommendations define cut-offs for 50 % (i.e. estimated average requirements) and 97·5 % of the population (i.e. RDA), the former is not stated in the British and DACH recommen-dations. The IOM recommends the use of estimated average requirements as a basis to calculate the proportion of a population with inadequate vitamin intakes according to the
cut-point method(42,43). When this technique combined with
different cut-offs was compared with more comprehensive analyses, the estimated average requirement was found to give the best estimate of the prevalence of inadequate
intake, while the RDA tended to overestimate it(44). However,
categorising the NHANES data using both cut-offs showed that the difference is at most one category (Table 2). As the ‘traffic light display’ aims at profiling the vitamin status of countries and to highlight areas of concern, the message remains the same with either cut-off, and consequently, we used the one that maximised comparability between the countries.
Except for the NHANES, we had no access to raw data from the surveys and depended on previously published infor-mation. The included nutritional surveys were conducted with different study designs and methodologies, which are likely to influence the comparability of results. The analysis is limited to sex and age as data on socio-economic status
or cultural habits were not available for all surveys. Further-more, information on food availability between the countries could not be taken into account. Finally, it should be men-tioned that the initial data came from the results of dietary questionnaires. In cases of data validity, it is recommended to have additional measurements of dietary intake, for example nutritional biomarker measurements. Nutritional biomarkers can have less error than dietary data, as they take into account, for example, combination of foods eaten together, food storage and preparation that influence nutrient content and absorption, and inter-individual differences in
metabolism(45).
We decided to evaluate intake data excluding dietary supplements to assess the quality of the diet. Yet, the use of
vitamin supplements has increased over the last decades(46)
and consequently its effect has to be considered. While dietary supplements decreased the number of individuals not achiev-ing the recommended intakes in the USA, a significant pro-portion still had insufficient intakes for vitamins A, C, D, E
and K(47). Supplement use in Europe is less common and, in
addition, there is a strong north-to-south gradient, with 40
and 5 % users, respectively(5). This corresponds with the
range of 25 – 50 % reported in the three European surveys evaluated. Interestingly, re-categorising the intake data with supplements had no noticeable impact on the ‘traffic light display’ score for the UK data, but showed a slight shift towards lower prevalence for the Dutch survey (Table 2). The German report did not include the impact of the
supplements on total intake(9).
Besides the ones used in the present study, most surveys do not publish sufficiently detailed data to allow evaluation of vitamin intake based on the cut-point method recommended
by the IOM(42). Therefore, a more accurate picture will only
be available once data on nutrient intakes are evaluated with more accurate methods, linking them to functional indicators or biomarkers of vitamin status. Nevertheless, the available data clearly show that a gap exists between vitamin intakes and requirements for a significant proportion of the population even in the most affluent countries – a fact that is surprising and a call to action 100 years after the term ‘vitamine’ was coined.
Table 3. Difference between mean and median intake in the British National Diet and Nutrition Survey(13)
Men* Women*
Vitamins Unit/d Mean Median D(%)† Mean Median D(%)†
Vitamin A mg RE 809·1 604·2 25·3 611·5 521·4 14·7 Vitamin D mg 3·5 3·1 11·4 2·6 2·1 19·2 Vitamin E mg TE 10·5 9·9 5·7 8·0 7·5 6·2 Thiamin mg 1·97 1·77 10·1 1·52 1·38 9·2 Riboflavin mg 2·06 1·92 6·8 1·54 1·46 5·2 Niacin mg 44·8 44·0 1·8 30·3 29·7 2·0 Vitamin B6 mg 2·9 2·7 6·9 2·0 1·9 5·0 Vitamin B12 mg 6·1 5·3 12·7 4·4 4·0 9·1 Folic acid mg 336·3 316·9 5·8 243·4 239·4 1·6 Vitamin C mg 78·6 64·7 17·7 75·5 62·9 16·7 * Aged 19 – 49 years.
† Difference between the mean and the median as a proportion of mean intake.
British
Journal
of
Acknowledgements
We would like to thank Victor Fulgoni III of Nutrition Impact, LLC for the statistical analysis of the NHANES 2003 – 8 data,
Monica Scho¨nwa¨lder for her editorial support and Ralf
Biebin-ger for his input into the initiation of the ‘traffic light display’. The authors’ contributions were as follows: B. T., B. H. and P. W. defined the scope of the paper; B. T. analysed the data; B. T. and B. H. wrote the paper; B. T., B. H. and P. W. had primary responsibility for the final content. All authors read and approved the final manuscript. Conflict of interest: the authors are employed by DSM Nutritional Products Limited, a bulk supplier of vitamins.
References
1. Funk C (1912) The etiology of the deficiency diseases. Beri-beri, polyneuritis in birds, epidemic dropsy, scurvy, experimental scurvy in animals, infantile scurvy, ship beri-beri, pellagra. J State Med 20, 341 – 368.
2. Bender DA (2009) The vitamins. In Introduction to Human Nutrition, 2nd ed. [MJ Gibney, SA Lanham-New, A Cassidy and HH Vorster, editors]. Chichester: John Wiley & Sons, Limited.
3. Doets EL, de Wit LS, Dhonukshe-Rutten RA, et al. (2008) Current micronutrient recommendations in Europe: towards understanding their differences and similarities. Eur J Nutr 47, Suppl. 1, 17 – 40.
4. Pavlovic M, Prentice A, Thorsdottir I, et al. (2007) Challenges in harmonizing energy and nutrient recommendations in Europe. Ann Nutr Metab 51, 108 – 114.
5. Roman Vinas B, Ribas Barba L, Ngo J, et al. (2011) Projected prevalence of inadequate nutrient intakes in Europe. Ann Nutr Metab 59, 84 – 95.
6. Matthys C, van TVP, de Groot L, et al. (2011) EURRECAs approach for estimating micronutrient requirements. Int J Vitam Nutr Res 81, 256 – 263.
7. Allison AC (2001) The possible role of vitamin K deficiency in the pathogenesis of Alzheimer’s disease and in augment-ing brain damage associated with cardiovascular disease. Med Hypotheses 57, 151 – 155.
8. Ames BN (2010) Prevention of mutation, cancer, and other age-associated diseases by optimizing micronutrient intake. J Nucleic Acids 2010, 1 – 11.
9. Max Rubner-Institut (2008) Nationale Verzehrsstudie II. Ergebnisbericht Teil 2. Die bundesweite Befragung zur Erna¨hrung von Jugendlichen und Erwachsenen (National Food Intake Study II. Results Part 2. Countrywide Assessment of Nutrition in Adolescents and Adults). Karlsruhe: Max Rubner-Institut (http://www.was-esse-ich.de/uploads/media/ NVSII_Abschlussbericht_Teil_2.pdf) (accessed 2 July 2011). 10. Centers for Disease Control and Prevention & National
Center for Health Statistics (2009) NHANES 2003 – 2004. Data, Documentation, Codebooks, SAS Code. Dietary Inter-view. Individual Foods, Total Nutrient Intakes First and Second Day. Hyattsville, MD: U.S. Department of Health and Human Services & Centers for Disease Control and Prevention http://www.cdc.gov/nchs/nhanes/nhanes2003-2004/diet03_04.htm (cited August 2010).
11. Centers for Disease Control and Prevention & National Center for Health Statistics (2009) NHANES 2003 – 2004. Data, Documentation, Codebooks, SAS Code. Dietary Inter-view. Individual Foods, Total Nutrient Intakes First and Second Day. Hyattsville, MD: U.S. Department of Health
and Human Services & Centers for Disease Control and Prevention http://www.cdc.gov/nchs/nhanes/nhanes2005-2006/diet05_06.htm (cited August 2010).
12. Centers for Disease Control and Prevention & National Center for Health Statistics (2009) NHANES 2003 – 2004.
Data, Documentation, Codebooks, SAS Code. Dietary
Interview. Individual Foods, Total Nutrient Intakes First and Second Day. Hyattsville, MD: U.S. Department of Health and Human Services & Centers for Disease Control and Prevention http://www.cdc.gov/nchs/nhanes/nhanes 2007-2008/diet07_08.htm (cited August 2010).
13. Henderson L, Irving K, Gregory JF, et al. (2003) The National Diet and Nutrition Survey: Adults Aged 19 – 64 Years. vol 3: Vitamin and Mineral Intake and Urinary Analytes. London: The Stationery Office.
14. van Rossum CTM, Fransen HP, Verkaik-Kloosterman J,
et al. (2011) Dutch National Food Consumption Survey 2007 – 2010: Diet of Children and Adults Aged 7 to 69 Years. Bilthoven: RIVM.
15. Tooze JA, Kipnis V, Buckman DW, et al. (2010) A mixed-effects model approach for estimating the distribution of usual intake of nutrients: The NCI method. Stat Med 29, 2857 – 2868.
16. Gezondheidsraad (2000) Voedingsnormen: calcium, vita-mine D, thiavita-mine, riboflavine, niacine, pantotheenzuur en biotine (Food Standards: Calcium, Vitamin D, Thiamine, Riboflavin, Niacin, Pantothenic Acid and Biotin). Den Haag: Gezondheidsraad.
17. Gezondheidsraad (2008) Naar een adequate inname van
vitamine A (Towards an Adequate Intake of Vitamin A). Den Haag: Gezondheidsraad.
18. Gezondheidsraad (2003) Voedingsnormen: vitamine B6,
foliumzuur en vitamine B12(Food Standards: Vitamin B6,
Folic Acid and Vitamin B12). Den Haag: Gezondheidsraad.
19. Deutsche Gesellschaft fu¨r Erna¨hrung, O¨ sterreichische Gesellschaft fu¨r Erna¨hrung, Schweizerische Gesellschaft fu¨r Erna¨hrung, et al. (2008) Referenzwerte fu¨ r die Na¨hrstoffzu-fuhr (Reference Values for Nutrient Intake). Frankfurt/ Main: Umschau Verlag.
20. Institute of Medicine (2001) Dietary Reference Intakes of Vitamin A, Vitamin K, Arsenic, Boron, Chromium, Copper, Iodine, Iron, Manganese, Molybdenum, Nickel, Silicon, Vanadium, and Zinc. Washington, DC: National Academic Press.
21. Institute of Medicine (2000) Dietary Reference Intakes of Vitamin C, Vitamin E, Selenium, and Carotenoids. Washing-ton, DC: National Academic Press.
22. Institute of Medicine (2011) Dietary Reference Intakes for Calcium and Vitamin D. [AC Ross, CL Taylor, AL Yaktine and HB Del Valle, editors]. Washington, DC: The National Academies Press.
23. Institute of Medicine (1998) Dietary Reference Intakes for Thiamin, Riboflavin, Niacin, Vitamin B6, Folate, Vitamin
B12, Pantothenic Acid, Biotin and Choline. Washington,
DC: The National Academic Press.
24. Department of Health (1991) Dietary Reference Values for Food, Energy and Nutrients for the United Kingdom, no. 41. London: HMSO.
25. Deutsche Gesellschaft fu¨r Erna¨hrung (2012) Referenzwerte fu¨r die Na¨hrstoffzufuhr- Vitamin D (Calciferole) (Reference values for nutrient intakes – vitamin D (calciferols)). http://www.dge.de/modules.php?name¼Content&pa¼-showpage&pid¼4&page¼12 (updated 17 January 2012).
26. Voedingsraad (1992) Nederlandse voedingsnormen 1989
(Dutch Food Standards 1989). Den Haag: Voedingsraad.
British
Journal
of
27. Bailey RL, Dodd KW, Gahche JJ, et al. (2010) Total folate and folic acid intake from foods and dietary supplements in the United States: 2003 – 2006. Am J Clin Nutr 91, 231 – 237. 28. MRC Vitamin Study Research Group (1991) Prevention of
neural tube defects: results of the Medical Research Council Vitamin Study. Lancet 338, 131 – 137.
29. Herrmann W & Obeid R (2011) The mandatory fortification of staple foods with folic acid: a current controversy in Germany. Dtsch Arztebl Int 108, 249 – 254.
30. Czeizel AE & Duda´s I (1992) Prevention of the first occur-rence of neural-tube defects by periconceptional vitamin supplementation. N Engl J Med 327, 1832 – 1835.
31. Werler MM, Shapiro S & Mitchell AA (1993) Periconceptional folic acid exposure and risk of occurrent neural tube defects. JAMA 269, 1257 – 1261.
32. Elmadfa I, Meyer A, Nowak V, et al. (2009) European Nutri-tion and Health Report 2009. Forum of NutriNutri-tion, vol. 62. Basel: Karger.
33. Yi Y, Lindemann M, Colligs A, et al. (2011) Economic burden of neural tube defects and impact of prevention with folic acid: a literature review. Eur J Pediatr 170, 1391 – 1400. 34. Heinz J, Ka¨stner S, Seewald M, et al. (2006) Unzureichende
Umsetzung der perikonzeptionellen Folsa¨ureeinnahme zur Pra¨vention von Neuralrohrdefekten (Inadequate implemen-tation of periconceptual folic acid intake for the prevention of neural tube defects). Geburtshilfe und Frauenheilkunde 66, 156 – 162.
35. Williams LJ, Mai CT, Edmonds LD, et al. (2002) Prevalence of spina bifida and anencephaly during the transition to man-datory folic acid fortification in the United States. Teratology 66, 33 – 39.
36. Williams LJ, Rasmussen SA, Flores A, et al. (2005) Decline in the prevalence of spina bifida and anencephaly by race/ ethnicity: 1995 – 2002. Pediatrics 116, 580 – 586.
37. De Wals P, Tairou F, Van Allen MI, et al. (2008) Spina bifida before and after folic acid fortification in Canada. Birth Defects Res A Clin Mol Teratol 82, 622 – 626.
38. De Wals P, Tairou F, Van Allen MI, et al. (2007) Reduction in neural-tube defects after folic acid fortification in Canada. N Engl J Med 357, 135 – 142.
39. EUROCAT (2009) Special Report: Prevention of Neural Tube Defects by Periconceptual Folic Acid Supplementation in Europe – December 2009. EUROCAT Central Registry, University of Ulster (http://www.eurocat-network.eu/page-content.aspx?pageid=115) (accessed 4 July 2011).
40. Grune T, Lietz G, Palou A, et al. (2010) Beta-carotene is an important vitamin A source for humans. J Nutr 140, 2268S – 2285S.
41. Flynn A, Hirvonen T, Mensink GB, et al. (2009) Intake of selected nutrients from foods, from fortification and from supplements in various European countries. Food Nutr Res 53, 1 – 51.
42. Institute of Medicine (2003) Dietary Reference Intakes: Applications in Dietary Planning. Washington, DC: National Academy Press.
43. Carriquiry AL (1999) Assessing the prevalence of nutrient inadequacy. Public Health Nutr 2, 23 – 34.
44. de Lauzon B, Volatier J & Martin A (2004) A Monte Carlo simulation to validate the EAR cut-point method for asses-sing the prevalence of nutrient inadequacy at the population level. Public Health Nutr 7, 893 – 900.
45. Potischman N (2003) Biologic and methodologic issues for nutritional biomarkers. J Nutr 133, Suppl. 3, 875S – 880S. 46. Gahche J, Bailey R, Burt V, et al. (2011) Dietary supplement
use among U.S. adults has increased since NHANES III (1988 – 1994). NCHS Data Brief 1 – 8.
47. Fulgoni VL, Keast DR, Bailey RL, et al. (2011) Foods, fortifi-cants, and supplements: where do Americans get their nutrients? J Nutr 141, 1847 – 1854.