RESEARCH OUTPUTS / RÉSULTATS DE RECHERCHE
Author(s) - Auteur(s) :
Publication date - Date de publication :
Permanent link - Permalien :
Rights / License - Licence de droit d’auteur :
Institutional Repository - Research Portal
Dépôt Institutionnel - Portail de la Recherche
researchportal.unamur.be
University of NamurLow-LET proton irradiation of A549 non-small cell lung adenocarcinoma cells: dose response and RBE determination
Wera, Anne-Catherine; Heuskin, Anne-Catherine; Riquier, Hélène; Michiels, Carine; Lucas, Stéphane Published in: Radiation Research DOI: 10.1667/RR3008.1 Publication date: 2013 Document Version
Peer reviewed version
Link to publication
Citation for pulished version (HARVARD):
Wera, A-C, Heuskin, A-C, Riquier, H, Michiels, C & Lucas, S 2013, 'Low-LET proton irradiation of A549 non-small cell lung adenocarcinoma cells: dose response and RBE determination', Radiation Research, vol. 179, no. 3, pp. 273-281. https://doi.org/10.1667/RR3008.1
General rights
Copyright and moral rights for the publications made accessible in the public portal are retained by the authors and/or other copyright owners and it is a condition of accessing publications that users recognise and abide by the legal requirements associated with these rights. • Users may download and print one copy of any publication from the public portal for the purpose of private study or research. • You may not further distribute the material or use it for any profit-making activity or commercial gain
• You may freely distribute the URL identifying the publication in the public portal ?
Take down policy
If you believe that this document breaches copyright please contact us providing details, and we will remove access to the work immediately and investigate your claim.
Low LET proton irradiation of A549 non-small cell lung adenocarcinoma cells: dose response and RBE determination
Anne-Catherine WERA1, Anne-Catherine HEUSKIN1, Hélène RIQUIER2, Carine MICHIELS2, Stéphane LUCAS1
NARILIS, University of Namur - FUNDP Rue de Bruxelles 61, B-5000 Namur, Belgium
1
Research Center for the Physics of Matter and Radiation (PMR-LARN)
2
URBC
Corresponding author: carine.michiels@fundp.ac.be Tel: +32-81724131, Fax: +32-81714135
Abstract
Since 1957, broad proton beam radiotherapy with a spread out Bragg peak has been used for cancer treatment. More recently, studies on the use of proton therapy in the treatment of non-small-cell lung cancer (NSCLC) were performed and, although the benefit of using protons for the treatment of NSCLC is recognized, more work is needed to gather additional data for the understanding of cell response. Human A549 cell survival was evaluated by colony forming assay 11 days after 10 keV/µm proton beam irradiation at 0.1 and 1 Gy/min. The residual energy of the proton beam at the location of the irradiated cells was 3.9 MeV. In parallel, early effects on the cell viability and DNA damage were assessed and DNA synthesis was measured. The survival curve obtained was fitted with both the Linear and the Induced-Repair models as a hyper-radiosensitivity was evidenced at very low doses. Above 0.5 Gy, a linear shape was observed with the parameter equal to 0.824 ± 0.029 Gy-1. Early cell death and cell proliferation arrest were highlighted. Moreover, a clear correlation between DNA damage and surviving fraction was observed. Finally, comparisons with X results indicate that proton irradiation at 10 keV/µm enhances the tumor radiosensitivity with a significant dose-dependent decrease in the survival fraction. The RBE value of 1.9 ± 0.4 obtained for a 10% survival supports this observation. This is the first study to show that low LET proton irradiation of lung cancer cells evidenced hyper-radiosensitivity with a high RBE value.
Keywords
A549 cells, surviving fraction, linear and LQ model, relative biological effectiveness, hyper-radiosensitivity
PACS
Introduction
Lung cancer is the leading cause of cancer-related death both in the US and Europe (1). Besides traditional treatment of this disease, such as surgery or chemotherapy and/or radiotherapy, new modalities are under investigation like radio-immunotherapy (RIT) (2,
3) or external radiotherapy with heavy charged particles like protons. The idea to use
protons for medical applications was first suggested by the physicist Robert R. Wilson in 1946, recognizing that the unique physical properties of protons would have distinct advantages over photon radiation (4). Since this date, the use of proton beams in radiotherapy has considerably increased. The major difference between radiotherapy with photons vs. protons is the spatial distribution of the absorbed dose. Indeed, for photons, the maximum dose is deposited close to the entrance surface of the irradiated matter, while, for protons, the maximum dose deposition occurs within the so-called Bragg peak, at a depth depending on the incident beam energy. This increased accuracy in the dose distribution allows the treatment of tumors localized in the vicinity of vital and radiosensitive organs as the deposited dose to the surrounding normal tissues can be reduced. Currently, proton beams are used for the treatment of pediatric tumors for which the greatest potential benefit is expected, but also for adult tumors in the head and neck region, the skull base, the orbit, the brain and extra-cranial sites as well as for prostate cancer (5-7). More recently, studies on the use of proton therapy in the treatment of non-small-cell lung cancer (NSCLC) have been performed and reviewed in (8-10). In these papers, authors present the benefit of using protons for the treatment of NSCLC but emphasize that more data are needed to better understand the cell response to proton beam irradiation. This is one of the goals of this paper.
Another contribution of this work is in relation to the measurement of RBE at low LET. It is generally accepted that high energy protons have the same effect as megavoltage X-rays, with a mean RBE observed in vivo of 1.10 (11). However, LET variations appear within the tumor volume due to continuous energy loss along the proton track (from fraction of keV/µm to 85 keV/µm) and the associated RBE may be higher or lower than the one used in treatment planning. Today, the Treatment Planning Systems (TPS) are only considering a constant RBE of 1.1 according to ICRU78 (2007). But, it is recognized that this is an oversimplification and studies are in progress to implement RBE variation along the proton track in current TPS. For that purpose, one needs to evaluate the cell response at various LET.
Within this context, the in vitro irradiation station developed at the University of Namur for broad beam radiobiological experiment was used to study the response of A549 human lung carcinoma cells irradiated with protons. Cells were irradiated at 0.1 and 1 Gy/min with a broad proton beam with an incident energy of 4 MeV corresponding to a LET of 10 keV/µm. The clonogenic survival was evaluated, and highlighted a higher biological effect compared to photons, but also a hyper-radiosensitivity at low doses. In parallel, early effect on the cell viability, DNA damage as well as DNA synthesis were assessed.
Material and Methods
Cell Cultures
Human A549 human alveolar adenocarcinoma cells (ATCC) were grown in MEM (Minimum Essential Medium) (Invitrogen) containing 10% (v:v) fetal calf serum (FCS) (Invitrogen) at 37°C in a humidified atmosphere incubator containing 5% CO2.
Proton Beam Irradiation and Dosimetry
Cells are seeded in home-made irradiation chambers, that fit into the linear accelerator on a Kapton foil; as a drop of 30 µl containing 100,000 cells. Twenty-four hours after seeding, confluent monolayers of A549 cells were irradiated with a broad proton beam with an incident energy of 4 MeV, corresponding in to an energy at the cell entrance of 3.9 MeV. The energy of the proton beam after the cell monolayer is 3.75 MeV. The proton broad beam was produced with a 2MV Tandem accelerator (High Voltage, Netherlands). More details on irradiation facility and cell preparation for the irradiation are described in (12).
For an ion beam, the dose-rate is given by:
̇
(1)
where ̇ is Gy/s, i h lin n n f , i h flu nd i h ll density. Following equation (1), LET and flux must be controlled over the entire irradiation field and throughout the irradiation of the cells.
Knowing the incident proton beam energy precisely (for the energy calibration of the accelerator see (13) the beam energy and the energy spread were experimentally evaluated at the entrance of the cell monolayer (after the kapton foil) using a calibrated PIPS detector (Passivated Implanted Planar Silicon). The LET value was then calculated with the SRIM program (14) to 10 keV/µm LET (± 1%).
The flux is measured with the PIPS detector placed in front of the beam. The flux must be controlled over the irradiation field and during the irradiation, thus variations are related to spatial inhomogeneity and beam current fluctuation. Both of them were checked and the variation was evaluated to be about 5 %. Finally, the induced dose-rate error related to energy spread, beam inhomogeneity and current fluctuation was evaluated to be 6 %. For more details on the beam characterization see (12). This error was used to calculate the dose error for the surviving fraction curve presented in this paper. Note that the contribution of backscattered protons to the dose-rate is below 5 x 10⁻³ % and thus can be ignored. Two different dose-rates were used to achieve the chosen doses with a good accuracy: 0.1 Gy/min for doses ranging from 0.02 to 0.5 Gy and 1 Gy/min for doses ranging from 0.2 to 3 Gy. Note that, for all experiments, the doses 0.2 and 0.5 Gy were performed at both dose-rates to detect a possible effect of the dose rate.
Colony Forming Assay
After irradiation, cells were detached using trypsin, counted and seeded in 6-well plates (9.40 cm²) at desired concentrations. Eleven days after seeding, the number of visible colonies (containing more than 50 cells) was counted after staining with violet crystal in 2% ethanol. The plating efficiency (PE) was determined for each dose and the surviving
fraction was calculated as the ratio of the PE for the irradiated cells to the control cells (12). The survival curve has been drawn from three independent experiments performed on three different days. For each experiment, two radiation chambers were used for one dose and one dose-rate and the trypsinized cells from each chamber were seeded in 6 different wells, to be stained with violet crystal at the end of the experiment. The errors were evaluated as standard deviation. Control cells were sham-treated cells that underwent all procedures except the radiation exposure.
Cell Viability
After irradiation, cells were detached using trypsin, counted, and 1500 cells were seeded in 96-well plates (0.32 cm²). 24 hours post-irradiation, cell viability was assessed using 3-(4,5-Dimethylthiazol-2-yl)-2,5-diphenyltetrazolium bromide (MTT). The optical density was measured at 570 nm. The percentage of metabolically active irradiated cells was obtained as the ratio of the optical density of the irradiated cells to the optical density of the control cells. Three independent experiments were performed for each dose and dose-rate.
DNA Synthesis
After irradiation, cells were detached using trypsin, counted, and 1000 cells were seeded in 96-well plates (0.32 cm²). At 0 h, 24 h or 48 h post-irradiation, 10 µl of [3H]-thymidine solution (10µCi/ml) was added to the 96-well for 24 hours. A scintillation counter was used to measure the incorporation of [3H]-thymidine as described in (15). In parallel, the same quantity of cells was seeded in another 96-well plates to assess the number of cells at the moment of the [3H]-thymidine incorporation, as measured by Pierce BCA protein
assay (Thermo Scientific). DNA synthesis obtained in the control cells was normalized to 100% and the percentage of DNA synthesis in the irradiated cells compared to the control was then obtained. Three independent experiments were performed for each dose.
Nuclear Morphology
After irradiation, cells were detached using trypsin, counted, and about 1000 cells were seeded on sterilized coverslips placed in 24-well plates (1.88 cm²). At 24 h or 72 h post-irradiation, DAPI (4,6-diamidino-2-phenylindole-dihydrochloride) staining was performed. Cells were fixed for 15 min in 4% paraformaldehyde (Merck). After three PBS washes, cells were permeabilized in PBS + 0.2% triton X100 (Merck) for 5 minutes at room temperature. Cells were stained with DAPI (Sigma, 100 ng/ml) for 15 min in dark at 37°C. After one PBS wash, coverslips were mounted in Mowiol (Sigma).
The analysis consisted of counting the number of nuclei with normal or abnormal phenotypes. Examples of abnormal nuclei scored included small and condensed apoptotic nuclei with a bright fluorescence due to chromatin condensation (16), and large and uncondensed mitotic catastrophe nuclei (17). Non-irradiated cells were used as controls. The percentage of nuclei with non-normal morphology was obtained in irradiated cells as well as in the non-irradiated control cells. Results are expressed as the value obtained by subtracting the percentage obtained in the non-irradiated control cells from the percentage obtained for irradiated cells. Three independent experiments were performed for each dose and dose-rate.
-H2AX immunofluorescence staining
At 15 minutes, 2 hours and 24 hours after irradiation, cells were fixed, permeabilized and stained for -H2AX. The immunofluorescence staining was performed as described in (18). Primary antibody is rabbit anti-phospho-histone H2AX (#9664 Cell Signaling) at 1/400 dilution. Alexa Fluor-488-conjugated anti rabbit IgG antibody (Molecular Probes) was used at 1/1000 dilution. Nuclei were staining with ToPro-3. The images obtained by confocal microscopy using a constant photomutiplier (Leica SP5) were analyzed with the measure RGB plugin of the ImageJ software. The fluorescence intensity was quantitated in about 100 cells for each condition of time and dose. The threshold value was deduced from control non-irradiated cells. Cells with a higher fluorescence intensity than the mean value + one standard deviation were considered as positive cells.
Survival Curve Analysis
The results obtained with the colony forming assays were analyzed with the Linear-Quadratic (LQ) model and the Induced-Repair model (IndRep). The LQ model allows the d in ion of h wo dio n i ivi α nd β
²) ( D D
e
S
where S is the surviving fraction and D is the deposited dose (Gy). The LQ model considers that lesions induced by radiation may interact in the cell to cause cell death. h l ion ul f o in l v n d ib d b α o b wo ind nd n d ib d b β Fo i l wi h hi h h n l ionizin radiations, the surviving fraction curve p n lin h nd h β f o the LQ model is set to zero leading to a linear model. Even if widely accepted, literature
has shown that deviation between experimental data and this model can be observed. For example, at low dose, deviation can be due to hyper-radiosensitivity (HRS) (19, 20). To obtain a better approximation of the data at low doses, the Induced-Repair model has been suggested to match this HRS as well as the induced radioresistance observed in doses up to 1 Gy. ² ) ) 1 ( 1 ( e Dc D D D r s r
e
S
h IndR od l i n d ion of h Q od l h llow h α o v with the dose (21). h od l d fin fou : αr (r for resistance, characterizing
the region at doses higher than the dose region for HRS) nd β ob in d wi h h Q od l; αs (s for sensitive, characterizing the low dose region) and Dc (c for conversion,
corresponding to the dose for which the conversion from αs to αr is 63% complete)
characterizing the HRS. The surviving fraction was fitted using Origin 7.5 (OriginLab) with chi square minimization method.
Irradiations of A549 lung cancer cells with 1.2 MeV protons (LET=25 keV/µm) have been performed in a previous work and published in (12). In parallel, 250 kV X-rays irradiations were also performed using the same irradiation conditions with the same cell line using a Philips Medical Systems RT 250 X-ray unit. The experimental data obtained for X-rays in our laboratory are presented in (22).
The calculated radiosensitivity parameters of the surviving fraction obtained with colony forming assay are also used for comparison to calculate the relative biological effectiveness (RBE) for irradiations with each proton bean energy and LET (10 keV/µm and 25 keV/µm).
Statistical Analysis
Statistical analyses were carried out using ANOVA 1 using Sigma Stat.
Results
Dose surviving fraction curve after 4 MeV broad proton beam irradiation
Irradiations were performed for doses ranging from 0.02 to 3 Gy in three independent experiments. For the low dose region (0.02 to 0.5 Gy) the dose-rate was set to 0.1 Gy/min, while the dose-rate was set to 1 Gy/min for the higher doses (0.2 to 3 Gy). The doses of 0.2 and 0.5 Gy were performed using both dose-rates. 11 days after irradiation, the surviving fraction was assessed with colony forming assays (figure 1A). No difference was seen in the surviving fraction obtained at 0.2 and at 0.5 Gy for both dose-rates. The experimental data have been fitted with LQ, linear and IndRep models. h α nd β l ul d wi h h LQ model were 0.839 ± 0.126 Gy-1
and -0.005 ± 0.046 Gy-2 , iv l A d, h qu d i β ob in d i v ll in o i on o h lin α Fu h o , h β un in i l h n h parameter value itself. The Linear model was thus preferred to fit the experimental data, i.e., the parameter was set to zero as a linear shape was observed for the higher doses. The linear model gave an parameter equal to 0.824 ± 0.029 Gy-1. At low doses, from 0.02 to 0.2 Gy, a deviation between experimental data and the LQ model was observed (inset of figure 1A). This deviation is due to HRS and is highlighted by linearization of the surviving fraction, i.e. –ln(S)/D where S is the surviving fraction and D is the dose (figure 1B). A better approximation of the data at low doses was obtained with the
IndRep model (see fit in figure 1A and 1B). The additional values obtained with this model were 11.6 ± 5.2 Gy-1 and 0.052 ± 0.015 Gy for s and Dc respectively.
Cell viability 24 hours after irradiation
In order to highlight early effects on cell viability after 10 keV/µm proton beam irradiation, MTT assays were performed 24 hours after the irradiation. The results obtained for different doses at dose-rates of 0.1 and 1 Gy/min were compared to control cells (figure 2). A slight decrease in viability, that did not reach statistical significance, was observed for doses of 0.075 and 0.1 Gy. These results are consistent with the HRS observed in the surviving fraction curve (figure 1). A significant decrease in viability was observed for doses of 1.5 and 2.5 Gy. No difference was seen in the viability obtained between the two dose-rates for the 0.2 and 0.5 Gy doses.
DNA synthesis
To assess the DNA synthesis rate,[3H]-thymidine incorporation was evaluated after irradiation of A549 cells. [3H]-thymidine incorporation during 24 hours was measured at 0, 24 and 48 hours after irradiation. This corresponds to time intervals of [0-24h], [24-48h] and [48-72h]. Results are presented in figure 3. At the lowest dose (0.2 Gy), the proportion of cells that were still synthesizing DNA was not significantly different from the control cells 48-72 hours after irradiation: the relative [3H]-thymidine incorporation reached 100 %. Furthermore, for 0.5 Gy, at the first 0-24 hours after irradiation, the proportion of DNA synthesizing cells was significantly lower than for control cells. It was also the case for the experiment in which DNA synthesis was assessed between 24-48 hours after irradiation. Interestingly, the proportion of the DNA synthesizing cells 24-
48-72 hours after irradiation was not significantly different from control cells. This observation may indicate a recovery of cell proliferation. For higher doses, the fraction of the cells that were still synthesizing DNA was much lower than for control cells and no increase was observed with time. At the higher dose of 3 Gy, this fraction decreased to less than 20% 48-72 hours after irradiation, indicating that the most of cells still present in the sample were no longer able to grow to form colonies.
Nuclear morphology after irradiation
Apoptotic cells and cells undergoing mitotic catastrophe can be distinguished by DAPI nuclear staining. The staining was performed 24 hours and 72 hours after the irradiation. Results are presented in figure 4. At 24 hours post-irradiation (figure 4A), from 2 to 6 % of apoptotic cells can be observed with a trend toward a higher level of apoptosis with higher doses. In addition, 2 to 5 % of cells displayed large and uncondensed nuclei for doses higher than 0.1 Gy, suggesting that they underwent mitotic catastrophe. At 72 hours post-irradiation (figure 4B), small nuclei with bright fluorescence were no longer present, and, the fraction of mitotic catastrophe nuclei increased with the dose from 0.2 to 3 Gy up to represent more than 20 % of the cells for 3 Gy. These observations are in agreement with the results obtained from the MTT tests and the [3H]-thymidine incorporation measurements. No difference was seen in the observed nucleus morphology between the two dose rates for the 0.2 and 0.5 Gy doses.
DNA damage induced by proton radiation were detected using -H2AX immunofluorescence staining. We assessed overall DNA damage using a FACS-like analysis with the integration of the intensity of the fluorescent signal for each cell. Results showed that the percentage of cells harboring DNA damage increased with the dose as well as with time of recovery: about 80 % of the cells were positive for -H2AX staining 24 hours after irradiation with 2 Gy (figure 5A). Although, the proportion of more fluorescent cells seemed to be stable over time, the average fluorescence intensity for these cells decreased with time indicating cell repair (data not shown). A correlation (r² = 0.94) could be observed between the number of -H2AX-positive cells estimated 24 hours after irradiation and the surviving fraction (figure 5B). Finally, the fact that there was not a lower number of positive cells at 0.075 Gy in comparison to 0.5 Gy is consistent with the HRS observed on the survival curve (figure 5C).
Dose survival curve comparison
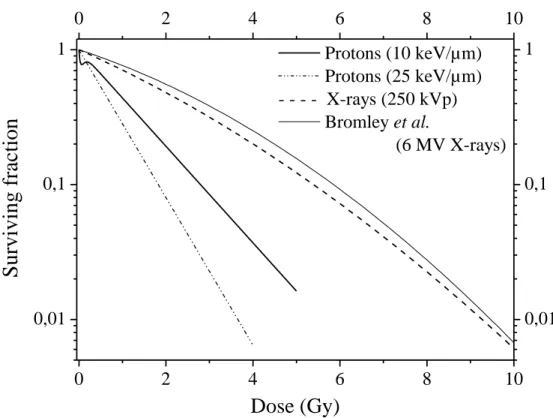
In order to compare these data with data obtained for other types of irradiation, we compiled data obtained by our group using the same cell line and the same protocol. Results are presented in figure 6 for irradiations performed with 10 keV/µm protons, 25 keV/µm protons and 250 kV X-rays (22). The curve of Bromley et al. (23) is used for comparison with data from the literature. On one hand, we observe that the two proton u v lin h β w o -2 wi h h α er equal to 0.824 ±
0.029 and 1.26 ± 0.03 Gy-1 for 10 keV/µm and 25 keV/µm respectively. On the other hand, the X-ray curves are shouldered as expected and are very similar one to each other.
The radiosensitivity parameters are 0.332 ± 0.045 Gy-1 and 0.018 ± 0.005 Gy-2 for 250 kV X-rays and 0.2432 Gy-1 and 0.0257 Gy-2 for 6 MV X-rays from (23).
We have calculated, from data we generated for X-rays, the RBE for 10% survival and we obtained 1.9 ± 0.4 and 2.9 ± 0.5 for the 10 keV/µm and 25 keV/µm proton irradiation. RBE values that we calculated from our data regarding proton irradiation were compared to the results of Bromley et al. for 6 MV X-rays are 2.1 ± 0.4 and 3.1 ± 0.6 respectively (23).Moreover, for the lowest surviving fraction within the HRS region for 10 keV/µm proton irradiation, i.e. 77%, the RBE values are equal to 10.7 ± 3.3 and 3.6 ± 0.6 for 10 keV/µm and 25 keV/µm proton irradiation respectively.
Discussion
In May 2011, the Particle Therapy Co-Operative Group reported that 38 particle therapy facilities are in operation. Statistics on hadron-therapy show that about 74,000 out of a total of 84,500 patients have been treated with protons since particle beam therapy began in 1954. Since 1957, broad beam radiotherapy with a spread out Bragg peak (SOBP) was used to cover larger tumors. In this case, beams with different intensity and energy (or range) are added to obtain a composite curve of relative dose with a desired shape at a desired depth. Although proton therapy is generally used for tumors in the region of vital or radiosensitive organs like head and neck tumors or for pediatric tumors, studies on the use of proton for the treatment of lung show promising results but more data are needed to better understand the cell response. Moreover, during SOBP patient irradiation, the variation and especially the increase in the LET at the end of the particle track may lead to local overdosage.
In this work, human A549 cells were irradiated with a 4 MeV broad proton beam at dose-rates of 0.1 and 1 Gy/min for doses ranging from 0.02 to 3 Gy. Different biological endpoints were studied: clonogenicity, direct mortality, apoptosis, DNA damage and DNA synthesis. For the 0.2 and 0.5 Gy doses, the experiments were performed with the two dose-rates and no effect of dose-rate was detected. Indeed, both in the surviving fraction and in the cell viability assessment no difference was seen between the results obtained for 0.1 Gy/min and 1 Gy/min. This indicates a dose-rate independent cell response in this range of doses and dose-rates.
The surviving fraction obtained 11 days after irradiation showed two different behaviors in the shape of the curve. On one hand, at higher doses (from 0.5 to 3 Gy), a linear shape
(characteristic of high LET radiations) was observed with a surviving fraction at 2 Gy of ~20%, which decreased to less than 10% at 3 Gy. On the other hand, at lower doses (from 0.02 to 0.2 Gy), a deviation showing higher cell sensitivity was observed: this is the so-called hyper-radiosensitivity (HRS) observed in many tumor cells lines (19), but mostly for sparely ionizing radiation.
The decrease in the surviving fraction for the high doses region can be linked to both direct mortality and cell proliferation arrest. On one hand, the results obtained 24 hours after the irradiation showed a significant decrease in the fraction of metabolically active cells (MTT test). This is in agreement with the presence of a low percentage of apoptotic cells observed in figure 4A. This range of apoptotic cells percentage is within the range observed by others for proton irradiation (24, 25). Similarly to the results of Dunne et al. (25), we observed that later than 24h post-irradiation, the number of apoptotic cells decreased. Our results are also in accordance with the activation of apoptotic pathways found for A549 lung cancer cells irradiated with low energy protons early after irradiation (26). On the other hand, an arrest in the cell proliferation was observed for higher doses, with the proportion of cells able to divide decreasing to fractions smaller than 70% to 40% for doses from 0.5 to 3 Gy. Even after long recuperation time (48h and 72h), this proportion of proliferating cells that have been irradiated at high doses never increased and we observed a significant decrease in the [3H]-thymidine incorporation over time at 3 Gy. This is in good accordance with the high number of cells undergoing mitotic catastrophe at 72 hours post-irradiation for higher doses. However, at 0.5 Gy, we can see that the proliferation increased to reach values comparable to the control cells.
This indicates the potential repair of the remaining cells as the fraction of proliferating cells increased with time for this dose.
DNA damage was assessed through -H2AX staining. Proton irradiation has already been shown to induce DNA double strand breaks (27). An increase in DNA damage was observed with increasing doses. A linear correlation between DNA damage positive cells assessed 24 hours post-irradiation and surviving fraction was observed as it was already published for X-ray irradiation (28).
Regarding the low dose region, we did observe HRS. HRS on A549 lung cancer cells was also observed in one of our previous works, after irradiation with low dose-rate beta particles (29). Moreover, this was also evidenced for the same cell line by Enns et al. (30) but for irradiation with gamma rays from 137Cs at a dose-rate of 0.22 Gy/min. The HRS was observed at ~0.1 Gy and was due to apoptotic death happening during the first cell cycle post-irradiation. In comparison with our results, HRS also seems to be related to direct mortality, as indicated by the MTT results for 0.075 and 0.1 Gy as well as by the higher proportion of cells with non normal nuclei (figure 5). Moreover, a high proportion of positive cells for DNA damage assessed at 24 hours for the low dose 0.075 Gy also supports the HRS. 72 hours post-irradiation, there was no difference regarding DNA synthesis for 0.2 Gy, which means that the remaining cells were still able to grow to form colonies and thus this may indicate that cells were not in a senescent state.
Although there is an extensive amount of data in literature about HRS for cancer and normal cells, it mainly concerns X or gamma rays irradiations. However a few studies report HRS for low-LET and high-LET ions. In the work of Schettino et al. (31), V79 cells were irradiated with counted protons from a charged-particle microbeam at 3.2 MeV
and 1 MeV (around 11 and 24 keV/µm respectively). HRS was observed in the low dose region for both experiments but was more pronounced for the lower LET. By contrast, Cherubini et al. (32) never observed HRS for V79 cells irradiated with 0.8 and 5 MeV broad proton beams (28.5 and 7.7 keV/µm respectively). However, they reported low dose hypersensitivity ( s / r 1.1) for T98G human cells irradiated with 28.5 keV/µm protons. HRS with broad beams of 4He ions has been reported by Tsoulou et al. (33). V79 cells were irradiated by α-particles of various linear energy transfers (58.9, 79.3 and 101.7 keV/µm) and showed increased HRS in the low dose region with an increasing LET. Finally, Böhrnsen et al. have observed a significant HRS after irradiation of V79 cells with 27.5 keV/µm carbon ions (34).
In summary, for the low dose region, HRS leads to a decrease in the surviving fraction through cell death occurring immediately after irradiation. However, the remaining cells seem to be able to repair and grow into colonies. For higher doses, direct mortality after 24 hours is observed in parallel with a strong decrease in the cell DNA synthesis, indicating that cells were not able to repair and stopped proliferating.
The surviving fraction curve obtained in this work with a 10 keV/µm proton beam shows a linear shape with the lowest surviving fraction equal to ~8% at the highest dose tested. Although the quadratic term was set to zero, we can not exclude that for higher doses (i.e. lower surviving fraction), the curve starts to bend, leading to a ß parameter higher than zero.
The surviving fraction obtained at 2 Gy with 10 keV/µm proton beam can be compared to the one obtained after either gamma or X-ray irradiation from other published work: our work: SF2Gy= 0.199 ± 0.045; 0.7 for 137C γ i di ion 22 in (30); 0.55 for
6MV X-rays (23); 0.61 ± 0.004 with 137C γ i di ion 4 5 in (35). If one considers that the surviving fraction obtained at 2 Gy characterizes the tumor radiosensitivity, i.e. reflects the clinical radioresponsiveness of the tumors from which the cell lines are derived (36), these comparisons show that proton irradiation at 10 keV/µm enhances the tumor radiosensitivity by a factor of 3 compared to photon irradiation. In figure 6, a comparison is made between survival curves obtained for protons at 10 keV/µm, 25 keV/µm, and 250 kV X-rays and 6 MV X-rays (23). Although the curve is a little more shouldered for the 6 MV X-rays, a good agreement can be observed between the two X-rays irradiations performed on the same cell line but in two different labs. The radiosensitivity parameters ( and ) for 250 kV X-rays are 0.332 ± 0.045 Gy-1 and 0.018 ± 0.005 Gy-2 while for protons the parameter is zero and the parameter is 0.824 ± 0.029 Gy-1 and 1.26 ± 0.03 Gy-1 for 10 keV/µm and 25 keV/µm, respectively. The calculated RBE, for a surviving fraction of 10%, is equal to 1.9 ± 0.4 for 10 keV/µm and 2.9 ± 0.5 for 25 keV/µm. The comparison with the X-ray results of Bromley et al. (23) led to RBE values of 2.1 ± 0.4 and 3.1 ± 0.6 for 10 keV/µm and 25 keV/µm, respectively. Moreover, within the HRS region, the RBE values calculated for a 77% survival are equal to 10.7 ± 3.3 and 3.6 ± 0.6 for 10 keV/µm and 25 keV/µm respectively. These values, evaluated for A549 lung cancer cells, are notably higher than the averaged ones used in clinical trials i.e. 1.1 (11). If we consider the last millimeter crossed by a proton beam during patient irradiation, due to the Bragg peak, the LET varies from 5 to about 30 keV/µm. In this work, the proton energy used corresponded to the one found at the end of the proton track, i.e. with a much higher LET, hence the results highlight more marked effects and a higher RBE value. Thus, these different values of RBE according to LET
indicate that there is an increasing dose response effect at the track end of each beam composing the SOBP used for the patient treatment. Although the dose deposited at the track end of each beam is relatively low compared to the total deposited dose, the increased dose response due to this high LET region may lead to unexpected effect at the cellular level.
This higher RBE as well as the HRS highlighted in this work could indicate that both treatment planning and proton therapy systems should take into account these increased effects and that the beam intensity should be adapted to decrease the dose deposited in the surrounding healthy tissues. In parallel, one can imagine to take advantage of the HRS in order to improve the clinical outcome of proton therapy of lung cancer. Indeed, if the lack of HRS in normal tissue is demonstrated, the use of such low doses may lead to a diminution of the normal tissue complication leading to an increased therapeutic ratio.
Acknowledgments
We would like to thank Y. Morciaux, A. Nonet, T. Tabarrant and L. Lambotte for their technical support. Anne-Catherine Heuskin is supported by the Belgian Found for Scientific Research (F.R.S.-FNRS). Hélène Riquier is recipient of a Télévie fellowship.
References
1. Ferlay J, Parkin DM and Steliarova-Foucher E. Estimates of cancer incidence and
mortality in Europe in 2008. Eur J Cancer 2010; 46:765-81.
2. Abrams PG and Fritzberg AR. Radioimmunotherapy of Cancer. 2000;
3. Bouchat V, Nuttens VE, Michiels C, Masereel B, Feron O, Gallez B, et al.
Radioimmunotherapy with radioactive nanoparticles: biological doses and treatment efficiency for vascularized tumors with or without a central hypoxic area. Med Phys 2010; 37:1826-39.
4. Wilson RR. Radiological use of fast protons. Radiology 1946; 47:487-91.
5. Levin WP, Kooy H, Loeffler JS and DeLaney TF. Proton beam therapy. Br J Cancer
2005; 93:849-54.
6. Schulz-Ertner D, Jakel O and Schlegel W. Radiation therapy with charged particles.
Semin Radiat Oncol 2006; 16:249-59.
7. McDonald MW and Fitzek MM. Proton therapy. Curr Probl Cancer 2010; 34:257-96. 8. Bush DA. Proton radiation therapy for lung cancer: is there enough evidence?
Oncology (Williston Park) 2010; 24:1052-7.
9. Pijls-Johannesma M, Grutters JP, Verhaegen F, Lambin P and De Ruysscher D. Do we
have enough evidence to implement particle therapy as standard treatment in lung cancer? A systematic literature review. Oncologist 2010; 15:93-103.
10. Widesott L, Amichetti M and Schwarz M. Proton therapy in lung cancer: clinical
11. Paganetti H, Niemierko A, Ancukiewicz M, Gerweck LE, Goitein M, Loeffler JS, et
al. Relative biological effectiveness (RBE) values for proton beam therapy. Int J Radiat Oncol Biol Phys 2002; 53:407-21.
12. Wera A-C, Riquier H, Heuskin A-C, Michiels C and Lucas S. In vitro irradiation
station for broad beam radiobiological experiments. Nuc Instruments Met Phys Res B 2011; 269:3120-4.
13. Demarche J and Terwagne G. Precise measurements of the differential cross section
from the 0-16(alpha,alpha)O-16 elastic reaction at 165 degrees and 170 degrees between 2.4 and 6.0 MeV. J Appl Phys 2006; 100:124909-1-7.
14. Ziegler JF, Biersak JP and Littmark U. The stopping and range of ions in solids.
Pergamon Press 1985;
15. Dumont P, Burton M, Chen QM, Gonos ES, Frippiat C, Mazarati JB, et al. Induction
of replicative senescence biomarkers by sublethal oxidative stresses in normal human fibroblast. Free Radic Biol Med 2000; 28:361-73.
16. Doonan F and Cotter TG. Morphological assessment of apoptosis. Methods 2008;
44:200-4.
17. Huang X, Tran T, Zhang L, Hatcher R and Zhang P. DNA damage-induced mitotic
catastrophe is mediated by the Chk1-dependent mitotic exit DNA damage checkpoint. Proc Natl Acad Sci U S A 2005; 102:1065-70.
18. Piret JP, Cosse JP, Ninane N, Raes M and Michiels C. Hypoxia protects HepG2 cells
against etoposide-induced apoptosis via a HIF-1-independent pathway. Exp Cell Res 2006; 312:2908-20.
19. Joiner MC, Marples B, Lambin P, Short SC and Turesson I. Low-dose
hypersensitivity: current status and possible mechanisms. Int J Radiat Oncol Biol Phys 2001; 49:379-89.
20. Marples B, Wouters BG, Collis SJ, Chalmers AJ and Joiner MC. Low-dose
hyper-radiosensitivity: a consequence of ineffective cell cycle arrest of radiation-damaged G2-phase cells. Radiat Res 2004; 161:247-55.
21. Short SC and Joiner MC. Cellular response to low-dose irradiation. Clin Oncol (R
Coll Radiol) 1998; 10:73-7.
22. Riquier H Wera A-C Heuskin A-C Feron O Michiels C and Lucas S. Comparison of
X-ray and alpha particle effects on a human cancer and endothelial cells: survival curves and gene expression profiles. Radiother Oncol submitted;
23. Bromley R, Oliver L, Davey R, Harvie R and Baldock C. Predicting the clonogenic
survival of A549 cells after modulated x-ray irradiation using the linear quadratic model. Phys Med Biol 2009; 54:187-206.
24. Auer S, Hable V, Greubel C, Drexler GA, Schmid TE, Belka C, et al. Survival of
tumor cells after proton irradiation with ultra-high dose rates. Radiat Oncol 2011; 6:139.
25. Dunne AL Price ME Mothersill C McKeown SR Robson T and Hirst DG.
Relationship between clonogenic radiosensitivity, radiation-induced apoptosis and DNA damage/repair in human colon cancer cells. Br J Cancer 2003; 89:2277-83.
26. Ghosh S, Bhat NN, Santra S, Thomas RG, Gupta SK, Choudhury RK, et al. Low
energy proton beam induces efficient cell killing in A549 lung adenocarcinoma cells. Cancer Invest 2010; 28:615-22.
27. Zlobinskaya O, Dollinger G, Michalski D, Hable V, Greubel C, Du G, et al. Induction
and repair of DNA double-strand breaks assessed by gamma-H2AX foci after irradiation with pulsed or continuous proton beams. Radiat Environ Biophys 2012; 51:23-32.
28. Menegakis A, Yaromina A, Eicheler W, Dorfler A, Beuthien-Baumann B, Thames
HD, et al. Prediction of clonogenic cell survival curves based on the number of residual DNA double strand breaks measured by gammaH2AX staining. Int J Radiat Biol 2009; 85:1032-41.
29. Wera AC, Borlon C, Nuttens VE, Riquier H, Feron O, Michiels C, et al. Comparison
of the clonogenic survival of A549 non-small cell lung adenocarcinoma cells after irradiation with low-dose-rate beta particles and high-dose-rate X-rays. Int J Radiat Biol 2012; 88:253-7.
30. Enns L, Bogen KT, Wizniak J, Murtha AD and Weinfeld M. Low-dose radiation
hypersensitivity is associated with p53-dependent apoptosis. Mol Cancer Res 2004; 2:557-66.
31. Schettino G Folkard M Prise KM Vojnovic B Bowey AG and Michael BD. Low-dose
hypersensitivity in Chinese hamster V79 cells targeted with counted protons using a charged-particle microbeam. Radiat Res 2001; 156:526-34.
32. Cherubini R, De Nadal V, Gerardi S and Guryev D. Lack of hyper-radiosensitivity
and induced radioresistance and of bystander effect in V79 cells after proton irradiation of different energies. Radiat Prot Dosimetry 2011; 143:315-9.
33. Tsoulou E, Baggio L, Cherubini R and Kalfas CA. Low-dose hypersensitivity of V79
cells under exposure to gamma-rays and 4He ions of different energies: survival and chromosome aberrations. Int J Radiat Biol 2001; 77:1133-9.
34. Bohrnsen G, Weber KJ and Scholz M. Low Dose Hypersensitivity and Induced
Resistance of V79 Cells after Charged Particle Irradiation using 100 MeV/u Carbon Ions. Radiat Protect Dosim 2002; 99:255-6. .
35. Munshi A Tanaka T Hobbs ML Tucker SL Richon VM and Meyn RE. Vorinostat, a
histone deacetylase inhibitor, enhances the response of human tumor cells to ionizing radiation through prolongation of gamma-H2AX foci. Mol Cancer Ther 2006; 5:1967-74.
36. Fertil B and Malaise EP. Intrinsic radiosensitivity of human cell lines is correlated
with radioresponsiveness of human tumors: analysis of 101 published survival curves. Int J Radiat Oncol Biol Phys 1985; 11:1699-707.
Figure
Figure 1: Dose-dependent A549 cell surviving fraction obtained 11 days after irradiation
with a 4 MeV broad proton beam. A549 cells were irradiated at a dose-rate of 1 Gy/min for doses from 0.2 to 3 Gy, and at 0.1 Gy/min for doses from 0.02 to 0.5 Gy. The experimental data were obtained with colony forming assays.
(A) Experimental data (filled square); linear model fit (dashed line) and IndRep model fit (straight line) are displayed. The inset is an enlargement of the data obtained at low doses. Results are expressed as means ± S.D. (n=3).
(B) Experimental data (filled square), linear model (dashed line) and IndRep model (straight line) linearization.
0,1 1 0,0 0,5 1,0 1,5 2,0 2,5 3,0 0,1 1 Experimental data Linear model IndRep model 0,0 0,1 0,2 0,3 0,4 0,5 0,6 0,7 0,8 0,9 1 1,1 0,0 0,1 0,2 0,3 0,4 0,5 0,6 0,7 0,8 0,9 1 1,1 S ur viving fr ac tion
S
ur
vivi
ng f
ra
cti
on
0,0 0,5 1,0 1,5 2,0 2,5 3,0 0 2 4 6 8 10 0 2 4 6 8 10 Experimental data Linear model IndRep model-ln(S
)/D
Dose (Gy)A
B
Figure 2: Dose-dependent cell viability 24 hours after irradiation of A549 cells with a 4
MeV broad proton beam. A549 cells were irradiated at a dose-rate of 1 Gy/min for doses from 0.2 to 3 Gy and at 0.1 Gy/min for doses from 0.02 to 0.5 Gy. 24 hours after irradiation, a MTT test was performed. The optical density obtained for the control cells was normalized to 100 %. Results are expressed as means ± S.D. Statistical analysis was carried out with an ANOVA 1 was used to compare values to their respective controls: ++, 0.05>p>0.01. 0.02 0.05 0.075 0.1 0.2 0.5 1 1.5 2 2.5 3 0 20 40 60 80 100 120 0 20 40 60 80 100 120 ++
R
elative optica
l density (%
)
Dose (Gy)
++Figure 3: Dose-dependent DNA synthesis rate of A549 cells after a 4 MeV proton beam
irradiation. A549 cells were irradiated at a dose-rate of 1 Gy/min for doses ranging from 0.2 to 3 Gy. [3H]-thymidine incorporation was measured from 0 to 24 hours, 24 to 48 hours, 48 to 72 hours post-irradiation and divided by the number of cells assessed by a protein assay. The value obtained for the control cells was normalized to 100%. Results are expressed as means ± S.D. Statistical analysis was carried out with an ANOVA 1 to compare values to their respective controls: ++, 0.05>p>0.01, +++(***), p<0.001.
0.2 0.5 1 1.5 2 2.5 3 0 20 40 60 80 100 120 140 0 20 40 60 80 100 120 140 *** +++ +++ +++ +++ +++ +++ +++ +++ +++ +++ +++ +++ +++ +++ +++ +++ +++
R
elative [
3H]
-thym
idi
ne
incor
por
ati
on (
%
)
Dose (Gy)
0-24h 24-48h 48-72h ++ ***Figure 4: Dose-dependent changes in the percentage of apoptotic or mitotic catastrophe nuclei after irradiation of A549 cells with a 4 MeV proton beam. A549 cells were irradiated at a dose-rate of 1 Gy/min for doses from 0.2 to 3 Gy and at 0.1 Gy/min for doses from 0.02 to 0.5 Gy.
(A) DAPI staining was performed 24 hours post-irradiation. The percentage of apoptotic cells and cells in mitotic catastrophe are presented. These values were obtained after subtracting the corresponding values from control cells.
(B) DAPI staining was performed 72 hours post-irradiation. The percentage of apoptotic cells and cells in mitotic catastrophe are presented. These values were obtained after subtracting the corresponding values from control cells.
0,02 0,05 0,075 0,1 0,2 0,5 1 1,5 2 2,5 3 0 5 10 15 20 0 5 10 15 20
%
Dose (Gy)
Apoptosis Mitotic catastropheB
0,02 0,05 0,075 0,1 0,2 0,5 1 1,5 2 2,5 3 0,0 1,0 2,0 3,0 4,0 5,0 6,0 7,0 0,0 1,0 2,0 3,0 4,0 5,0 6,0 7,0%
Apoptosis Mitotic catastropheA
B
0 0,075 0,50 1,0 2,0 0 10 20 30 40 50 60 70 80 90 100 0 10 20 30 40 50 60 70 80 90 100 P osi ti ve c ell s (% ) Dose (Gy) 15 min 2 hours 24 hours 0,0 0,5 1,0 1,5 2,0 0 20 40 60 80 100 0,0 0,5 1,0 1,5 2,0 0 20 40 60 80 100 P osi ti ve c ell s a t 24 hours ( % ) 20 30 40 50 60 70 80 90 0 10 20 30 40 50 60 70 80 90 100 20 30 40 50 60 70 80 90 0 10 20 30 40 50 60 70 80 90 100 0.075 Gy 0.5 Gy 1 Gy S urviving fr ac tion (% )Positive cells at 24 hours (%)
2 Gy
r²=0.94
A
Figure 5: Dose-dependent -H2AX immunofluorescence staining after irradiation with a 4 MeV broad proton beam. A549 cells were irradiated at a dose-rate of 1 Gy/min for the doses 1 and 2 Gy and at 0.1 Gy/min for the doses 0.075 and 0.5 Gy. -H2AX staining was performed at 15 min, 2 hours and 24 hours after irradiation. Cells were considered as positive if the intensity of the -H2AX staining was higher than the threshold obtained for control cells. (A) Experimental data. Results are expressed in percentages of positive. Error bars are calculated as statistical errors (n > 100 cells).
(B) Relationship between the surviving fraction and the percentage of -H2AX positive cells 24 hours after irradiation of A549 cells with a 4 MeV broad proton beam. Filled square: experimental data; straight line: linear fit.
(C) Relationship between the percentage of -H2AX positive cells 24 hours after irradiation of A549 cells with a 4 MeV broad proton beam and the dose.
Figure 6: Comparison of A549 lung cancer cell dose-dependent surviving fraction
obtained after exposure to X-rays or protons. Bold straight line: 4 MeV proton beam (10 keV/µm); dashed-dotted line: 1.2 MeV proton beam (25 keV/µm); bold dashed line: 250 kV X-rays (~ 1keV/µm); dotted line: Bromley et al. (6 MV X-rays).
0 2 4 6 8 10 0,01 0,1 1 0 2 4 6 8 10 0,01 0,1 1