1 POLYGENIC RISK SCORE FOR ATOPIC DERMATITIS IN THE CANADIAN POPULATION – ONLINE REPOSITORY
Mathieu Simard, Anne-Marie Madore, Simon Girard, Susan Waserman, Qingling Duan, Padmaja Subbarao, Malcolm R. Sears, Theo J. Moraes, Allan B. Becker, Stuart E. Turvey, Piushkumar J. Mandhane, Charles Morin, Philippe Bégin, Catherine Laprise
METHOD
Study Populations
The Saguenay–Lac-Saint-Jean (SLSJ) asthma familial cohortE1 includes individuals of French descent from this region in northern Quebec, Canada, and the CHILD Cohort StudyE2 comprises both those of English descent and those of multiple other origins living in British Columbia (Vancouver), Alberta (Edmonton), Manitoba (Winnipeg, Morden and Winkler) and Ontario (Toronto). The SLSJ Asthma Cohort (n=1,394) was built through recruitment of asthmatic probands and their family members. The general and respiratory health of all individuals were evaluated using a standardized questionnaire, allergy and pulmonary function tests according to the American Thoracic Society guidelines.E3 The CHILD Cohort Study (n=3,495) comprised singleton children recruited in pregnancy from a general-population of mothers and followed at different times during their development (from in utero to 5 years old) with standardized questionnaires and physician diagnoses. Each site obtained local Research Ethics Board approval for the study, and each participating parent gave signed informed consent.
Clinical definitions
For the CHILD Cohort Study, atopic dermatitis (AD) was from physician diagnosis at the one year follow-up. AD severity was defined as mild if there is a single site or no more than 2 sites, minor symptoms (little itching/rubbing), minor crusting and papules, not excoriated or oozing, not needing frequent medical attention; was defined as moderate if symptoms are neither mild nor severe or; was defined as severe if there are multiple sites, with extensive crusting or papules or excoriations or oozing or lichenification, sleep loss, needing frequent medical attention, and is a major concern to parents. Food allergy, asthma and allergic rhinitis were defined as past or present diagnosis of the specific disease by one of the CHILD Cohort Study physicians at the five years follow-up. In the SLSJ Cohort, atopic dermatitis and allergic rhinitis were self-reported and were considered as positive if past or present occurrence of these diseases were reported. For children, cross validation was done using questionnaires filled by their parents. Moreover, validation in medical records of these self-reported phenotypes were done for a subset of the SLSJ Cohort (n = 217), giving 89% concordance. Individuals were deemed atopic if they had at least one positive response on skin prick tests (wheal diameter ≥ 3 mm or larger than the wheal diameter elicited by the negative control [glycerin]) and have a physician diagnosis. Finally, participants were considered as asthmatic if: (1) they had a reported history of asthma (validated by a physician), or (2) they presented asthma-related symptoms and positive PC20 (< 8 mg/ml) at recruitment. For the phenotypic description of the samples included in the analyses, see Table E1.
2 Genomic data
Genomic data were collected from Illumina Human610-Quad BeadChip in the SLSJ cohort and Illumina HumanCoreExome BeadChip in the CHILD cohort (Illumina Inc., San Diego, CA, USA). Each cohort was imputed separately and then combined to only keep common genetic variants. After quality control assessment, data that followed these criteria were used for the imputation: minor allele frequency ≥ 5%, p value for Hardy-Weinberg equilibrium ≥ 1e-05, genotype and individual call rates ≥ 95% and, for the CHILD Cohort, individuals with cryptic relatedness with IBD PI_HAT > 0.185. The pre-phasing step for the imputation process was performed with the Shapeit2 Software using the duoHMM method that combines estimated haplotypes, with pedigree information to take advantage of known structure related to the latter.E4 Impute2 Software was used for imputationE5 with the 1,000 Genome Project database (phase 3)E6 and the UK10K one as reference samples. Only imputed data that fulfilled the same criteria as the ones for GWAS were included in analyses (minor allele frequency ≥ 5%, p value for Hardy-Weinberg equilibrium ≥ 1e-05, genotype and individual call rates ≥ 95%). After quality filtering, 5,894,709 common genetic variants between the two cohorts were available for analysis.
Scenario 1: Polygenic risk score built with GWAS loci identified in the literature
Literature search using the GWAS Catalog (https://www.ebi.ac.uk/gwas/) and PubMed (https://www.ncbi.nlm.nih.gov/pubmed) was performed to identify the GWASs of AD or the atopic march. From 11 scientific papers that followed the GWAS Catalog criteria (≥ 100,000 genetic variants analyzed and studies that are not oriented to candidate genes), 187 genetic variants were also listed (p ≤ 1e-05 in overall analysis defined as a combined p ≤ 1e-05 [discovery + replication cohort] or if not available, a discovery p ≤ 1e-05 and a replication cohort p ≤ 1e-05 and if no replication cohort in the study, a discovery p ≤ 1e-05). From these, the best 25 associations were selected and regions of ± 100 kb were set for each.
To perform analyses, the combined cohort including all unrelated cases and controls was divided into two cohorts. Eighty percent of samples were grouped in the training cohort (n = 2,688) and 20% in the testing cohort (n = 676; Table E1 and Figure E1). For each locus, the 25 genetic variants that had the most significant association with moderate to severe AD (MSAD) in a general regression model (PLINK 1.9) performed in the training cohort were included in the polygenic risk score (PRS). The general model increases the power of the analysis compared to an additive one.E7, 8 β estimates (= ln[OR]) were then extracted from the best transmission pattern (additive, dominant or recessive) for each genetic variant according to results obtained from the general model performed. PRS was calculated as the number of risk alleles for each genetic variant weighted on the β estimatesE9 for each individual of both the training and the testing cohorts. Scenario 2: Polygenic risk score built with GWAS results from the two Canadian cohorts
The 25 strongest GWAS hits were identified using the MFQLS test implemented in the Workbench for Integrated Superfast Association study with Related Data (WISARD) toolkit in the training cohort (n = 2,688).E10, 11 A general regression model (PLINK 1.9) was then performed to extract risk alleles and β estimates of each genetic variant to calculate PRS as previously explained. The PRS values were also calculated for individuals of the testing cohort for further validation (n = 676).
3 Testing discriminative value of PRSs from both scenarios
With the computed PRS values, a receiver operating characteristic (ROC) curve was built using pROC and plotROC packages for R to assess the discriminative power of these by considering the specificity and the sensitivity values and the area under the curve (AUC). AUCs were then be classified into “fair” (70%–79%), “good” (80%–89%) or “excellent” (90%–99%) categories.E12 The explained variance of MSAD by PRSs was evaluated with the Nagelkerke’s pseudo-R2 statistics (R rcompanion Package).E13 ROC curves and Nagelkerke’s pseudo-R2 were calculated considering both PRS alone or in combination with age, sex and parents’ ethnicity as covariates. A logistic regression (R stats Package) was also done with PRS values classified into deciles (deciles 2 to 10 compared to decile 1). This approach allowed the identification of reliable cutoffs to create a binary PRS for each patient in order to classify them into two categories: the individuals at low risk of developing MSAD, and those at high risk.
To further apply the results of computed PRSs obtained in AD to the development of the so-called “atopic march” clinical manifestations, logistic regressions and ROC curves were performed with the binary PRS with and without above-mentioned covariates to assess the predictive modeling for MSAD, food allergies, asthma and rhinitis.
These analyses were all performed in the training cohort to assess the efficacy of the PRSs built, but also in the testing cohort to validate its discriminative value.
REFERENCES
E1. Laprise C. The Saguenay-Lac-Saint-Jean asthma familial collection: the genetics of asthma in a young founder population. Genes and immunity. 2014;15(4):247-55.
E2. Subbarao P, Anand SS, Becker AB, Befus AD, Brauer M, Brook JR, et al. The Canadian Healthy Infant Longitudinal Development (CHILD) Study: examining developmental origins of allergy and asthma. Thorax. 2015;70(10):998-1000.
E3. ATS statement--Snowbird workshop on standardization of spirometry. Am Rev Respir Dis. 1979;119(5):831-8.
E4. O'Connell J, Gurdasani D, Delaneau O, Pirastu N, Ulivi S, Cocca M, et al. A general approach for haplotype phasing across the full spectrum of relatedness. PLoS Genet. 2014;10(4):e1004234.
E5. Howie BN, Donnelly P, Marchini J. A flexible and accurate genotype imputation method for the next generation of genome-wide association studies. PLoS Genet. 2009;5(6):e1000529. E6. Auton A, Brooks LD, Durbin RM, Garrison EP, Kang HM, Korbel JO, et al. A global reference
for human genetic variation. Nature. 2015;526(7571):68-74.
E7. Dizier MH, Demenais F, Mathieu F. Gain of power of the general regression model compared to Cochran-Armitage Trend tests: simulation study and application to bipolar disorder. BMC Genet. 2017;18(1):24.
E8. Purcell S, Neale B, Todd-Brown K, Thomas L, Ferreira MA, Bender D, et al. PLINK: a tool set for whole-genome association and population-based linkage analyses. American journal of human genetics. 2007;81(3):559-75.
4 E9. Mavaddat N, Pharoah PD, Michailidou K, Tyrer J, Brook MN, Bolla MK, et al. Prediction of breast cancer risk based on profiling with common genetic variants. Journal of the National Cancer Institute. 2015;107(5).
E10. Thornton T, McPeek MS. Case-control association testing with related individuals: a more powerful quasi-likelihood score test. Am J Hum Genet. 2007;81(2):321-37.
E11. Lee S, Choi S, Qiao D, Cho M, Silverman EK, Park T, et al. WISARD: workbench for integrated superfast association studies for related datasets. BMC Med Genomics. 2018;11(Suppl 2):39. E12. Carter JV, Pan J, Rai SN, Galandiuk S. ROC-ing along: Evaluation and interpretation of receiver
operating characteristic curves. Surgery. 2016;159(6):1638-45.
E13. Wray NR, Yang J, Hayes BJ, Price AL, Goddard ME, Visscher PM. Pitfalls of predicting complex traits from SNPs. Nature reviews Genetics. 2013;14(7):507-15.
SUPPLEMENTARY TABLES
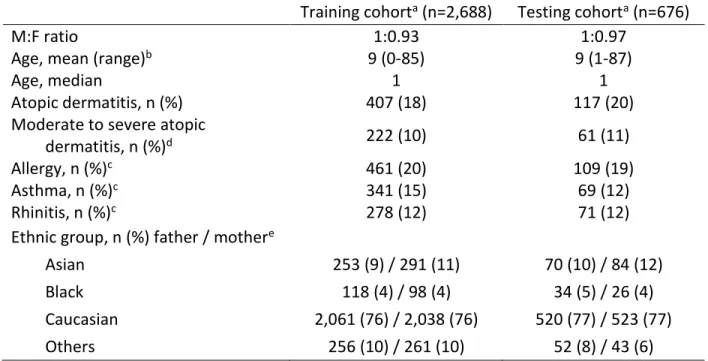
Table E1. Phenotypic characteristics of the samples from two Canadian cohorts with genomic and phenotypic data available
Training cohorta (n=2,688) Testing cohorta (n=676)
M:F ratio 1:0.93 1:0.97
Age, mean (range)b 9 (0-85) 9 (1-87)
Age, median 1 1
Atopic dermatitis, n (%) 407 (18) 117 (20)
Moderate to severe atopic
dermatitis, n (%)d 222 (10) 61 (11)
Allergy, n (%)c 461 (20) 109 (19)
Asthma, n (%)c 341 (15) 69 (12)
Rhinitis, n (%)c 278 (12) 71 (12)
Ethnic group, n (%) father / mothere
Asian 253 (9) / 291 (11) 70 (10) / 84 (12)
Black 118 (4) / 98 (4) 34 (5) / 26 (4)
Caucasian 2,061 (76) / 2,038 (76) 520 (77) / 523 (77)
Others 256 (10) / 261 (10) 52 (8) / 43 (6)
a The training cohort includes 80% of the unrelated cases and controls from the Saguenay‒Lac-Saint-Jean
asthma familial cohort and the CHILD Cohort Study and the testing cohort includes the remaining 20%.
b Age in years for both cohorts. For the CHILD Cohort Study, data for atopic dermatitis to build the polygenic
risk score was from the follow-up at one year old and thus, this age was selected for the phenotypic table.
c Diagnosis of allergy, asthma and rhinitis for the children from the CHILD Cohort Study were from the five
years follow-up. d For the SLSJ cohort, all individuals with atopic dermatitis. e Among the ethnic groups
listed, the Asian category includes individuals who selected South East Asian, East Asian or South Asian, and the Others category includes those who selected Middle Eastern, Hispanic, unknown or mixed (individuals who selected more than one mutually exclusive ethnic groups).
5 Table E2. List of genome-wide association studies considered
First author Title Ethny Subjects Year PMID
Kim KW
Genome-wide association study of recalcitrant atopic dermatitis in Korean children
Korean 802 2015 25935106
Hirota T
Genome-wide association study identifies eight new susceptibility loci for atopic dermatitis in the Japanese population
Japanese 18320 2012 23042114
Paternoster L
Meta-analysis of genome-wide association studies identifies three new risk loci for atopic dermatitis
European 51423 2011 22197932
Baurecht H
Genome-wide comparative analysis of atopic dermatitis and psoriasis gives insight into opposing genetic mechanisms
Mixed 14595 2015 25574825
Schaarschmidt H
A genome-wide association study reveals 2
new susceptibility loci for atopic dermatitis European 9541 2015 25865352
Esparza-Gordillo J
A common variant on chromosome 11q13
is associated with atopic dermatitis European 8508 2009 19349984
Weidinger S
A genome-wide association study of atopic dermatitis identifies loci with overlapping effects on asthma and psoriasis
European 5617 2013 23886662
Sun LD
Genome-wide association study identifies two new susceptibility loci for atopic dermatitis in the Chinese Han population
Chinese / European
18195 /
5062 2011 21666691
Marenholz I Meta-analysis identifies seven susceptibility
6 Table E3. Best 25 GWAS associations in the literature
Chromosome SNP HGVS nomenclaturea Nearest gene / distance (bp)a OR P Reference (PMID)
1 rs12130219 g.152162106A>G HRNR / 22,446 (FLG / 112,545) - 1E-23 25574825
rs12144049 g.152440910C>T LCE5A / 42,410 (FLG / 143,231) 1.54 3E-30 25574825, 25865352
rs61813875 g.152536650C>G LCE3E / 1,525 1.61 6E-29 26482879
rs77199844 g.152757095_152757096del LCE1E / 1,657 1.23 2E-17 25574825
2 rs13015714 g.102971865G>T IL18R1 / 391 1.27 8E-18 23042114, 26482879
rs62176107 g.179300971G>A(p.Leu229=) PRKRA - 1E-34 25574825
3 rs7613051 g.33065339G>A GLB1 1.29 6E-21 23042114
rs12634229 g.112376308T>C CCDC80 / 16,318 1.29 2E-19 23042114
5 rs6596086 g.131952222T>C RAD50 - 2E-18 25574825
rs17728338 g.150478318G>A ANXA6 / 1,949 - 4E-38 25574825
rs2546890 g.158759900A>G IL2B / 2,419 (LOC285626) 1.39 3E-35 25574825
6 rs9368677 g.31272321G>A HLA-C / 32,408 1.36 1E-17 23042114
rs176095 g.32158319T>C GPSM3 / 224 1.4 8E-20 23042114, 25574825
rs9469099 g.32308908G>A TSBP1-AS1, TSBP1 1.61 5E-19 23042114
rs240993 g.111673714T>C REV3L - 6E-18 25574825
rs9481169 g.111929862G>T TRAF3IP2 / 2,385 1.58 1E-26 25574825
rs643177 g.138295693G>A TNFAIP3 1.27 9E-16 25574825
8 rs6473227 g.81285892C>A ZBTB10 / 111,962 - 5E-18 26482879
10 rs10995251 g.64398466C>T ZNF365 1.28 6E-20 23042114
11 rs878860 g.7968359C>T NLRP10 / 12,797 1.31 2E-22 23042114
rs10791824 g.65559266A>G OVOL1 1.12 2E-19 26482879
rs2155219 g.76399194G>T EMSY / 135,119 1.32 2E-12
23886662, 25865352, 26542096
rs7127307 g.128187383T>C ETS1 / 141,273 - 1E-20 26482879
18 rs12458130 g.8667061G>A GACAT2 / 40,558 - 4E-16 25574825
20 rs6020157 g.48591758G>A SNAI1 / 7,755 - 4E-17 25574825
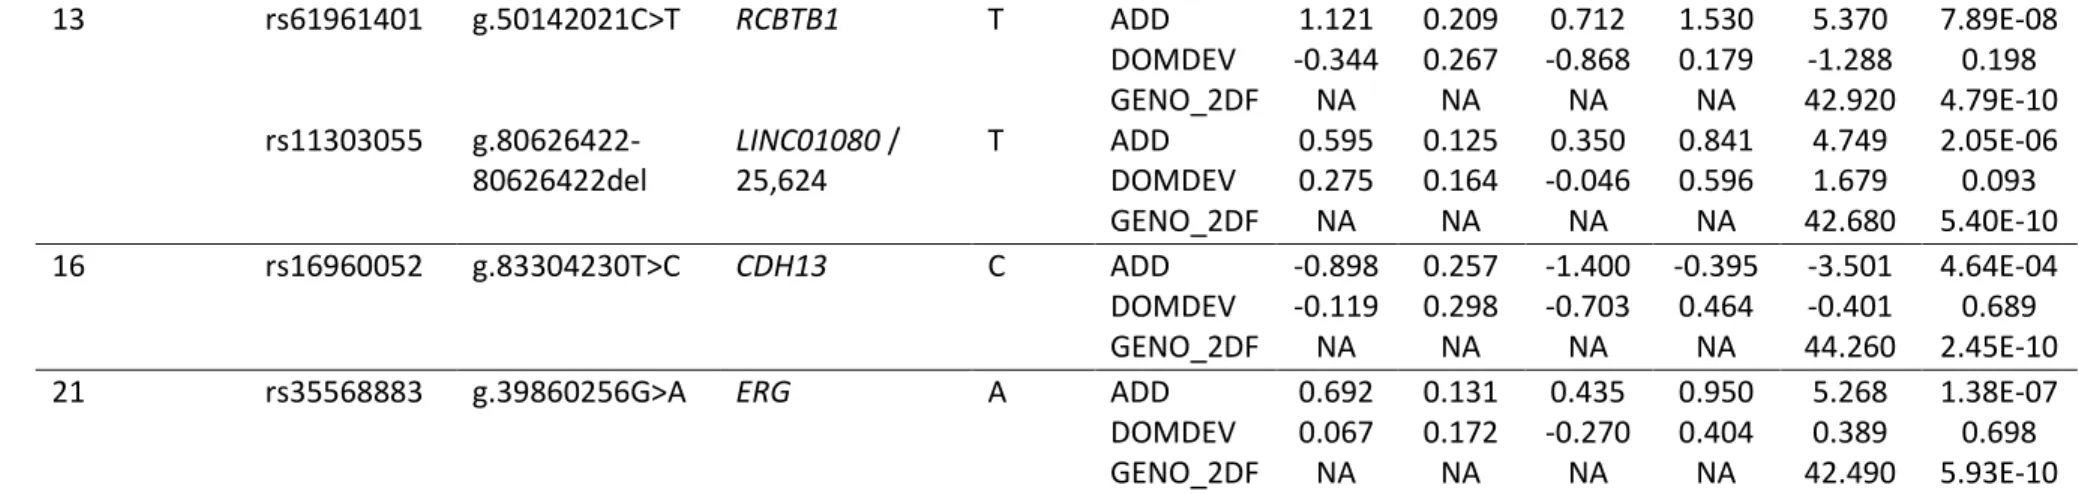
7 Table E4. Best 25 GWAS associations in the Canadian cohorts
Chromosome SNP HGVS nomenclaturea Nearest gene / distance (bp)a Tested allele
TESTb BETA SE L95 U95 STAT P
1 rs146984913 g.218247649- 218247649del LINC01653 / 15,167 A ADD 1.011 0.267 0.488 1.533 3.789 1.51E-04 DOMDEV -0.077 0.307 -0.679 0.524 -0.252 0.801 GENO_2DF NA NA NA NA 40.790 1.39E-09 rs17700654 g.218250573T>C LINC01653 / 18,091 C ADD 1.025 0.267 0.502 1.548 3.842 1.22E-04 DOMDEV -0.029 0.305 -0.627 0.569 -0.095 0.924 GENO_2DF NA NA NA NA 45.970 1.04E-10 2 rs12465939 g.81241811A>C CTNNA2 / 365,823 C ADD -0.566 0.109 -0.780 -0.351 -5.174 2.29E-07 DOMDEV -0.447 0.164 -0.768 -0.126 -2.727 0.006 GENO_2DF NA NA NA NA 53.500 2.41E-12
rs984521 g.133492750G>A NCKAP5 A ADD -0.750 0.117 -0.980 -0.521 -6.406 1.50E-10
DOMDEV 0.272 0.156 -0.033 0.577 1.750 0.080 GENO_2DF NA NA NA NA 41.680 8.90E-10 rs213549 g.234786586C>T MSL3P1 / 9,531 C ADD 1.327 0.098 1.135 1.519 13.530 1.06E-41 DOMDEV 0.456 0.152 0.158 0.754 2.998 0.003 GENO_2DF NA NA NA NA 193.200 1.13E-42 3 rs9825865 g.1865710C>T CNTN4 / 274,777 T ADD -0.712 0.108 -0.923 -0.501 -6.604 4.01E-11 DOMDEV 0.207 0.146 -0.079 0.493 1.416 0.157 GENO_2DF NA NA NA NA 43.610 3.39E-10 rs6778759 g.29956943G>T RBMS3 T ADD 1.039 0.163 0.719 1.359 6.368 1.92E-10 DOMDEV 0.605 0.211 0.192 1.018 2.871 0.004 GENO_2DF NA NA NA NA 126.900 2.84E-28
rs6799780 g.37410704T>G GOLGA4 / 2,334 G ADD 1.188 0.118 0.957 1.420 10.080 6.97E-24
DOMDEV 0.429 0.174 0.088 0.769 2.469 0.014
GENO_2DF NA NA NA NA 159.500 2.37E-35
4 rs983363 g.44206022T>A KCTD8 A ADD 1.126 0.201 0.732 1.521 5.603 2.11E-08
DOMDEV -0.428 0.255 -0.928 0.072 -1.678 0.093 GENO_2DF NA NA NA NA 42.980 4.65E-10 rs11737164 g.154970397G>A DCHS2 / 182,497 A ADD 0.436 0.198 0.049 0.824 2.205 0.027 DOMDEV 0.593 0.232 0.139 1.047 2.561 0.010 GENO_2DF NA NA NA NA 48.100 3.58E-11
8
4 rs1438119 g.166348346T>C CPE C ADD 0.874 0.106 0.666 1.081 8.243 1.68E-16
DOMDEV 0.121 0.152 -0.178 0.420 0.795 0.427 GENO_2DF NA NA NA NA 79.380 5.80E-18 5 rs10053502 g.39979172C>T LINC00603 / 73,221 T ADD 1.259 0.161 0.944 1.574 7.828 4.97E-15 DOMDEV 0.026 0.212 -0.389 0.440 0.121 0.904 GENO_2DF NA NA NA NA 106.500 7.62E-24 6 rs112464710 g.58757732A>G LINC00680-GUSBP4 / 470,008 G ADD 1.035 0.229 0.587 1.484 4.523 6.08E-06 DOMDEV 0.417 0.268 -0.108 0.942 1.558 0.119 GENO_2DF NA NA NA NA 91.930 1.09E-20 rs2321443 g.79204960T>C IRAK1BP1 / 372,301 C ADD -0.706 0.113 -0.926 -0.485 -6.276 3.48E-10 DOMDEV -0.148 0.162 -0.465 0.170 -0.913 0.361 GENO_2DF NA NA NA NA 54.130 1.76E-12
7 rs6943506 g.28470794C>G CREB5 G ADD 0.953 0.262 0.440 1.465 3.643 2.69E-04
DOMDEV 0.006 0.304 -0.590 0.602 0.020 0.984
GENO_2DF NA NA NA NA 40.270 1.80E-09
rs854560 g.94946084A>
T(p.Met55Leu)
PON1 A ADD 0.682 0.097 0.492 0.871 7.054 1.74E-12
DOMDEV -0.142 0.147 -0.429 0.145 -0.970 0.332 GENO_2DF NA NA NA NA 50.520 1.07E-11 rs11984204 g.120352110T>G KCND2 G ADD 0.999 0.150 0.705 1.292 6.662 2.70E-11 DOMDEV 0.127 0.196 -0.257 0.511 0.650 0.516 GENO_2DF NA NA NA NA 81.050 2.51E-18 8 rs4554481 g.19373265T>C CSGALNACT1 C ADD -0.871 0.360 -1.577 -0.166 -2.420 0.016 DOMDEV -0.977 0.450 -1.859 -0.094 -2.169 0.030 GENO_2DF NA NA NA NA 48.400 3.09E-11
rs1841513 g.137811069T>C LINC02055 A ADD -1.171 0.106 -1.379 -0.963 -11.050 2.15E-28
DOMDEV -0.295 0.168 -0.623 0.034 -1.759 0.079
GENO_2DF NA NA NA NA 156.100 1.29E-34
9 rs10512169 g.88540410T>C NAA35 / 15,647 C ADD 1.149 0.262 0.635 1.662 4.385 1.16E-05
DOMDEV 0.013 0.305 -0.585 0.612 0.043 0.965
GENO_2DF NA NA NA NA 58.370 2.12E-13
9 rs17441316 g.132108247C>T LINC01503 T ADD -0.638 0.297 -1.219 -0.056 -2.150 0.032
DOMDEV -1.237 0.416 -2.053 -0.422 -2.974 0.003
9 13 rs61961401 g.50142021C>T RCBTB1 T ADD 1.121 0.209 0.712 1.530 5.370 7.89E-08 DOMDEV -0.344 0.267 -0.868 0.179 -1.288 0.198 GENO_2DF NA NA NA NA 42.920 4.79E-10 rs11303055 g.80626422- 80626422del LINC01080 / 25,624 T ADD 0.595 0.125 0.350 0.841 4.749 2.05E-06 DOMDEV 0.275 0.164 -0.046 0.596 1.679 0.093 GENO_2DF NA NA NA NA 42.680 5.40E-10 16 rs16960052 g.83304230T>C CDH13 C ADD -0.898 0.257 -1.400 -0.395 -3.501 4.64E-04 DOMDEV -0.119 0.298 -0.703 0.464 -0.401 0.689 GENO_2DF NA NA NA NA 44.260 2.45E-10
21 rs35568883 g.39860256G>A ERG A ADD 0.692 0.131 0.435 0.950 5.268 1.38E-07
DOMDEV 0.067 0.172 -0.270 0.404 0.389 0.698
GENO_2DF NA NA NA NA 42.490 5.93E-10
aAccording to the human genome version 19 (hg19).
bTest refers to the additive effect (ADD), the dominance deviation (DOMDEV) or the joined test (GENO_2DF), the later giving the general p value
for the association.
Table E5. Comparison of each decile of the polygenic risk score built from associated SNPs in the literature or in two Canadian cohorts to the first
Associations from the literature Associations in two Canadian cohorts
Decile Coefficient OR SE P Coefficient OR SE P
second -0.332 0.718 0.593 0.576 -1.377 0.252 1.121 0.219 third 0.375 1.456 0.502 0.455 0.228 1.256 0.678 0.737 fourth 0.813 2.254 0.463 0.079 0.930 2.535 0.599 0.121 fifth 0.605 1.832 0.479 0.206 -0.044 0.957 0.713 0.950 sixth 0.999 2.714 0.452 0.027 -0.288 0.750 0.770 0.709 seventh 1.355 3.876 0.437 0.002 0.958 2.607 0.599 0.110 eighth 1.369 3.930 0.435 0.002 0.925 2.523 0.599 0.123
ninth 1.565 4.781 0.427 2.54E-04 2.862 17.500 0.525 4.94E-08
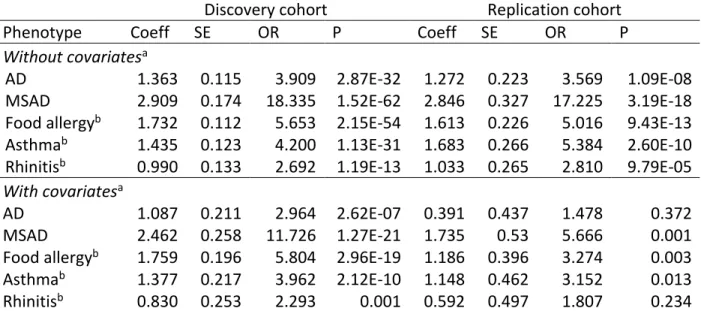
10 Table E6. Association between the binary polygenic risk score calculated with SNPs from
association within the Canadian population and phenotypes of the atopic march
Discovery cohort Replication cohort
Phenotype Coeff SE OR P Coeff SE OR P
Without covariatesa
AD 1.363 0.115 3.909 2.87E-32 1.272 0.223 3.569 1.09E-08 MSAD 2.909 0.174 18.335 1.52E-62 2.846 0.327 17.225 3.19E-18 Food allergyb 1.732 0.112 5.653 2.15E-54 1.613 0.226 5.016 9.43E-13 Asthmab 1.435 0.123 4.200 1.13E-31 1.683 0.266 5.384 2.60E-10 Rhinitisb 0.990 0.133 2.692 1.19E-13 1.033 0.265 2.810 9.79E-05 With covariatesa
AD 1.087 0.211 2.964 2.62E-07 0.391 0.437 1.478 0.372 MSAD 2.462 0.258 11.726 1.27E-21 1.735 0.53 5.666 0.001 Food allergyb 1.759 0.196 5.804 2.96E-19 1.186 0.396 3.274 0.003 Asthmab 1.377 0.217 3.962 2.12E-10 1.148 0.462 3.152 0.013 Rhinitisb 0.830 0.253 2.293 0.001 0.592 0.497 1.807 0.234 aCovariates used in the statistical model were age, sex, father's ethnicity and mother's ethnicity. bFood
allergy, asthma and rhinitis phenotypes were assessed at the five years follow-up for the children of the CHILD Cohort Study.
Abbreviations: AD = atopic dermatitis, Coeff = coefficient, MSAD = moderate to severe atopic dermatitis.
SUPPLEMENTARY FIGURE LEGENDS
Figure E1. Schematic view of the individuals included in analyses performed in this study. The figure shows the number of individuals from the two Canadian cohorts that were included in the analyses performed in this study for the training cohort which was used to develop the polygenic risk score (PRS) and the testing cohort which was used to validate its discriminative value.
Figure E2. ROC curves for the polygenic risk scores with a reduced number of SNPs using associations in two Canadian cohorts. This figure shows the ROC curves and the area under the curves (AUCs) for the polygenic risk scores (PRSs) calculated for associated SNPs in the training cohort (80% of the unrelated cases and controls from the two Canadian cohorts) with p values < 1x10⁻¹⁰, using a model without (a) and with (b) the covariates as well as the comparison between deciles 2 to 10 with decile 1 for the PRS with covariates (c). The ROC curves with the AUCs for the binary values from the PRS without (d) and with (e) covariates in the testing cohort (20% of the samples) is also shown.